
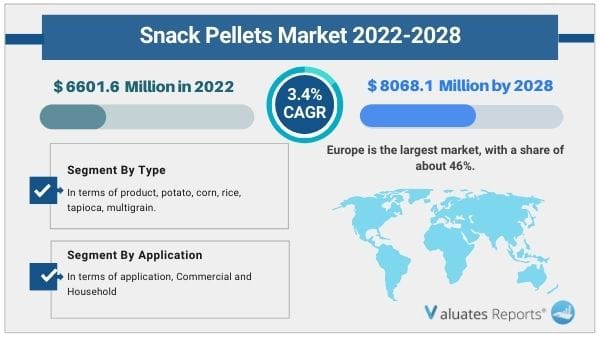
The global snack pellets market size is estimated to be worth US$ 6601.6 million in 2022 and is projected to reach US$ 8068.1 million by 2028 with a CAGR of 3.4% during the forecast period. Key drivers of the snack pellets market include the growing interest of consumers towards ready-to-eat convenience food products and health-conscious habits.
Moreover, the easy availability of raw materials and continuous innovations by key market players will drive the growth of the snack pellets market during the forecast period.
The popularity of extruded snacks is rising rapidly which will create lucrative opportunities for the growth of the market in the coming years.
Growing interest of consumers and health-conscious habits
The rising industrialization has led to busier lifestyles for consumers. They want snacks that are ready to eat, convenient, and high on nutritional value. Snack pellets are enough to satisfy a craving or hold until the next big meal. Moreover, health-conscious consumers want snacks that are tasty, non-oily, and provide nutrition on the go. Snack pellets are made using corn, potato, rice, multigrain products which have less oil absorption. The hot air expansion technique prevents the formation of acrylamide which is harmful to the heart. Further, these pellets are low in sodium, carbohydrates and are gluten-free. Thus growing interest among consumers and increasing health-conscious habits have driven the demand for snack pellets thereby driving the growth of the snack pellets market during the forecast period.
Easy availability of raw materials, benefits, and continuous innovations
The raw materials of snack pellets are easily available allowing key market players to expand their production capacities quickly. In addition to it, snack pellets have a long shelf life, stability, easy storage, and bulk density. In addition to it, companies are experimenting with a variety of shapes, sizes, and textures that can be eaten at all times and are sweet, crunchy, and savory. Thus easy availability of raw materials, benefits, and continuous innovations by key market players will drive the growth of the snack pellets market in the coming years.
Popularity of extruded snacks
Extruded snacks are high fiber, high protein, and low-calorie snacks which are made using potatoes, corn, or onions. These snacks are growing in popularity as they have better taste, visual appeal, and help manufacturers cater to a growing health-conscious audience. Thus the growing popularity of extruded snacks will drive the growth of the snack pellets market during the forecast period.
Based on type, the multigrain segment is expected to provide lucrative opportunities for growth in the snack pellets market share during the forecast period as the demand for multigrain is rising due to growing nutritional and taste benefits.
Based on form, the gelatinized segment is expected to provide lucrative opportunities for growth in the snack pellets market share as these pellets are prepared using a high-speed rotary cutting machine in bulk.
Based on equipment, a single screw extruder is expected to provide lucrative opportunities for growth in the snack pellets market share as they are used by the majority of key market players and are easy to operate and maintain.
Based on region, Europe will hold a share of 46% and is expected to provide lucrative opportunities for growth in the snack pellets market share due to the huge preference for snacking and growing snack food market.
The authors of this study have enlightened the readers on the rise and effect of the Covid-19 outbreak on the development. They have investigated the changes brought about in the demand/supply side, consumption, supply chain, and sales/manufacturing. The readers will get familiar with the measures that have helped the key players to bring the Snack Pellets market back to the pre-covid levels.
In this segment of the report, the specialists have delved into the key growth opportunities that are likely to emerge. This will aid the key players to simplify complex issues related to business and framing future strategies to compete in this competitive environment. This section will certainly assist the players in boldly positioning their business.
In this section of the report, the researchers have done a comprehensive analysis of the prominent players operating and the strategies they are focusing on to combat the intense competition. Company profiles and share analysis of the prominent players are also provided in this section. They have also provided reliable sales and revenue data of the manufacturers for the period 2017-2022. With the assistance of this report, key players, stakeholders, and other participants will be able to stay abreast of the recent and upcoming developments in the business, further enabling them to make efficient choices.
| Report Metric | Details |
| Report Name | Snack Pellet Market |
| The market size in 2022 | USD 6601.6 Million |
| The revenue forecast in 2028 | USD 8068.1 Million |
| Growth Rate | Compound Annual Growth Rate (CAGR) of 3.4% from 2022 to 2028 |
| Market size available for years | 2022-2028 |
| Forecast units | Value (USD) |
| Segments covered | Type, Application and Region |
| Report coverage | Revenue & volume forecast, company share, competitive landscape, growth factors, and trends |
| Geographic regions covered | North America, Europe, Asia Pacific, Latin America, Middle East & Africa |
Ans. The global Snack Pellet market size is projected to reach US$ 8068.1 million by 2028, from US$ 6601.6 million in 2022.
Ans. The global Snack Pellet market is expected to grow at a compound annual growth rate of 3.4% from 2022 to 2028.
Ans. Some of the major companies are LIVEN SA, Noble Agro Food Products, Mafin, Tri-Snax, Quality Pellets A/S, SUNDLINGS, Valin, Chhajed Foods Pvt. Ltd., Foodlink, Le Caselle, Leng D’or.
Table of Contents
1 Study Coverage
1.1 Snack Pellets Product Introduction
1.2 Market by Type
1.2.1 Global Snack Pellets Market Size Growth Rate by Type, 2017 VS 2021 VS 2028
1.2.2 Potato Based
1.2.3 Corn Based
1.2.4 Rice Based
1.2.5 Tapioca Based
1.2.6 Multigrain Based
1.3 Market by Application
1.3.1 Global Snack Pellets Market Size Growth Rate by Application, 2017 VS 2021 VS 2028
1.3.2 Commercial
1.3.3 Household
1.4 Study Objectives
1.5 Years Considered
2 Executive Summary
2.1 Global Snack Pellets Sales Estimates and Forecasts 2017-2028
2.2 Global Snack Pellets Revenue Estimates and Forecasts 2017-2028
2.3 Global Snack Pellets Revenue by Region: 2017 VS 2021 VS 2028
2.4 Global Snack Pellets Sales by Region
2.4.1 Global Snack Pellets Sales by Region (2017-2022)
2.4.2 Global Sales Snack Pellets by Region (2023-2028)
2.5 Global Snack Pellets Revenue by Region
2.5.1 Global Snack Pellets Revenue by Region (2017-2022)
2.5.2 Global Snack Pellets Revenue by Region (2023-2028)
2.6 North America
2.7 Europe
2.8 Asia-Pacific
2.9 Latin America
2.10 Middle East & Africa
3 Competition by Manufacturers
3.1 Global Snack Pellets Sales by Manufacturers
3.1.1 Global Top Snack Pellets Manufacturers by Sales (2017-2022)
3.1.2 Global Snack Pellets Sales Market Share by Manufacturers (2017-2022)
3.1.3 Global Top 10 and Top 5 Largest Manufacturers of Snack Pellets in 2021
3.2 Global Snack Pellets Revenue by Manufacturers
3.2.1 Global Snack Pellets Revenue by Manufacturers (2017-2022)
3.2.2 Global Snack Pellets Revenue Market Share by Manufacturers (2017-2022)
3.2.3 Global Top 10 and Top 5 Companies by Snack Pellets Revenue in 2021
3.3 Global Snack Pellets Sales Price by Manufacturers (2017-2022)
3.4 Analysis of Competitive Landscape
3.4.1 Manufacturers Market Concentration Ratio (CR5 and HHI)
3.4.2 Global Snack Pellets Market Share by Company Type (Tier 1, Tier 2, and Tier 3)
3.4.3 Global Snack Pellets Manufacturers Geographical Distribution
3.5 Mergers & Acquisitions, Expansion Plans
4 Market Size by Type
4.1 Global Snack Pellets Sales by Type
4.1.1 Global Snack Pellets Historical Sales by Type (2017-2022)
4.1.2 Global Snack Pellets Forecasted Sales by Type (2023-2028)
4.1.3 Global Snack Pellets Sales Market Share by Type (2017-2028)
4.2 Global Snack Pellets Revenue by Type
4.2.1 Global Snack Pellets Historical Revenue by Type (2017-2022)
4.2.2 Global Snack Pellets Forecasted Revenue by Type (2023-2028)
4.2.3 Global Snack Pellets Revenue Market Share by Type (2017-2028)
4.3 Global Snack Pellets Price by Type
4.3.1 Global Snack Pellets Price by Type (2017-2022)
4.3.2 Global Snack Pellets Price Forecast by Type (2023-2028)
5 Market Size by Application
5.1 Global Snack Pellets Sales by Application
5.1.1 Global Snack Pellets Historical Sales by Application (2017-2022)
5.1.2 Global Snack Pellets Forecasted Sales by Application (2023-2028)
5.1.3 Global Snack Pellets Sales Market Share by Application (2017-2028)
5.2 Global Snack Pellets Revenue by Application
5.2.1 Global Snack Pellets Historical Revenue by Application (2017-2022)
5.2.2 Global Snack Pellets Forecasted Revenue by Application (2023-2028)
5.2.3 Global Snack Pellets Revenue Market Share by Application (2017-2028)
5.3 Global Snack Pellets Price by Application
5.3.1 Global Snack Pellets Price by Application (2017-2022)
5.3.2 Global Snack Pellets Price Forecast by Application (2023-2028)
6 North America
6.1 North America Snack Pellets Market Size by Type
6.1.1 North America Snack Pellets Sales by Type (2017-2028)
6.1.2 North America Snack Pellets Revenue by Type (2017-2028)
6.2 North America Snack Pellets Market Size by Application
6.2.1 North America Snack Pellets Sales by Application (2017-2028)
6.2.2 North America Snack Pellets Revenue by Application (2017-2028)
6.3 North America Snack Pellets Market Size by Country
6.3.1 North America Snack Pellets Sales by Country (2017-2028)
6.3.2 North America Snack Pellets Revenue by Country (2017-2028)
6.3.3 U.S.
6.3.4 Canada
7 Europe
7.1 Europe Snack Pellets Market Size by Type
7.1.1 Europe Snack Pellets Sales by Type (2017-2028)
7.1.2 Europe Snack Pellets Revenue by Type (2017-2028)
7.2 Europe Snack Pellets Market Size by Application
7.2.1 Europe Snack Pellets Sales by Application (2017-2028)
7.2.2 Europe Snack Pellets Revenue by Application (2017-2028)
7.3 Europe Snack Pellets Market Size by Country
7.3.1 Europe Snack Pellets Sales by Country (2017-2028)
7.3.2 Europe Snack Pellets Revenue by Country (2017-2028)
7.3.3 Germany
7.3.4 France
7.3.5 U.K.
7.3.6 Italy
7.3.7 Russia
8 Asia Pacific
8.1 Asia Pacific Snack Pellets Market Size by Type
8.1.1 Asia Pacific Snack Pellets Sales by Type (2017-2028)
8.1.2 Asia Pacific Snack Pellets Revenue by Type (2017-2028)
8.2 Asia Pacific Snack Pellets Market Size by Application
8.2.1 Asia Pacific Snack Pellets Sales by Application (2017-2028)
8.2.2 Asia Pacific Snack Pellets Revenue by Application (2017-2028)
8.3 Asia Pacific Snack Pellets Market Size by Region
8.3.1 Asia Pacific Snack Pellets Sales by Region (2017-2028)
8.3.2 Asia Pacific Snack Pellets Revenue by Region (2017-2028)
8.3.3 China
8.3.4 Japan
8.3.5 South Korea
8.3.6 India
8.3.7 Australia
8.3.8 Taiwan
8.3.9 Indonesia
8.3.10 Thailand
8.3.11 Malaysia
8.3.12 Philippines
9 Latin America
9.1 Latin America Snack Pellets Market Size by Type
9.1.1 Latin America Snack Pellets Sales by Type (2017-2028)
9.1.2 Latin America Snack Pellets Revenue by Type (2017-2028)
9.2 Latin America Snack Pellets Market Size by Application
9.2.1 Latin America Snack Pellets Sales by Application (2017-2028)
9.2.2 Latin America Snack Pellets Revenue by Application (2017-2028)
9.3 Latin America Snack Pellets Market Size by Country
9.3.1 Latin America Snack Pellets Sales by Country (2017-2028)
9.3.2 Latin America Snack Pellets Revenue by Country (2017-2028)
9.3.3 Mexico
9.3.4 Brazil
9.3.5 Argentina
10 Middle East and Africa
10.1 Middle East and Africa Snack Pellets Market Size by Type
10.1.1 Middle East and Africa Snack Pellets Sales by Type (2017-2028)
10.1.2 Middle East and Africa Snack Pellets Revenue by Type (2017-2028)
10.2 Middle East and Africa Snack Pellets Market Size by Application
10.2.1 Middle East and Africa Snack Pellets Sales by Application (2017-2028)
10.2.2 Middle East and Africa Snack Pellets Revenue by Application (2017-2028)
10.3 Middle East and Africa Snack Pellets Market Size by Country
10.3.1 Middle East and Africa Snack Pellets Sales by Country (2017-2028)
10.3.2 Middle East and Africa Snack Pellets Revenue by Country (2017-2028)
10.3.3 Turkey
10.3.4 Saudi Arabia
11 Company Profiles
11.1 LIVEN SA
11.1.1 LIVEN SA Corporation Information
11.1.2 LIVEN SA Overview
11.1.3 LIVEN SA Snack Pellets Sales, Price, Revenue and Gross Margin (2017-2022)
11.1.4 LIVEN SA Snack Pellets Product Model Numbers, Pictures, Descriptions and Specifications
11.1.5 LIVEN SA Recent Developments
11.2 Noble Agro Food Products
11.2.1 Noble Agro Food Products Corporation Information
11.2.2 Noble Agro Food Products Overview
11.2.3 Noble Agro Food Products Snack Pellets Sales, Price, Revenue and Gross Margin (2017-2022)
11.2.4 Noble Agro Food Products Snack Pellets Product Model Numbers, Pictures, Descriptions and Specifications
11.2.5 Noble Agro Food Products Recent Developments
11.3 Mafin
11.3.1 Mafin Corporation Information
11.3.2 Mafin Overview
11.3.3 Mafin Snack Pellets Sales, Price, Revenue and Gross Margin (2017-2022)
11.3.4 Mafin Snack Pellets Product Model Numbers, Pictures, Descriptions and Specifications
11.3.5 Mafin Recent Developments
11.4 Tri-Snax
11.4.1 Tri-Snax Corporation Information
11.4.2 Tri-Snax Overview
11.4.3 Tri-Snax Snack Pellets Sales, Price, Revenue and Gross Margin (2017-2022)
11.4.4 Tri-Snax Snack Pellets Product Model Numbers, Pictures, Descriptions and Specifications
11.4.5 Tri-Snax Recent Developments
11.5 Quality Pellets A/S
11.5.1 Quality Pellets A/S Corporation Information
11.5.2 Quality Pellets A/S Overview
11.5.3 Quality Pellets A/S Snack Pellets Sales, Price, Revenue and Gross Margin (2017-2022)
11.5.4 Quality Pellets A/S Snack Pellets Product Model Numbers, Pictures, Descriptions and Specifications
11.5.5 Quality Pellets A/S Recent Developments
11.6 SUNDLINGS
11.6.1 SUNDLINGS Corporation Information
11.6.2 SUNDLINGS Overview
11.6.3 SUNDLINGS Snack Pellets Sales, Price, Revenue and Gross Margin (2017-2022)
11.6.4 SUNDLINGS Snack Pellets Product Model Numbers, Pictures, Descriptions and Specifications
11.6.5 SUNDLINGS Recent Developments
11.7 Valin
11.7.1 Valin Corporation Information
11.7.2 Valin Overview
11.7.3 Valin Snack Pellets Sales, Price, Revenue and Gross Margin (2017-2022)
11.7.4 Valin Snack Pellets Product Model Numbers, Pictures, Descriptions and Specifications
11.7.5 Valin Recent Developments
11.8 Chhajed Foods Pvt. Ltd.
11.8.1 Chhajed Foods Pvt. Ltd. Corporation Information
11.8.2 Chhajed Foods Pvt. Ltd. Overview
11.8.3 Chhajed Foods Pvt. Ltd. Snack Pellets Sales, Price, Revenue and Gross Margin (2017-2022)
11.8.4 Chhajed Foods Pvt. Ltd. Snack Pellets Product Model Numbers, Pictures, Descriptions and Specifications
11.8.5 Chhajed Foods Pvt. Ltd. Recent Developments
11.9 Foodlink
11.9.1 Foodlink Corporation Information
11.9.2 Foodlink Overview
11.9.3 Foodlink Snack Pellets Sales, Price, Revenue and Gross Margin (2017-2022)
11.9.4 Foodlink Snack Pellets Product Model Numbers, Pictures, Descriptions and Specifications
11.9.5 Foodlink Recent Developments
11.10 Le Caselle
11.10.1 Le Caselle Corporation Information
11.10.2 Le Caselle Overview
11.10.3 Le Caselle Snack Pellets Sales, Price, Revenue and Gross Margin (2017-2022)
11.10.4 Le Caselle Snack Pellets Product Model Numbers, Pictures, Descriptions and Specifications
11.10.5 Le Caselle Recent Developments
11.11 Leng D’or
11.11.1 Leng D’or Corporation Information
11.11.2 Leng D’or Overview
11.11.3 Leng D’or Snack Pellets Sales, Price, Revenue and Gross Margin (2017-2022)
11.11.4 Leng D’or Snack Pellets Product Model Numbers, Pictures, Descriptions and Specifications
11.11.5 Leng D’or Recent Developments
12 Industry Chain and Sales Channels Analysis
12.1 Snack Pellets Industry Chain Analysis
12.2 Snack Pellets Key Raw Materials
12.2.1 Key Raw Materials
12.2.2 Raw Materials Key Suppliers
12.3 Snack Pellets Production Mode & Process
12.4 Snack Pellets Sales and Marketing
12.4.1 Snack Pellets Sales Channels
12.4.2 Snack Pellets Distributors
12.5 Snack Pellets Customers
13 Market Drivers, Opportunities, Challenges, and Risks Factors Analysis
13.1 Snack Pellets Industry Trends
13.2 Snack Pellets Market Drivers
13.3 Snack Pellets Market Challenges
13.4 Snack Pellets Market Restraints
14 Key Findings in The Global Snack Pellets Study
15 Appendix
15.1 Research Methodology
15.1.1 Methodology/Research Approach
15.1.2 Data Source
15.2 Author Details
15.3 Disclaimer
List of Tables
Table 1. Global Snack Pellets Market Size Growth Rate by Type, 2017 VS 2021 VS 2028 (US$ Million)
Table 2. Major Manufacturers of Potato Based
Table 3. Major Manufacturers of Corn Based
Table 4. Major Manufacturers of Rice Based
Table 5. Major Manufacturers of Tapioca Based
Table 6. Major Manufacturers of Multigrain Based
Table 7. Global Snack Pellets Market Size Growth Rate by Application, 2017 VS 2021 VS 2028 (US$ Million)
Table 8. Global Snack Pellets Revenue by Region: 2017 VS 2021 VS 2028 (US$ Million)
Table 9. Global Snack Pellets Sales by Region (2017-2022) & (K MT)
Table 10. Global Snack Pellets Sales Market Share by Region (2017-2022)
Table 11. Global Snack Pellets Sales by Region (2023-2028) & (K MT)
Table 12. Global Snack Pellets Sales Market Share by Region (2023-2028)
Table 13. Global Snack Pellets Revenue by Region (2017-2022) & (US$ Million)
Table 14. Global Snack Pellets Revenue Market Share by Region (2017-2022)
Table 15. Global Snack Pellets Revenue by Region (2023-2028) & (US$ Million)
Table 16. Global Snack Pellets Revenue Market Share by Region (2023-2028)
Table 17. Global Snack Pellets Sales by Manufacturers (2017-2022) & (K MT)
Table 18. Global Snack Pellets Sales Share by Manufacturers (2017-2022)
Table 19. Global Snack Pellets Revenue by Manufacturers (2017-2022) & (US$ Million)
Table 20. Global Snack Pellets Revenue Share by Manufacturers (2017-2022)
Table 21. Snack Pellets Price by Manufacturers (2017-2022) &(USD/MT)
Table 22. Global Snack Pellets Manufacturers Market Concentration Ratio (CR5 and HHI)
Table 23. Global Snack Pellets by Company Type (Tier 1, Tier 2, and Tier 3) & (based on the Revenue in Snack Pellets as of 2021)
Table 24. Snack Pellets Manufacturing Base Distribution and Headquarters
Table 25. Manufacturers Snack Pellets Product Offered
Table 26. Date of Manufacturers Enter into Snack Pellets Market
Table 27. Mergers & Acquisitions, Expansion Plans
Table 28. Global Snack Pellets Sales by Type (2017-2022) & (K MT)
Table 29. Global Snack Pellets Sales by Type (2023-2028) & (K MT)
Table 30. Global Snack Pellets Sales Share by Type (2017-2022)
Table 31. Global Snack Pellets Sales Share by Type (2023-2028)
Table 32. Global Snack Pellets Revenue by Type (2017-2022) & (US$ Million)
Table 33. Global Snack Pellets Revenue by Type (2023-2028) & (US$ Million)
Table 34. Global Snack Pellets Revenue Share by Type (2017-2022)
Table 35. Global Snack Pellets Revenue Share by Type (2023-2028)
Table 36. Snack Pellets Price by Type (2017-2022) & (USD/MT)
Table 37. Global Snack Pellets Price Forecast by Type (2023-2028) & (USD/MT)
Table 38. Global Snack Pellets Sales by Application (2017-2022) & (K MT)
Table 39. Global Snack Pellets Sales by Application (2023-2028) & (K MT)
Table 40. Global Snack Pellets Sales Share by Application (2017-2022)
Table 41. Global Snack Pellets Sales Share by Application (2023-2028)
Table 42. Global Snack Pellets Revenue by Application (2017-2022) & (US$ Million)
Table 43. Global Snack Pellets Revenue by Application (2023-2028) & (US$ Million)
Table 44. Global Snack Pellets Revenue Share by Application (2017-2022)
Table 45. Global Snack Pellets Revenue Share by Application (2023-2028)
Table 46. Snack Pellets Price by Application (2017-2022) & (USD/MT)
Table 47. Global Snack Pellets Price Forecast by Application (2023-2028) & (USD/MT)
Table 48. North America Snack Pellets Sales by Type (2017-2022) & (K MT)
Table 49. North America Snack Pellets Sales by Type (2023-2028) & (K MT)
Table 50. North America Snack Pellets Revenue by Type (2017-2022) & (US$ Million)
Table 51. North America Snack Pellets Revenue by Type (2023-2028) & (US$ Million)
Table 52. North America Snack Pellets Sales by Application (2017-2022) & (K MT)
Table 53. North America Snack Pellets Sales by Application (2023-2028) & (K MT)
Table 54. North America Snack Pellets Revenue by Application (2017-2022) & (US$ Million)
Table 55. North America Snack Pellets Revenue by Application (2023-2028) & (US$ Million)
Table 56. North America Snack Pellets Sales by Country (2017-2022) & (K MT)
Table 57. North America Snack Pellets Sales by Country (2023-2028) & (K MT)
Table 58. North America Snack Pellets Revenue by Country (2017-2022) & (US$ Million)
Table 59. North America Snack Pellets Revenue by Country (2023-2028) & (US$ Million)
Table 60. Europe Snack Pellets Sales by Type (2017-2022) & (K MT)
Table 61. Europe Snack Pellets Sales by Type (2023-2028) & (K MT)
Table 62. Europe Snack Pellets Revenue by Type (2017-2022) & (US$ Million)
Table 63. Europe Snack Pellets Revenue by Type (2023-2028) & (US$ Million)
Table 64. Europe Snack Pellets Sales by Application (2017-2022) & (K MT)
Table 65. Europe Snack Pellets Sales by Application (2023-2028) & (K MT)
Table 66. Europe Snack Pellets Revenue by Application (2017-2022) & (US$ Million)
Table 67. Europe Snack Pellets Revenue by Application (2023-2028) & (US$ Million)
Table 68. Europe Snack Pellets Sales by Country (2017-2022) & (K MT)
Table 69. Europe Snack Pellets Sales by Country (2023-2028) & (K MT)
Table 70. Europe Snack Pellets Revenue by Country (2017-2022) & (US$ Million)
Table 71. Europe Snack Pellets Revenue by Country (2023-2028) & (US$ Million)
Table 72. Asia Pacific Snack Pellets Sales by Type (2017-2022) & (K MT)
Table 73. Asia Pacific Snack Pellets Sales by Type (2023-2028) & (K MT)
Table 74. Asia Pacific Snack Pellets Revenue by Type (2017-2022) & (US$ Million)
Table 75. Asia Pacific Snack Pellets Revenue by Type (2023-2028) & (US$ Million)
Table 76. Asia Pacific Snack Pellets Sales by Application (2017-2022) & (K MT)
Table 77. Asia Pacific Snack Pellets Sales by Application (2023-2028) & (K MT)
Table 78. Asia Pacific Snack Pellets Revenue by Application (2017-2022) & (US$ Million)
Table 79. Asia Pacific Snack Pellets Revenue by Application (2023-2028) & (US$ Million)
Table 80. Asia Pacific Snack Pellets Sales by Region (2017-2022) & (K MT)
Table 81. Asia Pacific Snack Pellets Sales by Region (2023-2028) & (K MT)
Table 82. Asia Pacific Snack Pellets Revenue by Region (2017-2022) & (US$ Million)
Table 83. Asia Pacific Snack Pellets Revenue by Region (2023-2028) & (US$ Million)
Table 84. Latin America Snack Pellets Sales by Type (2017-2022) & (K MT)
Table 85. Latin America Snack Pellets Sales by Type (2023-2028) & (K MT)
Table 86. Latin America Snack Pellets Revenue by Type (2017-2022) & (US$ Million)
Table 87. Latin America Snack Pellets Revenue by Type (2023-2028) & (US$ Million)
Table 88. Latin America Snack Pellets Sales by Application (2017-2022) & (K MT)
Table 89. Latin America Snack Pellets Sales by Application (2023-2028) & (K MT)
Table 90. Latin America Snack Pellets Revenue by Application (2017-2022) & (US$ Million)
Table 91. Latin America Snack Pellets Revenue by Application (2023-2028) & (US$ Million)
Table 92. Latin America Snack Pellets Sales by Country (2017-2022) & (K MT)
Table 93. Latin America Snack Pellets Sales by Country (2023-2028) & (K MT)
Table 94. Latin America Snack Pellets Revenue by Country (2017-2022) & (US$ Million)
Table 95. Latin America Snack Pellets Revenue by Country (2023-2028) & (US$ Million)
Table 96. Middle East and Africa Snack Pellets Sales by Type (2017-2022) & (K MT)
Table 97. Middle East and Africa Snack Pellets Sales by Type (2023-2028) & (K MT)
Table 98. Middle East and Africa Snack Pellets Revenue by Type (2017-2022) & (US$ Million)
Table 99. Middle East and Africa Snack Pellets Revenue by Type (2023-2028) & (US$ Million)
Table 100. Middle East and Africa Snack Pellets Sales by Application (2017-2022) & (K MT)
Table 101. Middle East and Africa Snack Pellets Sales by Application (2023-2028) & (K MT)
Table 102. Middle East and Africa Snack Pellets Revenue by Application (2017-2022) & (US$ Million)
Table 103. Middle East and Africa Snack Pellets Revenue by Application (2023-2028) & (US$ Million)
Table 104. Middle East and Africa Snack Pellets Sales by Country (2017-2022) & (K MT)
Table 105. Middle East and Africa Snack Pellets Sales by Country (2023-2028) & (K MT)
Table 106. Middle East and Africa Snack Pellets Revenue by Country (2017-2022) & (US$ Million)
Table 107. Middle East and Africa Snack Pellets Revenue by Country (2023-2028) & (US$ Million)
Table 108. LIVEN SA Corporation Information
Table 109. LIVEN SA Description and Major Businesses
Table 110. LIVEN SA Snack Pellets Sales (K MT), Revenue (US$ Million), Price (USD/MT) and Gross Margin (2017-2022)
Table 111. LIVEN SA Snack Pellets Product Model Numbers, Pictures, Descriptions and Specifications
Table 112. LIVEN SA Recent Developments
Table 113. Noble Agro Food Products Corporation Information
Table 114. Noble Agro Food Products Description and Major Businesses
Table 115. Noble Agro Food Products Snack Pellets Sales (K MT), Revenue (US$ Million), Price (USD/MT) and Gross Margin (2017-2022)
Table 116. Noble Agro Food Products Snack Pellets Product Model Numbers, Pictures, Descriptions and Specifications
Table 117. Noble Agro Food Products Recent Developments
Table 118. Mafin Corporation Information
Table 119. Mafin Description and Major Businesses
Table 120. Mafin Snack Pellets Sales (K MT), Revenue (US$ Million), Price (USD/MT) and Gross Margin (2017-2022)
Table 121. Mafin Snack Pellets Product Model Numbers, Pictures, Descriptions and Specifications
Table 122. Mafin Recent Developments
Table 123. Tri-Snax Corporation Information
Table 124. Tri-Snax Description and Major Businesses
Table 125. Tri-Snax Snack Pellets Sales (K MT), Revenue (US$ Million), Price (USD/MT) and Gross Margin (2017-2022)
Table 126. Tri-Snax Snack Pellets Product Model Numbers, Pictures, Descriptions and Specifications
Table 127. Tri-Snax Recent Developments
Table 128. Quality Pellets A/S Corporation Information
Table 129. Quality Pellets A/S Description and Major Businesses
Table 130. Quality Pellets A/S Snack Pellets Sales (K MT), Revenue (US$ Million), Price (USD/MT) and Gross Margin (2017-2022)
Table 131. Quality Pellets A/S Snack Pellets Product Model Numbers, Pictures, Descriptions and Specifications
Table 132. Quality Pellets A/S Recent Developments
Table 133. SUNDLINGS Corporation Information
Table 134. SUNDLINGS Description and Major Businesses
Table 135. SUNDLINGS Snack Pellets Sales (K MT), Revenue (US$ Million), Price (USD/MT) and Gross Margin (2017-2022)
Table 136. SUNDLINGS Snack Pellets Product Model Numbers, Pictures, Descriptions and Specifications
Table 137. SUNDLINGS Recent Developments
Table 138. Valin Corporation Information
Table 139. Valin Description and Major Businesses
Table 140. Valin Snack Pellets Sales (K MT), Revenue (US$ Million), Price (USD/MT) and Gross Margin (2017-2022)
Table 141. Valin Snack Pellets Product Model Numbers, Pictures, Descriptions and Specifications
Table 142. Valin Recent Developments
Table 143. Chhajed Foods Pvt. Ltd. Corporation Information
Table 144. Chhajed Foods Pvt. Ltd. Description and Major Businesses
Table 145. Chhajed Foods Pvt. Ltd. Snack Pellets Sales (K MT), Revenue (US$ Million), Price (USD/MT) and Gross Margin (2017-2022)
Table 146. Chhajed Foods Pvt. Ltd. Snack Pellets Product Model Numbers, Pictures, Descriptions and Specifications
Table 147. Chhajed Foods Pvt. Ltd. Recent Developments
Table 148. Foodlink Corporation Information
Table 149. Foodlink Description and Major Businesses
Table 150. Foodlink Snack Pellets Sales (K MT), Revenue (US$ Million), Price (USD/MT) and Gross Margin (2017-2022)
Table 151. Foodlink Snack Pellets Product Model Numbers, Pictures, Descriptions and Specifications
Table 152. Foodlink Recent Developments
Table 153. Le Caselle Corporation Information
Table 154. Le Caselle Description and Major Businesses
Table 155. Le Caselle Snack Pellets Sales (K MT), Revenue (US$ Million), Price (USD/MT) and Gross Margin (2017-2022)
Table 156. Le Caselle Snack Pellets Product Model Numbers, Pictures, Descriptions and Specifications
Table 157. Le Caselle Recent Developments
Table 158. Leng D’or Corporation Information
Table 159. Leng D’or Description and Major Businesses
Table 160. Leng D’or Snack Pellets Sales (K MT), Revenue (US$ Million), Price (USD/MT) and Gross Margin (2017-2022)
Table 161. Leng D’or Snack Pellets Product Model Numbers, Pictures, Descriptions and Specifications
Table 162. Leng D’or Recent Developments
Table 163. Key Raw Materials Lists
Table 164. Raw Materials Key Suppliers Lists
Table 165. Snack Pellets Distributors List
Table 166. Snack Pellets Customers List
Table 167. Snack Pellets Market Trends
Table 168. Snack Pellets Market Drivers
Table 169. Snack Pellets Market Challenges
Table 170. Snack Pellets Market Restraints
Table 171. Research Programs/Design for This Report
Table 172. Key Data Information from Secondary Sources
Table 173. Key Data Information from Primary Sources
List of Figures
Figure 1. Snack Pellets Product Picture
Figure 3. Global Snack Pellets Market Share by Type in 2021 & 2028
Figure 3. Potato Based Product Picture
Figure 4. Corn Based Product Picture
Figure 5. Rice Based Product Picture
Figure 6. Tapioca Based Product Picture
Figure 7. Multigrain Based Product Picture
Figure 8. Global Snack Pellets Market Share by Application in 2021 & 2028
Figure 9. Commercial
Figure 10. Household
Figure 11. Snack Pellets Report Years Considered
Figure 12. Global Snack Pellets Sales 2017-2028 (K MT)
Figure 13. Global Snack Pellets Revenue, (US$ Million), 2017 VS 2021 VS 2028
Figure 14. Global Snack Pellets Revenue 2017-2028 (US$ Million)
Figure 15. Global Snack Pellets Revenue Market Share by Region in Percentage: 2021 Versus 2028
Figure 16. Global Snack Pellets Sales Market Share by Region (2017-2022)
Figure 17. Global Snack Pellets Sales Market Share by Region (2023-2028)
Figure 18. North America Snack Pellets Sales YoY (2017-2028) & (K MT)
Figure 19. North America Snack Pellets Revenue YoY (2017-2028) & (US$ Million)
Figure 20. Europe Snack Pellets Sales YoY (2017-2028) & (K MT)
Figure 21. Europe Snack Pellets Revenue YoY (2017-2028) & (US$ Million)
Figure 22. Asia-Pacific Snack Pellets Sales YoY (2017-2028) & (K MT)
Figure 23. Asia-Pacific Snack Pellets Revenue YoY (2017-2028) & (US$ Million)
Figure 24. Latin America Snack Pellets Sales YoY (2017-2028) & (K MT)
Figure 25. Latin America Snack Pellets Revenue YoY (2017-2028) & (US$ Million)
Figure 26. Middle East & Africa Snack Pellets Sales YoY (2017-2028) & (K MT)
Figure 27. Middle East & Africa Snack Pellets Revenue YoY (2017-2028) & (US$ Million)
Figure 28. The Snack Pellets Market Share of Top 10 and Top 5 Largest Manufacturers Around the World in 2021
Figure 29. The Top 5 and 10 Largest Manufacturers of Snack Pellets in the World: Market Share by Snack Pellets Revenue in 2021
Figure 30. Global Snack Pellets Market Share by Company Type (Tier 1, Tier 2, and Tier 3): 2017 VS 2021
Figure 31. Global Snack Pellets Sales Market Share by Type (2017-2028)
Figure 32. Global Snack Pellets Revenue Market Share by Type (2017-2028)
Figure 33. Global Snack Pellets Sales Market Share by Application (2017-2028)
Figure 34. Global Snack Pellets Revenue Market Share by Application (2017-2028)
Figure 35. North America Snack Pellets Sales Market Share by Type (2017-2028)
Figure 36. North America Snack Pellets Revenue Market Share by Type (2017-2028)
Figure 37. North America Snack Pellets Sales Market Share by Application (2017-2028)
Figure 38. North America Snack Pellets Revenue Market Share by Application (2017-2028)
Figure 39. North America Snack Pellets Sales Share by Country (2017-2028)
Figure 40. North America Snack Pellets Revenue Share by Country (2017-2028)
Figure 41. U.S. Snack Pellets Revenue (2017-2028) & (US$ Million)
Figure 42. Canada Snack Pellets Revenue (2017-2028) & (US$ Million)
Figure 43. Europe Snack Pellets Sales Market Share by Type (2017-2028)
Figure 44. Europe Snack Pellets Revenue Market Share by Type (2017-2028)
Figure 45. Europe Snack Pellets Sales Market Share by Application (2017-2028)
Figure 46. Europe Snack Pellets Revenue Market Share by Application (2017-2028)
Figure 47. Europe Snack Pellets Sales Share by Country (2017-2028)
Figure 48. Europe Snack Pellets Revenue Share by Country (2017-2028)
Figure 49. Germany Snack Pellets Revenue (2017-2028) & (US$ Million)
Figure 50. France Snack Pellets Revenue (2017-2028) & (US$ Million)
Figure 51. U.K. Snack Pellets Revenue (2017-2028) & (US$ Million)
Figure 52. Italy Snack Pellets Revenue (2017-2028) & (US$ Million)
Figure 53. Russia Snack Pellets Revenue (2017-2028) & (US$ Million)
Figure 54. Asia Pacific Snack Pellets Sales Market Share by Type (2017-2028)
Figure 55. Asia Pacific Snack Pellets Revenue Market Share by Type (2017-2028)
Figure 56. Asia Pacific Snack Pellets Sales Market Share by Application (2017-2028)
Figure 57. Asia Pacific Snack Pellets Revenue Market Share by Application (2017-2028)
Figure 58. Asia Pacific Snack Pellets Sales Share by Region (2017-2028)
Figure 59. Asia Pacific Snack Pellets Revenue Share by Region (2017-2028)
Figure 60. China Snack Pellets Revenue (2017-2028) & (US$ Million)
Figure 61. Japan Snack Pellets Revenue (2017-2028) & (US$ Million)
Figure 62. South Korea Snack Pellets Revenue (2017-2028) & (US$ Million)
Figure 63. India Snack Pellets Revenue (2017-2028) & (US$ Million)
Figure 64. Australia Snack Pellets Revenue (2017-2028) & (US$ Million)
Figure 65. Taiwan Snack Pellets Revenue (2017-2028) & (US$ Million)
Figure 66. Indonesia Snack Pellets Revenue (2017-2028) & (US$ Million)
Figure 67. Thailand Snack Pellets Revenue (2017-2028) & (US$ Million)
Figure 68. Malaysia Snack Pellets Revenue (2017-2028) & (US$ Million)
Figure 69. Philippines Snack Pellets Revenue (2017-2028) & (US$ Million)
Figure 70. Latin America Snack Pellets Sales Market Share by Type (2017-2028)
Figure 71. Latin America Snack Pellets Revenue Market Share by Type (2017-2028)
Figure 72. Latin America Snack Pellets Sales Market Share by Application (2017-2028)
Figure 73. Latin America Snack Pellets Revenue Market Share by Application (2017-2028)
Figure 74. Latin America Snack Pellets Sales Share by Country (2017-2028)
Figure 75. Latin America Snack Pellets Revenue Share by Country (2017-2028)
Figure 76. Mexico Snack Pellets Revenue (2017-2028) & (US$ Million)
Figure 77. Brazil Snack Pellets Revenue (2017-2028) & (US$ Million)
Figure 78. Argentina Snack Pellets Revenue (2017-2028) & (US$ Million)
Figure 79. Middle East and Africa Snack Pellets Sales Market Share by Type (2017-2028)
Figure 80. Middle East and Africa Snack Pellets Revenue Market Share by Type (2017-2028)
Figure 81. Middle East and Africa Snack Pellets Sales Market Share by Application (2017-2028)
Figure 82. Middle East and Africa Snack Pellets Revenue Market Share by Application (2017-2028)
Figure 83. Middle East and Africa Snack Pellets Sales Share by Country (2017-2028)
Figure 84. Middle East and Africa Snack Pellets Revenue Share by Country (2017-2028)
Figure 85. Turkey Snack Pellets Revenue (2017-2028) & (US$ Million)
Figure 86. Saudi Arabia Snack Pellets Revenue (2017-2028) & (US$ Million)
Figure 87. U.A.E Snack Pellets Revenue (2017-2028) & (US$ Million)
Figure 88. Snack Pellets Value Chain
Figure 89. Snack Pellets Production Process
Figure 90. Channels of Distribution
Figure 91. Distributors Profiles
Figure 92. Bottom-up and Top-down Approaches for This Report
Figure 93. Data Triangulation
Figure 94. Key Executives Interviewed
$4900
$9800
HAVE A QUERY?
OUR CUSTOMER
