
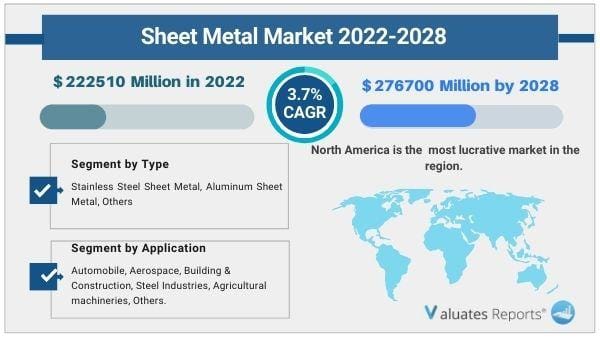
Due to the COVID-19 pandemic, the global Sheet Metal market size is estimated to be worth US$ 222510 million in 2022 and is forecast to a readjusted size of US$ 276700 million by 2028 with a CAGR of 3.7% during the review period. Fully considering the economic change by this health crisis, Stainless Steel Sheet Metal accounting for % of the Sheet Metal global market in 2021, is projected to value US$ million by 2028, growing at a revised % CAGR in the post-COVID-19 period.
While Automobile segment is altered to an % CAGR throughout this forecast period. Rapid economic expansion in developing nations, coupled with rising disposable income of people are the major factors driving the global automobile industry. Developed countries already have a large number of automobiles, while the developing countries are boosting the automotive sales due to evolving infrastructural facilities, rising living standards and economic growth. In terms of production side, this report researches the Sheet Metal capacity, production, growth rate, market share by manufacturers and by region (region level and country level), from 2017 to 2022, and forecast to 2028. In terms of sales side, this report focuses on the sales of Sheet Metal by region (region level and country level), by company, by Type and by Application. from 2017 to 2022 and forecast to 2028. Sheet metal is one of the fundamental forms of steel used in metalworking, which can be cut or bent into a variety of different shapes and sizes.
Sheet Metal market is segmented by Type and by Application. Players, stakeholders, and other participants in the global Sheet Metal market will be able to gain the upper hand as they use the report as a powerful resource. The segmental analysis focuses on production capacity, revenue and forecast by Type and by Application for the period 2017-2028.
|
Report Metric |
Details |
|
Report Name |
Sheet Metal Market |
|
The market size in 2022 |
USD 222510 Million |
|
The revenue forecast in 2028 |
USD 276700 Million |
|
Growth Rate |
Compound Annual Growth Rate (CAGR) of 3.7% from 2022 to 2028 |
|
Market size available for years |
2022-2028 |
|
Forecast units |
Value (USD) |
|
Segments covered |
By Type, Application, and Region |
|
Report coverage |
Revenue & volume forecast, company share, competitive landscape, growth factors, and trends |
|
Geographic regions covered |
North America, Europe, Asia Pacific, Latin America, Middle East & Africa |
Ans. The global Sheet Metal market size is estimated to be worth US$ 222510 million in 2022 and is forecast to a readjusted size of US$ 276700 million by 2028.
Ans. The global Sheet Metal market is expected to grow at a compound annual growth rate of 3.7% from 2022 to 2028.
Ans. Some of the major companies are General Sheet Metal Works, Bud Industries, BlueScope Steel, ATAS International, ABC Sheet Metal, Associated Materials, Autoline Industries, Prototek, Noble Industries, Wise Alloys, Alcoa, United States Steel, Nucor, NCI Building Systems, Pepco Manufacturing, Proto-D Engineering, Southwark Metal, Deepesh pressing, Fabrimech Engineers, Nimex International, Rajhans Pressings, Dhananjay Group, Aero Tech Manufacturing, Vinman Engineering.
Table of Contents
1 Study Coverage
1.1 Sheet Metal Product Introduction
1.2 Market by Type
1.2.1 Global Sheet Metal Market Size by Type, 2017 VS 2021 VS 2028
1.2.2 Ordinary Cold Rolled Sheet SPCC
1.2.3 Galvanized Steel Sheet SECC
1.2.4 Hot-dip Galvanized Steel Sheet SGCC
1.2.5 Stainless Steel
1.3 Market by Application
1.3.1 Global Sheet Metal Market Size by Application, 2017 VS 2021 VS 2028
1.3.2 Electromechanical
1.3.3 Light Industrial
1.3.4 Automotive
1.3.5 Others
1.4 Study Objectives
1.5 Years Considered
2 Global Sheet Metal Production
2.1 Global Sheet Metal Production Capacity (2017-2028)
2.2 Global Sheet Metal Production by Region: 2017 VS 2021 VS 2028
2.3 Global Sheet Metal Production by Region
2.3.1 Global Sheet Metal Historic Production by Region (2017-2022)
2.3.2 Global Sheet Metal Forecasted Production by Region (2023-2028)
2.4 North America
2.5 Europe
2.6 China
2.7 Japan
3 Global Sheet Metal Sales in Volume & Value Estimates and Forecasts
3.1 Global Sheet Metal Sales Estimates and Forecasts 2017-2028
3.2 Global Sheet Metal Revenue Estimates and Forecasts 2017-2028
3.3 Global Sheet Metal Revenue by Region: 2017 VS 2021 VS 2028
3.4 Global Sheet Metal Sales by Region
3.4.1 Global Sheet Metal Sales by Region (2017-2022)
3.4.2 Global Sales Sheet Metal by Region (2023-2028)
3.5 Global Sheet Metal Revenue by Region
3.5.1 Global Sheet Metal Revenue by Region (2017-2022)
3.5.2 Global Sheet Metal Revenue by Region (2023-2028)
3.6 North America
3.7 Europe
3.8 Asia-Pacific
3.9 Latin America
3.10 Middle East & Africa
4 Competition by Manufactures
4.1 Global Sheet Metal Production Capacity by Manufacturers
4.2 Global Sheet Metal Sales by Manufacturers
4.2.1 Global Sheet Metal Sales by Manufacturers (2017-2022)
4.2.2 Global Sheet Metal Sales Market Share by Manufacturers (2017-2022)
4.2.3 Global Top 10 and Top 5 Largest Manufacturers of Sheet Metal in 2021
4.3 Global Sheet Metal Revenue by Manufacturers
4.3.1 Global Sheet Metal Revenue by Manufacturers (2017-2022)
4.3.2 Global Sheet Metal Revenue Market Share by Manufacturers (2017-2022)
4.3.3 Global Top 10 and Top 5 Companies by Sheet Metal Revenue in 2021
4.4 Global Sheet Metal Sales Price by Manufacturers
4.5 Analysis of Competitive Landscape
4.5.1 Manufacturers Market Concentration Ratio (CR5 and HHI)
4.5.2 Global Sheet Metal Market Share by Company Type (Tier 1, Tier 2, and Tier 3)
4.5.3 Global Sheet Metal Manufacturers Geographical Distribution
4.6 Mergers & Acquisitions, Expansion Plans
5 Market Size by Type
5.1 Global Sheet Metal Sales by Type
5.1.1 Global Sheet Metal Historical Sales by Type (2017-2022)
5.1.2 Global Sheet Metal Forecasted Sales by Type (2023-2028)
5.1.3 Global Sheet Metal Sales Market Share by Type (2017-2028)
5.2 Global Sheet Metal Revenue by Type
5.2.1 Global Sheet Metal Historical Revenue by Type (2017-2022)
5.2.2 Global Sheet Metal Forecasted Revenue by Type (2023-2028)
5.2.3 Global Sheet Metal Revenue Market Share by Type (2017-2028)
5.3 Global Sheet Metal Price by Type
5.3.1 Global Sheet Metal Price by Type (2017-2022)
5.3.2 Global Sheet Metal Price Forecast by Type (2023-2028)
6 Market Size by Application
6.1 Global Sheet Metal Sales by Application
6.1.1 Global Sheet Metal Historical Sales by Application (2017-2022)
6.1.2 Global Sheet Metal Forecasted Sales by Application (2023-2028)
6.1.3 Global Sheet Metal Sales Market Share by Application (2017-2028)
6.2 Global Sheet Metal Revenue by Application
6.2.1 Global Sheet Metal Historical Revenue by Application (2017-2022)
6.2.2 Global Sheet Metal Forecasted Revenue by Application (2023-2028)
6.2.3 Global Sheet Metal Revenue Market Share by Application (2017-2028)
6.3 Global Sheet Metal Price by Application
6.3.1 Global Sheet Metal Price by Application (2017-2022)
6.3.2 Global Sheet Metal Price Forecast by Application (2023-2028)
7 North America
7.1 North America Sheet Metal Market Size by Type
7.1.1 North America Sheet Metal Sales by Type (2017-2028)
7.1.2 North America Sheet Metal Revenue by Type (2017-2028)
7.2 North America Sheet Metal Market Size by Application
7.2.1 North America Sheet Metal Sales by Application (2017-2028)
7.2.2 North America Sheet Metal Revenue by Application (2017-2028)
7.3 North America Sheet Metal Sales by Country
7.3.1 North America Sheet Metal Sales by Country (2017-2028)
7.3.2 North America Sheet Metal Revenue by Country (2017-2028)
7.3.3 United States
7.3.4 Canada
8 Europe
8.1 Europe Sheet Metal Market Size by Type
8.1.1 Europe Sheet Metal Sales by Type (2017-2028)
8.1.2 Europe Sheet Metal Revenue by Type (2017-2028)
8.2 Europe Sheet Metal Market Size by Application
8.2.1 Europe Sheet Metal Sales by Application (2017-2028)
8.2.2 Europe Sheet Metal Revenue by Application (2017-2028)
8.3 Europe Sheet Metal Sales by Country
8.3.1 Europe Sheet Metal Sales by Country (2017-2028)
8.3.2 Europe Sheet Metal Revenue by Country (2017-2028)
8.3.3 Germany
8.3.4 France
8.3.5 U.K.
8.3.6 Italy
8.3.7 Russia
9 Asia Pacific
9.1 Asia Pacific Sheet Metal Market Size by Type
9.1.1 Asia Pacific Sheet Metal Sales by Type (2017-2028)
9.1.2 Asia Pacific Sheet Metal Revenue by Type (2017-2028)
9.2 Asia Pacific Sheet Metal Market Size by Application
9.2.1 Asia Pacific Sheet Metal Sales by Application (2017-2028)
9.2.2 Asia Pacific Sheet Metal Revenue by Application (2017-2028)
9.3 Asia Pacific Sheet Metal Sales by Region
9.3.1 Asia Pacific Sheet Metal Sales by Region (2017-2028)
9.3.2 Asia Pacific Sheet Metal Revenue by Region (2017-2028)
9.3.3 China
9.3.4 Japan
9.3.5 South Korea
9.3.6 India
9.3.7 Australia
9.3.8 China Taiwan
9.3.9 Indonesia
9.3.10 Thailand
9.3.11 Malaysia
10 Latin America
10.1 Latin America Sheet Metal Market Size by Type
10.1.1 Latin America Sheet Metal Sales by Type (2017-2028)
10.1.2 Latin America Sheet Metal Revenue by Type (2017-2028)
10.2 Latin America Sheet Metal Market Size by Application
10.2.1 Latin America Sheet Metal Sales by Application (2017-2028)
10.2.2 Latin America Sheet Metal Revenue by Application (2017-2028)
10.3 Latin America Sheet Metal Sales by Country
10.3.1 Latin America Sheet Metal Sales by Country (2017-2028)
10.3.2 Latin America Sheet Metal Revenue by Country (2017-2028)
10.3.3 Mexico
10.3.4 Brazil
10.3.5 Argentina
11 Middle East and Africa
11.1 Middle East and Africa Sheet Metal Market Size by Type
11.1.1 Middle East and Africa Sheet Metal Sales by Type (2017-2028)
11.1.2 Middle East and Africa Sheet Metal Revenue by Type (2017-2028)
11.2 Middle East and Africa Sheet Metal Market Size by Application
11.2.1 Middle East and Africa Sheet Metal Sales by Application (2017-2028)
11.2.2 Middle East and Africa Sheet Metal Revenue by Application (2017-2028)
11.3 Middle East and Africa Sheet Metal Sales by Country
11.3.1 Middle East and Africa Sheet Metal Sales by Country (2017-2028)
11.3.2 Middle East and Africa Sheet Metal Revenue by Country (2017-2028)
11.3.3 Turkey
11.3.4 Saudi Arabia
11.3.5 UAE
12 Corporate Profiles
12.1 Mazak
12.1.1 Mazak Corporation Information
12.1.2 Mazak Overview
12.1.3 Mazak Sheet Metal Sales, Price, Revenue and Gross Margin (2017-2022)
12.1.4 Mazak Sheet Metal Product Model Numbers, Pictures, Descriptions and Specifications
12.1.5 Mazak Recent Developments
12.2 Trumpf
12.2.1 Trumpf Corporation Information
12.2.2 Trumpf Overview
12.2.3 Trumpf Sheet Metal Sales, Price, Revenue and Gross Margin (2017-2022)
12.2.4 Trumpf Sheet Metal Product Model Numbers, Pictures, Descriptions and Specifications
12.2.5 Trumpf Recent Developments
12.3 DMG MORI
12.3.1 DMG MORI Corporation Information
12.3.2 DMG MORI Overview
12.3.3 DMG MORI Sheet Metal Sales, Price, Revenue and Gross Margin (2017-2022)
12.3.4 DMG MORI Sheet Metal Product Model Numbers, Pictures, Descriptions and Specifications
12.3.5 DMG MORI Recent Developments
12.4 MAG
12.4.1 MAG Corporation Information
12.4.2 MAG Overview
12.4.3 MAG Sheet Metal Sales, Price, Revenue and Gross Margin (2017-2022)
12.4.4 MAG Sheet Metal Product Model Numbers, Pictures, Descriptions and Specifications
12.4.5 MAG Recent Developments
12.5 Amada
12.5.1 Amada Corporation Information
12.5.2 Amada Overview
12.5.3 Amada Sheet Metal Sales, Price, Revenue and Gross Margin (2017-2022)
12.5.4 Amada Sheet Metal Product Model Numbers, Pictures, Descriptions and Specifications
12.5.5 Amada Recent Developments
12.6 Okuma
12.6.1 Okuma Corporation Information
12.6.2 Okuma Overview
12.6.3 Okuma Sheet Metal Sales, Price, Revenue and Gross Margin (2017-2022)
12.6.4 Okuma Sheet Metal Product Model Numbers, Pictures, Descriptions and Specifications
12.6.5 Okuma Recent Developments
12.7 Makino
12.7.1 Makino Corporation Information
12.7.2 Makino Overview
12.7.3 Makino Sheet Metal Sales, Price, Revenue and Gross Margin (2017-2022)
12.7.4 Makino Sheet Metal Product Model Numbers, Pictures, Descriptions and Specifications
12.7.5 Makino Recent Developments
12.8 Grob
12.8.1 Grob Corporation Information
12.8.2 Grob Overview
12.8.3 Grob Sheet Metal Sales, Price, Revenue and Gross Margin (2017-2022)
12.8.4 Grob Sheet Metal Product Model Numbers, Pictures, Descriptions and Specifications
12.8.5 Grob Recent Developments
12.9 Haas
12.9.1 Haas Corporation Information
12.9.2 Haas Overview
12.9.3 Haas Sheet Metal Sales, Price, Revenue and Gross Margin (2017-2022)
12.9.4 Haas Sheet Metal Product Model Numbers, Pictures, Descriptions and Specifications
12.9.5 Haas Recent Developments
12.10 Emag
12.10.1 Emag Corporation Information
12.10.2 Emag Overview
12.10.3 Emag Sheet Metal Sales, Price, Revenue and Gross Margin (2017-2022)
12.10.4 Emag Sheet Metal Product Model Numbers, Pictures, Descriptions and Specifications
12.10.5 Emag Recent Developments
12.11 Murata Machinery
12.11.1 Murata Machinery Corporation Information
12.11.2 Murata Machinery Overview
12.11.3 Murata Machinery Sheet Metal Sales, Price, Revenue and Gross Margin (2017-2022)
12.11.4 Murata Machinery Sheet Metal Product Model Numbers, Pictures, Descriptions and Specifications
12.11.5 Murata Machinery Recent Developments
12.12 Xingyi Group
12.12.1 Xingyi Group Corporation Information
12.12.2 Xingyi Group Overview
12.12.3 Xingyi Group Sheet Metal Sales, Price, Revenue and Gross Margin (2017-2022)
12.12.4 Xingyi Group Sheet Metal Product Model Numbers, Pictures, Descriptions and Specifications
12.12.5 Xingyi Group Recent Developments
12.13 Chuangxing Jingmi
12.13.1 Chuangxing Jingmi Corporation Information
12.13.2 Chuangxing Jingmi Overview
12.13.3 Chuangxing Jingmi Sheet Metal Sales, Price, Revenue and Gross Margin (2017-2022)
12.13.4 Chuangxing Jingmi Sheet Metal Product Model Numbers, Pictures, Descriptions and Specifications
12.13.5 Chuangxing Jingmi Recent Developments
13 Industry Chain and Sales Channels Analysis
13.1 Sheet Metal Industry Chain Analysis
13.2 Sheet Metal Key Raw Materials
13.2.1 Key Raw Materials
13.2.2 Raw Materials Key Suppliers
13.3 Sheet Metal Production Mode & Process
13.4 Sheet Metal Sales and Marketing
13.4.1 Sheet Metal Sales Channels
13.4.2 Sheet Metal Distributors
13.5 Sheet Metal Customers
14 Market Drivers, Opportunities, Challenges and Risks Factors Analysis
14.1 Sheet Metal Industry Trends
14.2 Sheet Metal Market Drivers
14.3 Sheet Metal Market Challenges
14.4 Sheet Metal Market Restraints
15 Key Finding in The Global Sheet Metal Study
16 Appendix
16.1 Research Methodology
16.1.1 Methodology/Research Approach
16.1.2 Data Source
16.2 Author Details
16.3 Disclaimer
List of Tables
Table 1. Global Sheet Metal Market Size Growth Rate by Type, 2017 VS 2021 VS 2028 (US$ Million)
Table 2. Major Manufacturers of Ordinary Cold Rolled Sheet SPCC
Table 3. Major Manufacturers of Galvanized Steel Sheet SECC
Table 4. Major Manufacturers of Hot-dip Galvanized Steel Sheet SGCC
Table 5. Major Manufacturers of Stainless Steel
Table 6. Global Sheet Metal Market Size Growth Rate by Application, 2017 VS 2021 2028 (US$ Million)
Table 7. Global Sheet Metal Production by Region: 2017 VS 2021 VS 2028 (Tons)
Table 8. Global Sheet Metal Production by Region (2017-2022) & (Tons)
Table 9. Global Sheet Metal Production Market Share by Region (2017-2022)
Table 10. Global Sheet Metal Production by Region (2023-2028) & (Tons)
Table 11. Global Sheet Metal Production Market Share by Region (2023-2028)
Table 12. Global Sheet Metal Revenue by Region: 2017 VS 2021 VS 2028 (US$ Million)
Table 13. Global Sheet Metal Sales by Region (2017-2022) & (Tons)
Table 14. Global Sheet Metal Sales Market Share by Region (2017-2022)
Table 15. Global Sheet Metal Sales by Region (2023-2028) & (Tons)
Table 16. Global Sheet Metal Sales Market Share by Region (2023-2028)
Table 17. Global Sheet Metal Revenue by Region (2017-2022) & (US$ Million)
Table 18. Global Sheet Metal Revenue Market Share by Region (2017-2022)
Table 19. Global Sheet Metal Revenue by Region (2023-2028) & (US$ Million)
Table 20. Global Sheet Metal Revenue Market Share by Region (2023-2028)
Table 21. Global Sheet Metal Production Capacity by Manufacturers (2017-2022) & (Tons)
Table 22. Global Sheet Metal Capacity Market Share by Manufacturers (2017-2022)
Table 23. Global Sheet Metal Sales by Manufacturers (2017-2022) & (Tons)
Table 24. Global Sheet Metal Sales Market Share by Manufacturers (2017-2022)
Table 25. Global Sheet Metal Revenue by Manufacturers (2017-2022) & (US$ Million)
Table 26. Global Sheet Metal Revenue Share by Manufacturers (2017-2022)
Table 27. Sheet Metal Price by Manufacturers 2017-2022 (US$/Ton)
Table 28. Global Sheet Metal Manufacturers Market Concentration Ratio (CR5 and HHI)
Table 29. Global Sheet Metal by Company Type (Tier 1, Tier 2, and Tier 3) & (based on the Revenue in Sheet Metal as of 2021)
Table 30. Sheet Metal Manufacturing Base Distribution and Headquarters
Table 31. Manufacturers Sheet Metal Product Offered
Table 32. Date of Manufacturers Enter into Sheet Metal Market
Table 33. Mergers & Acquisitions, Expansion Plans
Table 34. Global Sheet Metal Sales by Type (2017-2022) & (Tons)
Table 35. Global Sheet Metal Sales by Type (2023-2028) & (Tons)
Table 36. Global Sheet Metal Sales Share by Type (2017-2022)
Table 37. Global Sheet Metal Sales Share by Type (2023-2028)
Table 38. Global Sheet Metal Revenue by Type (2017-2022) & (US$ Million)
Table 39. Global Sheet Metal Revenue by Type (2023-2028) & (US$ Million)
Table 40. Global Sheet Metal Revenue Share by Type (2017-2022)
Table 41. Global Sheet Metal Revenue Share by Type (2023-2028)
Table 42. Sheet Metal Price by Type (2017-2022) & (US$/Ton)
Table 43. Global Sheet Metal Price Forecast by Type (2023-2028) & (US$/Ton)
Table 44. Global Sheet Metal Sales by Application (2017-2022) & (Tons)
Table 45. Global Sheet Metal Sales by Application (2023-2028) & (Tons)
Table 46. Global Sheet Metal Sales Share by Application (2017-2022)
Table 47. Global Sheet Metal Sales Share by Application (2023-2028)
Table 48. Global Sheet Metal Revenue by Application (2017-2022) & (US$ Million)
Table 49. Global Sheet Metal Revenue by Application (2023-2028) & (US$ Million)
Table 50. Global Sheet Metal Revenue Share by Application (2017-2022)
Table 51. Global Sheet Metal Revenue Share by Application (2023-2028)
Table 52. Sheet Metal Price by Application (2017-2022) & (US$/Ton)
Table 53. Global Sheet Metal Price Forecast by Application (2023-2028) & (US$/Ton)
Table 54. North America Sheet Metal Sales by Type (2017-2022) & (Tons)
Table 55. North America Sheet Metal Sales by Type (2023-2028) & (Tons)
Table 56. North America Sheet Metal Revenue by Type (2017-2022) & (US$ Million)
Table 57. North America Sheet Metal Revenue by Type (2023-2028) & (US$ Million)
Table 58. North America Sheet Metal Sales by Application (2017-2022) & (Tons)
Table 59. North America Sheet Metal Sales by Application (2023-2028) & (Tons)
Table 60. North America Sheet Metal Revenue by Application (2017-2022) & (US$ Million)
Table 61. North America Sheet Metal Revenue by Application (2023-2028) & (US$ Million)
Table 62. North America Sheet Metal Sales by Country (2017-2022) & (Tons)
Table 63. North America Sheet Metal Sales by Country (2023-2028) & (Tons)
Table 64. North America Sheet Metal Revenue by Country (2017-2022) & (US$ Million)
Table 65. North America Sheet Metal Revenue by Country (2023-2028) & (US$ Million)
Table 66. Europe Sheet Metal Sales by Type (2017-2022) & (Tons)
Table 67. Europe Sheet Metal Sales by Type (2023-2028) & (Tons)
Table 68. Europe Sheet Metal Revenue by Type (2017-2022) & (US$ Million)
Table 69. Europe Sheet Metal Revenue by Type (2023-2028) & (US$ Million)
Table 70. Europe Sheet Metal Sales by Application (2017-2022) & (Tons)
Table 71. Europe Sheet Metal Sales by Application (2023-2028) & (Tons)
Table 72. Europe Sheet Metal Revenue by Application (2017-2022) & (US$ Million)
Table 73. Europe Sheet Metal Revenue by Application (2023-2028) & (US$ Million)
Table 74. Europe Sheet Metal Sales by Country (2017-2022) & (Tons)
Table 75. Europe Sheet Metal Sales by Country (2023-2028) & (Tons)
Table 76. Europe Sheet Metal Revenue by Country (2017-2022) & (US$ Million)
Table 77. Europe Sheet Metal Revenue by Country (2023-2028) & (US$ Million)
Table 78. Asia Pacific Sheet Metal Sales by Type (2017-2022) & (Tons)
Table 79. Asia Pacific Sheet Metal Sales by Type (2023-2028) & (Tons)
Table 80. Asia Pacific Sheet Metal Revenue by Type (2017-2022) & (US$ Million)
Table 81. Asia Pacific Sheet Metal Revenue by Type (2023-2028) & (US$ Million)
Table 82. Asia Pacific Sheet Metal Sales by Application (2017-2022) & (Tons)
Table 83. Asia Pacific Sheet Metal Sales by Application (2023-2028) & (Tons)
Table 84. Asia Pacific Sheet Metal Revenue by Application (2017-2022) & (US$ Million)
Table 85. Asia Pacific Sheet Metal Revenue by Application (2023-2028) & (US$ Million)
Table 86. Asia Pacific Sheet Metal Sales by Region (2017-2022) & (Tons)
Table 87. Asia Pacific Sheet Metal Sales by Region (2023-2028) & (Tons)
Table 88. Asia Pacific Sheet Metal Revenue by Region (2017-2022) & (US$ Million)
Table 89. Asia Pacific Sheet Metal Revenue by Region (2023-2028) & (US$ Million)
Table 90. Latin America Sheet Metal Sales by Type (2017-2022) & (Tons)
Table 91. Latin America Sheet Metal Sales by Type (2023-2028) & (Tons)
Table 92. Latin America Sheet Metal Revenue by Type (2017-2022) & (US$ Million)
Table 93. Latin America Sheet Metal Revenue by Type (2023-2028) & (US$ Million)
Table 94. Latin America Sheet Metal Sales by Application (2017-2022) & (Tons)
Table 95. Latin America Sheet Metal Sales by Application (2023-2028) & (Tons)
Table 96. Latin America Sheet Metal Revenue by Application (2017-2022) & (US$ Million)
Table 97. Latin America Sheet Metal Revenue by Application (2023-2028) & (US$ Million)
Table 98. Latin America Sheet Metal Sales by Country (2017-2022) & (Tons)
Table 99. Latin America Sheet Metal Sales by Country (2023-2028) & (Tons)
Table 100. Latin America Sheet Metal Revenue by Country (2017-2022) & (US$ Million)
Table 101. Latin America Sheet Metal Revenue by Country (2023-2028) & (US$ Million)
Table 102. Middle East and Africa Sheet Metal Sales by Type (2017-2022) & (Tons)
Table 103. Middle East and Africa Sheet Metal Sales by Type (2023-2028) & (Tons)
Table 104. Middle East and Africa Sheet Metal Revenue by Type (2017-2022) & (US$ Million)
Table 105. Middle East and Africa Sheet Metal Revenue by Type (2023-2028) & (US$ Million)
Table 106. Middle East and Africa Sheet Metal Sales by Application (2017-2022) & (Tons)
Table 107. Middle East and Africa Sheet Metal Sales by Application (2023-2028) & (Tons)
Table 108. Middle East and Africa Sheet Metal Revenue by Application (2017-2022) & (US$ Million)
Table 109. Middle East and Africa Sheet Metal Revenue by Application (2023-2028) & (US$ Million)
Table 110. Middle East and Africa Sheet Metal Sales by Country (2017-2022) & (Tons)
Table 111. Middle East and Africa Sheet Metal Sales by Country (2023-2028) & (Tons)
Table 112. Middle East and Africa Sheet Metal Revenue by Country (2017-2022) & (US$ Million)
Table 113. Middle East and Africa Sheet Metal Revenue by Country (2023-2028) & (US$ Million)
Table 114. Mazak Corporation Information
Table 115. Mazak Description and Major Businesses
Table 116. Mazak Sheet Metal Sales (Tons), Revenue (US$ Million), Price (US$/Ton) and Gross Margin (2017-2022)
Table 117. Mazak Sheet Metal Product Model Numbers, Pictures, Descriptions and Specifications
Table 118. Mazak Recent Development
Table 119. Trumpf Corporation Information
Table 120. Trumpf Description and Major Businesses
Table 121. Trumpf Sheet Metal Sales (Tons), Revenue (US$ Million), Price (US$/Ton) and Gross Margin (2017-2022)
Table 122. Trumpf Sheet Metal Product Model Numbers, Pictures, Descriptions and Specifications
Table 123. Trumpf Recent Development
Table 124. DMG MORI Corporation Information
Table 125. DMG MORI Description and Major Businesses
Table 126. DMG MORI Sheet Metal Sales (Tons), Revenue (US$ Million), Price (US$/Ton) and Gross Margin (2017-2022)
Table 127. DMG MORI Sheet Metal Product Model Numbers, Pictures, Descriptions and Specifications
Table 128. DMG MORI Recent Development
Table 129. MAG Corporation Information
Table 130. MAG Description and Major Businesses
Table 131. MAG Sheet Metal Sales (Tons), Revenue (US$ Million), Price (US$/Ton) and Gross Margin (2017-2022)
Table 132. MAG Sheet Metal Product Model Numbers, Pictures, Descriptions and Specifications
Table 133. MAG Recent Development
Table 134. Amada Corporation Information
Table 135. Amada Description and Major Businesses
Table 136. Amada Sheet Metal Sales (Tons), Revenue (US$ Million), Price (US$/Ton) and Gross Margin (2017-2022)
Table 137. Amada Sheet Metal Product Model Numbers, Pictures, Descriptions and Specifications
Table 138. Amada Recent Development
Table 139. Okuma Corporation Information
Table 140. Okuma Description and Major Businesses
Table 141. Okuma Sheet Metal Sales (Tons), Revenue (US$ Million), Price (US$/Ton) and Gross Margin (2017-2022)
Table 142. Okuma Sheet Metal Product Model Numbers, Pictures, Descriptions and Specifications
Table 143. Okuma Recent Development
Table 144. Makino Corporation Information
Table 145. Makino Description and Major Businesses
Table 146. Makino Sheet Metal Sales (Tons), Revenue (US$ Million), Price (US$/Ton) and Gross Margin (2017-2022)
Table 147. Makino Sheet Metal Product Model Numbers, Pictures, Descriptions and Specifications
Table 148. Makino Recent Development
Table 149. Grob Corporation Information
Table 150. Grob Description and Major Businesses
Table 151. Grob Sheet Metal Sales (Tons), Revenue (US$ Million), Price (US$/Ton) and Gross Margin (2017-2022)
Table 152. Grob Sheet Metal Product Model Numbers, Pictures, Descriptions and Specifications
Table 153. Grob Recent Development
Table 154. Haas Corporation Information
Table 155. Haas Description and Major Businesses
Table 156. Haas Sheet Metal Sales (Tons), Revenue (US$ Million), Price (US$/Ton) and Gross Margin (2017-2022)
Table 157. Haas Sheet Metal Product Model Numbers, Pictures, Descriptions and Specifications
Table 158. Haas Recent Development
Table 159. Emag Corporation Information
Table 160. Emag Description and Major Businesses
Table 161. Emag Sheet Metal Sales (Tons), Revenue (US$ Million), Price (US$/Ton) and Gross Margin (2017-2022)
Table 162. Emag Sheet Metal Product Model Numbers, Pictures, Descriptions and Specifications
Table 163. Emag Recent Development
Table 164. Murata Machinery Corporation Information
Table 165. Murata Machinery Description and Major Businesses
Table 166. Murata Machinery Sheet Metal Sales (Tons), Revenue (US$ Million), Price (US$/Ton) and Gross Margin (2017-2022)
Table 167. Murata Machinery Sheet Metal Product Model Numbers, Pictures, Descriptions and Specifications
Table 168. Murata Machinery Recent Development
Table 169. Xingyi Group Corporation Information
Table 170. Xingyi Group Description and Major Businesses
Table 171. Xingyi Group Sheet Metal Sales (Tons), Revenue (US$ Million), Price (US$/Ton) and Gross Margin (2017-2022)
Table 172. Xingyi Group Sheet Metal Product Model Numbers, Pictures, Descriptions and Specifications
Table 173. Xingyi Group Recent Development
Table 174. Chuangxing Jingmi Corporation Information
Table 175. Chuangxing Jingmi Description and Major Businesses
Table 176. Chuangxing Jingmi Sheet Metal Sales (Tons), Revenue (US$ Million), Price (US$/Ton) and Gross Margin (2017-2022)
Table 177. Chuangxing Jingmi Sheet Metal Product Model Numbers, Pictures, Descriptions and Specifications
Table 178. Chuangxing Jingmi Recent Development
Table 179. Key Raw Materials Lists
Table 180. Raw Materials Key Suppliers Lists
Table 181. Sheet Metal Distributors List
Table 182. Sheet Metal Customers List
Table 183. Sheet Metal Market Trends
Table 184. Sheet Metal Market Drivers
Table 185. Sheet Metal Market Challenges
Table 186. Sheet Metal Market Restraints
Table 187. Research Programs/Design for This Report
Table 188. Key Data Information from Secondary Sources
Table 189. Key Data Information from Primary Sources
List of Figures
Figure 1. Sheet Metal Product Picture
Figure 2. Global Sheet Metal Market Share by Type in 2021 & 2028
Figure 3. Ordinary Cold Rolled Sheet SPCC Product Picture
Figure 4. Galvanized Steel Sheet SECC Product Picture
Figure 5. Hot-dip Galvanized Steel Sheet SGCC Product Picture
Figure 6. Stainless Steel Product Picture
Figure 7. Global Sheet Metal Market Share by Application in 2021 & 2028
Figure 8. Electromechanical
Figure 9. Light Industrial
Figure 10. Automotive
Figure 11. Others
Figure 12. Sheet Metal Report Years Considered
Figure 13. Global Sheet Metal Capacity, Production and Utilization (2017-2028) & (Tons)
Figure 14. Global Sheet Metal Production Market Share by Region in Percentage: 2021 Versus 2028
Figure 15. Global Sheet Metal Production Market Share by Region (2017-2022)
Figure 16. Global Sheet Metal Production Market Share by Region (2023-2028)
Figure 17. Sheet Metal Production Growth Rate in North America (2017-2028) & (Tons)
Figure 18. Sheet Metal Production Growth Rate in Europe (2017-2028) & (Tons)
Figure 19. Sheet Metal Production Growth Rate in China (2017-2028) & (Tons)
Figure 20. Sheet Metal Production Growth Rate in Japan (2017-2028) & (Tons)
Figure 21. Global Sheet Metal Sales 2017-2028 (Tons)
Figure 22. Global Sheet Metal Revenue, (US$ Million), 2017 VS 2021 VS 2028
Figure 23. Global Sheet Metal Revenue 2017-2028 (US$ Million)
Figure 24. Global Sheet Metal Revenue Market Share by Region in Percentage: 2021 Versus 2028
Figure 25. Global Sheet Metal Sales Market Share by Region (2017-2022)
Figure 26. Global Sheet Metal Sales Market Share by Region (2023-2028)
Figure 27. North America Sheet Metal Sales YoY (2017-2028) & (Tons)
Figure 28. North America Sheet Metal Revenue YoY (2017-2028) & (US$ Million)
Figure 29. Europe Sheet Metal Sales YoY (2017-2028) & (Tons)
Figure 30. Europe Sheet Metal Revenue YoY (2017-2028) & (US$ Million)
Figure 31. Asia-Pacific Sheet Metal Sales YoY (2017-2028) & (Tons)
Figure 32. Asia-Pacific Sheet Metal Revenue YoY (2017-2028) & (US$ Million)
Figure 33. Latin America Sheet Metal Sales YoY (2017-2028) & (Tons)
Figure 34. Latin America Sheet Metal Revenue YoY (2017-2028) & (US$ Million)
Figure 35. Middle East & Africa Sheet Metal Sales YoY (2017-2028) & (Tons)
Figure 36. Middle East & Africa Sheet Metal Revenue YoY (2017-2028) & (US$ Million)
Figure 37. The Sheet Metal Market Share of Top 10 and Top 5 Largest Manufacturers Around the World in 2021
Figure 38. The Top 5 and 10 Largest Manufacturers of Sheet Metal in the World: Market Share by Sheet Metal Revenue in 2021
Figure 39. Sheet Metal Market Share by Company Type (Tier 1, Tier 2, and Tier 3): 2017 VS 2021
Figure 40. Global Sheet Metal Sales Market Share by Type (2017-2028)
Figure 41. Global Sheet Metal Revenue Market Share by Type (2017-2028)
Figure 42. Global Sheet Metal Sales Market Share by Application (2017-2028)
Figure 43. Global Sheet Metal Revenue Market Share by Application (2017-2028)
Figure 44. North America Sheet Metal Sales Market Share by Type (2017-2028)
Figure 45. North America Sheet Metal Revenue Market Share by Type (2017-2028)
Figure 46. North America Sheet Metal Sales Market Share by Application (2017-2028)
Figure 47. North America Sheet Metal Revenue Market Share by Application (2017-2028)
Figure 48. North America Sheet Metal Sales Share by Country (2017-2028)
Figure 49. North America Sheet Metal Revenue Share by Country (2017-2028)
Figure 50. United States Sheet Metal Revenue (2017-2028) & (US$ Million)
Figure 51. Canada Sheet Metal Revenue (2017-2028) & (US$ Million)
Figure 52. Europe Sheet Metal Sales Market Share by Type (2017-2028)
Figure 53. Europe Sheet Metal Revenue Market Share by Type (2017-2028)
Figure 54. Europe Sheet Metal Sales Market Share by Application (2017-2028)
Figure 55. Europe Sheet Metal Revenue Market Share by Application (2017-2028)
Figure 56. Europe Sheet Metal Sales Share by Country (2017-2028)
Figure 57. Europe Sheet Metal Revenue Share by Country (2017-2028)
Figure 58. Germany Sheet Metal Revenue (2017-2028) & (US$ Million)
Figure 59. France Sheet Metal Revenue (2017-2028) & (US$ Million)
Figure 60. U.K. Sheet Metal Revenue (2017-2028) & (US$ Million)
Figure 61. Italy Sheet Metal Revenue (2017-2028) & (US$ Million)
Figure 62. Russia Sheet Metal Revenue (2017-2028) & (US$ Million)
Figure 63. Asia Pacific Sheet Metal Sales Market Share by Type (2017-2028)
Figure 64. Asia Pacific Sheet Metal Revenue Market Share by Type (2017-2028)
Figure 65. Asia Pacific Sheet Metal Sales Market Share by Application (2017-2028)
Figure 66. Asia Pacific Sheet Metal Revenue Market Share by Application (2017-2028)
Figure 67. Asia Pacific Sheet Metal Sales Share by Region (2017-2028)
Figure 68. Asia Pacific Sheet Metal Revenue Share by Region (2017-2028)
Figure 69. China Sheet Metal Revenue (2017-2028) & (US$ Million)
Figure 70. Japan Sheet Metal Revenue (2017-2028) & (US$ Million)
Figure 71. South Korea Sheet Metal Revenue (2017-2028) & (US$ Million)
Figure 72. India Sheet Metal Revenue (2017-2028) & (US$ Million)
Figure 73. Australia Sheet Metal Revenue (2017-2028) & (US$ Million)
Figure 74. China Taiwan Sheet Metal Revenue (2017-2028) & (US$ Million)
Figure 75. Indonesia Sheet Metal Revenue (2017-2028) & (US$ Million)
Figure 76. Thailand Sheet Metal Revenue (2017-2028) & (US$ Million)
Figure 77. Malaysia Sheet Metal Revenue (2017-2028) & (US$ Million)
Figure 78. Latin America Sheet Metal Sales Market Share by Type (2017-2028)
Figure 79. Latin America Sheet Metal Revenue Market Share by Type (2017-2028)
Figure 80. Latin America Sheet Metal Sales Market Share by Application (2017-2028)
Figure 81. Latin America Sheet Metal Revenue Market Share by Application (2017-2028)
Figure 82. Latin America Sheet Metal Sales Share by Country (2017-2028)
Figure 83. Latin America Sheet Metal Revenue Share by Country (2017-2028)
Figure 84. Mexico Sheet Metal Revenue (2017-2028) & (US$ Million)
Figure 85. Brazil Sheet Metal Revenue (2017-2028) & (US$ Million)
Figure 86. Argentina Sheet Metal Revenue (2017-2028) & (US$ Million)
Figure 87. Middle East and Africa Sheet Metal Sales Market Share by Type (2017-2028)
Figure 88. Middle East and Africa Sheet Metal Revenue Market Share by Type (2017-2028)
Figure 89. Middle East and Africa Sheet Metal Sales Market Share by Application (2017-2028)
Figure 90. Middle East and Africa Sheet Metal Revenue Market Share by Application (2017-2028)
Figure 91. Middle East and Africa Sheet Metal Sales Share by Country (2017-2028)
Figure 92. Middle East and Africa Sheet Metal Revenue Share by Country (2017-2028)
Figure 93. Turkey Sheet Metal Revenue (2017-2028) & (US$ Million)
Figure 94. Saudi Arabia Sheet Metal Revenue (2017-2028) & (US$ Million)
Figure 95. UAE Sheet Metal Revenue (2017-2028) & (US$ Million)
Figure 96. Sheet Metal Value Chain
Figure 97. Sheet Metal Production Process
Figure 98. Channels of Distribution
Figure 99. Distributors Profiles
Figure 100. Bottom-up and Top-down Approaches for This Report
Figure 101. Data Triangulation
Figure 102. Key Executives Interviewed
$4900
$9800
HAVE A QUERY?
OUR CUSTOMER

SIMILAR REPORTS
Add to Cart
Add to Cart
Add to Cart
Add to Cart