
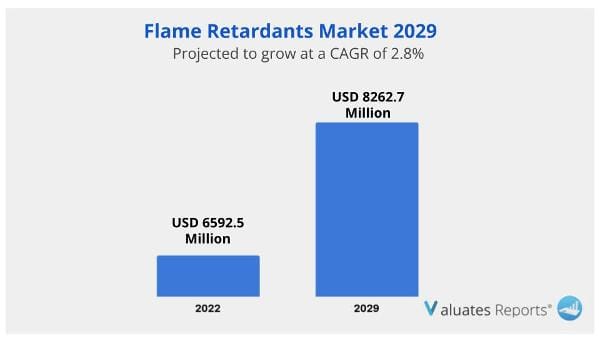
The global Flame Retardants market was valued at US$ 6592.5 million in 2022 and is anticipated to reach US$ 8262.7 million by 2029, witnessing a CAGR of 2.8% during the forecast period 2023-2029. The influence of COVID-19 and the Russia-Ukraine War were considered while estimating market sizes.
Key drivers of the flame retardants market include the growing awareness of consumer safety and use in everyday electronic items.
The demand for efficient transport systems and the rising automobile industry will fuel the growth of the flame retardants market during the forecast period.
The extensive use in the construction industry for fire-resistant materials will surge the growth prospects of the industry in the coming years.
Flame retardants are added to various consumer goods to prevent fire risks will further augment the growth of the market.
Electronics and electrical industry
Everyday electronics have become a necessity in today’s world. Digitization and penetration of the internet have spurred the use of consumer electronics. The plastic casings of electrical devices like TVs, smartphones, laptops, tablets, computers, and gaming systems are manufactured with flame retardants to reduce risks of ignition and spreading of fire thereby giving ample time for people to move out and emergency personnel to respond quickly. It is highly effective in preventing sparks, overheating, smoke, melting, or short circuits. These factors will drive the growth of the flame retardants market in the forthcoming years.
Transport and automotive sector
Electric vehicles and efficient transportation infrastructure are the need of the hour for combating climate change. Flame retardants are a viable solution for making lightweight, durable, and flexible cars that reduce fuel consumption. The high-energy electric components like batteries, cables, and connectors provide real fire threats. Retardants provide low flammability and less smoke production for safer evacuation. Such factors will boost the growth of the flame retardants market during the forecast period.
Construction industry
Fire-resistant buildings are important for saving the lives of occupants and providing efficient fire protection. Flame retardants are used in electrical wiring, cables, and in the insulation of walls, and ceilings. Structural elements like concrete, plaster, wood, and steel parts are coated with paints that contain flame retardants. All such measures are put into place to construct safe residential or office buildings. This is going to drive the growth of the flame retardants market in the subsequent years.
Manufacturing consumer goods
Recurring durable goods such as furniture, upholstery, mattresses, carpets, curtains, and fabrics are applied or added with flame retardants to decrease their chances of igniting and catching fire. These widespread applications will thereby propel the growth of the flame retardants market in the coming years.
Based on type, the ATH segment will provide lucrative opportunities for growth in the flame retardants market share due to its smoke suppressing and retardant features making it suitable for use in various end-user industries.
Based on application, the electrical and electronics segment is expected to maintain dominance in the flame retardants market share owing to huge applications in plastic casings of electronic products.
Based on region, Asia-Pacific is expected to witness significant growth in the flame retardants market share due to stringent regulations regarding fire safety and increasing use in several end-user industry verticals.
This section of the report provides key insights regarding various regions and the key players operating in each region. Economic, social, environmental, technological, and political factors have been taken into consideration while assessing the growth of the particular region/country. The readers will also get their hands on the revenue and production data of each region and country for the period 2016-2027. This information derived through comprehensive research will help the reader to get familiar with the potential value of the investment in a particular region. North America, Europe, China and Japan are the major regions studied in the research report.
In this section, the readers will gain an understanding of the key players competing. The experts have studied the key growth strategies, such as innovative trends and developments, intensification of product portfolio, mergers and acquisitions, collaborations, new product innovation, and geographical expansion, undertaken by these participants to maintain their presence. Apart from business strategies, the study includes current developments and key financials. The readers will also get access to the data related to global revenue, price, and production by manufacturers for the period 2016-2021. This all-inclusive report will certainly serve the clients to stay updated and make effective decisions in their businesses.
| Report Metric | Details |
| Report Name | Flame Retardants Market |
| The market size in 2022 | USD 6592.5 Million |
| The revenue forecast in 2029 | USD 8262.7 Million |
| Growth Rate | Compound Annual Growth Rate (CAGR) of 2.8% from 2023 to 2029 |
| Market size available for years | 2023-2029 |
| Forecast units | Value (USD) |
| Segments covered | Type, Application & Regions |
| Report coverage | Revenue & volume forecast, company share, competitive landscape, growth factors, and trends |
| Geographic regions covered | North America, Europe, Asia Pacific, Latin America, Middle East & Africa |
Ans. The global Flame Retardants market was valued at US$ 6592.5 million in 2022 and is anticipated to reach US$ 8262.7 million by 2029, witnessing a CAGR of 2.8% during the forecast period 2023-2029.
Ans. The global Flame Retardants market is expected to grow at a compound annual growth rate of 2.8% from 2023 to 2029.
Ans. he key global companies of Flame Retardants include Albemarle, ICL, Lanxess, Clariant, The Dow Chemical Company, Nabaltec AG, Lanxes AG, Italmatch and Huber Engineered Materials, etc.
1 Flame Retardants Market Overview
1.1 Product Definition
1.2 Flame Retardants Segment by Type
1.2.1 Global Flame Retardants Market Value Growth Rate Analysis by Type 2022 VS 2029
1.2.2 ATH
1.2.3 Antimony Oxide
1.2.4 Brominated
1.2.5 Chlorinated
1.2.6 Phosphorous
1.3 Flame Retardants Segment by Application
1.3.1 Global Flame Retardants Market Value Growth Rate Analysis by Application: 2022 VS 2029
1.3.2 Electrical & Electronics
1.3.3 Transportation
1.3.4 Construction
1.3.5 Consumer Goods
1.3.6 Automotive
1.4 Global Market Growth Prospects
1.4.1 Global Flame Retardants Production Value Estimates and Forecasts (2018-2029)
1.4.2 Global Flame Retardants Production Capacity Estimates and Forecasts (2018-2029)
1.4.3 Global Flame Retardants Production Estimates and Forecasts (2018-2029)
1.4.4 Global Flame Retardants Market Average Price Estimates and Forecasts (2018-2029)
1.5 Assumptions and Limitations
2 Market Competition by Manufacturers
2.1 Global Flame Retardants Production Market Share by Manufacturers (2018-2023)
2.2 Global Flame Retardants Production Value Market Share by Manufacturers (2018-2023)
2.3 Global Key Players of Flame Retardants, Industry Ranking, 2021 VS 2022 VS 2023
2.4 Global Flame Retardants Market Share by Company Type (Tier 1, Tier 2 and Tier 3)
2.5 Global Flame Retardants Average Price by Manufacturers (2018-2023)
2.6 Global Key Manufacturers of Flame Retardants, Manufacturing Base Distribution and Headquarters
2.7 Global Key Manufacturers of Flame Retardants, Product Offered and Application
2.8 Global Key Manufacturers of Flame Retardants, Date of Enter into This Industry
2.9 Flame Retardants Market Competitive Situation and Trends
2.9.1 Flame Retardants Market Concentration Rate
2.9.2 Global 5 and 10 Largest Flame Retardants Players Market Share by Revenue
2.10 Mergers & Acquisitions, Expansion
3 Flame Retardants Production by Region
3.1 Global Flame Retardants Production Value Estimates and Forecasts by Region: 2018 VS 2022 VS 2029
3.2 Global Flame Retardants Production Value by Region (2018-2029)
3.2.1 Global Flame Retardants Production Value Market Share by Region (2018-2023)
3.2.2 Global Forecasted Production Value of Flame Retardants by Region (2024-2029)
3.3 Global Flame Retardants Production Estimates and Forecasts by Region: 2018 VS 2022 VS 2029
3.4 Global Flame Retardants Production by Region (2018-2029)
3.4.1 Global Flame Retardants Production Market Share by Region (2018-2023)
3.4.2 Global Forecasted Production of Flame Retardants by Region (2024-2029)
3.5 Global Flame Retardants Market Price Analysis by Region (2018-2023)
3.6 Global Flame Retardants Production and Value, Year-over-Year Growth
3.6.1 North America Flame Retardants Production Value Estimates and Forecasts (2018-2029)
3.6.2 Europe Flame Retardants Production Value Estimates and Forecasts (2018-2029)
3.6.3 China Flame Retardants Production Value Estimates and Forecasts (2018-2029)
3.6.4 Japan Flame Retardants Production Value Estimates and Forecasts (2018-2029)
4 Flame Retardants Consumption by Region
4.1 Global Flame Retardants Consumption Estimates and Forecasts by Region: 2018 VS 2022 VS 2029
4.2 Global Flame Retardants Consumption by Region (2018-2029)
4.2.1 Global Flame Retardants Consumption by Region (2018-2023)
4.2.2 Global Flame Retardants Forecasted Consumption by Region (2024-2029)
4.3 North America
4.3.1 North America Flame Retardants Consumption Growth Rate by Country: 2018 VS 2022 VS 2029
4.3.2 North America Flame Retardants Consumption by Country (2018-2029)
4.3.3 U.S.
4.3.4 Canada
4.4 Europe
4.4.1 Europe Flame Retardants Consumption Growth Rate by Country: 2018 VS 2022 VS 2029
4.4.2 Europe Flame Retardants Consumption by Country (2018-2029)
4.4.3 Germany
4.4.4 France
4.4.5 U.K.
4.4.6 Italy
4.4.7 Russia
4.5 Asia Pacific
4.5.1 Asia Pacific Flame Retardants Consumption Growth Rate by Region: 2018 VS 2022 VS 2029
4.5.2 Asia Pacific Flame Retardants Consumption by Region (2018-2029)
4.5.3 China
4.5.4 Japan
4.5.5 South Korea
4.5.6 China Taiwan
4.5.7 Southeast Asia
4.5.8 India
4.6 Latin America, Middle East & Africa
4.6.1 Latin America, Middle East & Africa Flame Retardants Consumption Growth Rate by Country: 2018 VS 2022 VS 2029
4.6.2 Latin America, Middle East & Africa Flame Retardants Consumption by Country (2018-2029)
4.6.3 Mexico
4.6.4 Brazil
4.6.5 Turkey
5 Segment by Type
5.1 Global Flame Retardants Production by Type (2018-2029)
5.1.1 Global Flame Retardants Production by Type (2018-2023)
5.1.2 Global Flame Retardants Production by Type (2024-2029)
5.1.3 Global Flame Retardants Production Market Share by Type (2018-2029)
5.2 Global Flame Retardants Production Value by Type (2018-2029)
5.2.1 Global Flame Retardants Production Value by Type (2018-2023)
5.2.2 Global Flame Retardants Production Value by Type (2024-2029)
5.2.3 Global Flame Retardants Production Value Market Share by Type (2018-2029)
5.3 Global Flame Retardants Price by Type (2018-2029)
6 Segment by Application
6.1 Global Flame Retardants Production by Application (2018-2029)
6.1.1 Global Flame Retardants Production by Application (2018-2023)
6.1.2 Global Flame Retardants Production by Application (2024-2029)
6.1.3 Global Flame Retardants Production Market Share by Application (2018-2029)
6.2 Global Flame Retardants Production Value by Application (2018-2029)
6.2.1 Global Flame Retardants Production Value by Application (2018-2023)
6.2.2 Global Flame Retardants Production Value by Application (2024-2029)
6.2.3 Global Flame Retardants Production Value Market Share by Application (2018-2029)
6.3 Global Flame Retardants Price by Application (2018-2029)
7 Key Companies Profiled
7.1 Albemarle
7.1.1 Albemarle Flame Retardants Corporation Information
7.1.2 Albemarle Flame Retardants Product Portfolio
7.1.3 Albemarle Flame Retardants Production, Value, Price and Gross Margin (2018-2023)
7.1.4 Albemarle Main Business and Markets Served
7.1.5 Albemarle Recent Developments/Updates
7.2 ICL
7.2.1 ICL Flame Retardants Corporation Information
7.2.2 ICL Flame Retardants Product Portfolio
7.2.3 ICL Flame Retardants Production, Value, Price and Gross Margin (2018-2023)
7.2.4 ICL Main Business and Markets Served
7.2.5 ICL Recent Developments/Updates
7.3 Lanxess
7.3.1 Lanxess Flame Retardants Corporation Information
7.3.2 Lanxess Flame Retardants Product Portfolio
7.3.3 Lanxess Flame Retardants Production, Value, Price and Gross Margin (2018-2023)
7.3.4 Lanxess Main Business and Markets Served
7.3.5 Lanxess Recent Developments/Updates
7.4 Clariant
7.4.1 Clariant Flame Retardants Corporation Information
7.4.2 Clariant Flame Retardants Product Portfolio
7.4.3 Clariant Flame Retardants Production, Value, Price and Gross Margin (2018-2023)
7.4.4 Clariant Main Business and Markets Served
7.4.5 Clariant Recent Developments/Updates
7.5 The Dow Chemical Company
7.5.1 The Dow Chemical Company Flame Retardants Corporation Information
7.5.2 The Dow Chemical Company Flame Retardants Product Portfolio
7.5.3 The Dow Chemical Company Flame Retardants Production, Value, Price and Gross Margin (2018-2023)
7.5.4 The Dow Chemical Company Main Business and Markets Served
7.5.5 The Dow Chemical Company Recent Developments/Updates
7.6 Nabaltec AG
7.6.1 Nabaltec AG Flame Retardants Corporation Information
7.6.2 Nabaltec AG Flame Retardants Product Portfolio
7.6.3 Nabaltec AG Flame Retardants Production, Value, Price and Gross Margin (2018-2023)
7.6.4 Nabaltec AG Main Business and Markets Served
7.6.5 Nabaltec AG Recent Developments/Updates
7.7 Lanxes AG
7.7.1 Lanxes AG Flame Retardants Corporation Information
7.7.2 Lanxes AG Flame Retardants Product Portfolio
7.7.3 Lanxes AG Flame Retardants Production, Value, Price and Gross Margin (2018-2023)
7.7.4 Lanxes AG Main Business and Markets Served
7.7.5 Lanxes AG Recent Developments/Updates
7.8 Italmatch
7.8.1 Italmatch Flame Retardants Corporation Information
7.8.2 Italmatch Flame Retardants Product Portfolio
7.8.3 Italmatch Flame Retardants Production, Value, Price and Gross Margin (2018-2023)
7.8.4 Italmatch Main Business and Markets Served
7.7.5 Italmatch Recent Developments/Updates
7.9 Huber Engineered Materials
7.9.1 Huber Engineered Materials Flame Retardants Corporation Information
7.9.2 Huber Engineered Materials Flame Retardants Product Portfolio
7.9.3 Huber Engineered Materials Flame Retardants Production, Value, Price and Gross Margin (2018-2023)
7.9.4 Huber Engineered Materials Main Business and Markets Served
7.9.5 Huber Engineered Materials Recent Developments/Updates
7.10 Akzo Nobel
7.10.1 Akzo Nobel Flame Retardants Corporation Information
7.10.2 Akzo Nobel Flame Retardants Product Portfolio
7.10.3 Akzo Nobel Flame Retardants Production, Value, Price and Gross Margin (2018-2023)
7.10.4 Akzo Nobel Main Business and Markets Served
7.10.5 Akzo Nobel Recent Developments/Updates
8 Industry Chain and Sales Channels Analysis
8.1 Flame Retardants Industry Chain Analysis
8.2 Flame Retardants Key Raw Materials
8.2.1 Key Raw Materials
8.2.2 Raw Materials Key Suppliers
8.3 Flame Retardants Production Mode & Process
8.4 Flame Retardants Sales and Marketing
8.4.1 Flame Retardants Sales Channels
8.4.2 Flame Retardants Distributors
8.5 Flame Retardants Customers
9 Flame Retardants Market Dynamics
9.1 Flame Retardants Industry Trends
9.2 Flame Retardants Market Drivers
9.3 Flame Retardants Market Challenges
9.4 Flame Retardants Market Restraints
10 Research Finding and Conclusion
11 Methodology and Data Source
11.1 Methodology/Research Approach
11.1.1 Research Programs/Design
11.1.2 Market Size Estimation
11.1.3 Market Breakdown and Data Triangulation
11.2 Data Source
11.2.1 Secondary Sources
11.2.2 Primary Sources
11.3 Author List
11.4 Disclaimer
List of Tables
Table 1. Global Flame Retardants Market Value by Type, (US$ Million) & (2022 VS 2029)
Table 2. Global Flame Retardants Market Value by Application, (US$ Million) & (2022 VS 2029)
Table 3. Global Flame Retardants Production Capacity (K MT) by Manufacturers in 2022
Table 4. Global Flame Retardants Production by Manufacturers (2018-2023) & (K MT)
Table 5. Global Flame Retardants Production Market Share by Manufacturers (2018-2023)
Table 6. Global Flame Retardants Production Value by Manufacturers (2018-2023) & (US$ Million)
Table 7. Global Flame Retardants Production Value Share by Manufacturers (2018-2023)
Table 8. Global Flame Retardants Industry Ranking 2021 VS 2022 VS 2023
Table 9. Company Type (Tier 1, Tier 2 and Tier 3) & (based on the Revenue in Flame Retardants as of 2022)
Table 10. Global Market Flame Retardants Average Price by Manufacturers (USD/MT) & (2018-2023)
Table 11. Manufacturers Flame Retardants Production Sites and Area Served
Table 12. Manufacturers Flame Retardants Product Types
Table 13. Global Flame Retardants Manufacturers Market Concentration Ratio (CR5 and HHI)
Table 14. Mergers & Acquisitions, Expansion
Table 15. Global Flame Retardants Production Value by Region: 2018 VS 2022 VS 2029 (US$ Million)
Table 16. Global Flame Retardants Production Value (US$ Million) by Region (2018-2023)
Table 17. Global Flame Retardants Production Value Market Share by Region (2018-2023)
Table 18. Global Flame Retardants Production Value (US$ Million) Forecast by Region (2024-2029)
Table 19. Global Flame Retardants Production Value Market Share Forecast by Region (2024-2029)
Table 20. Global Flame Retardants Production Comparison by Region: 2018 VS 2022 VS 2029 (K MT)
Table 21. Global Flame Retardants Production (K MT) by Region (2018-2023)
Table 22. Global Flame Retardants Production Market Share by Region (2018-2023)
Table 23. Global Flame Retardants Production (K MT) Forecast by Region (2024-2029)
Table 24. Global Flame Retardants Production Market Share Forecast by Region (2024-2029)
Table 25. Global Flame Retardants Market Average Price (USD/MT) by Region (2018-2023)
Table 26. Global Flame Retardants Market Average Price (USD/MT) by Region (2024-2029)
Table 27. Global Flame Retardants Consumption Growth Rate by Region: 2018 VS 2022 VS 2029 (K MT)
Table 28. Global Flame Retardants Consumption by Region (2018-2023) & (K MT)
Table 29. Global Flame Retardants Consumption Market Share by Region (2018-2023)
Table 30. Global Flame Retardants Forecasted Consumption by Region (2024-2029) & (K MT)
Table 31. Global Flame Retardants Forecasted Consumption Market Share by Region (2018-2023)
Table 32. North America Flame Retardants Consumption Growth Rate by Country: 2018 VS 2022 VS 2029 (K MT)
Table 33. North America Flame Retardants Consumption by Country (2018-2023) & (K MT)
Table 34. North America Flame Retardants Consumption by Country (2024-2029) & (K MT)
Table 35. Europe Flame Retardants Consumption Growth Rate by Country: 2018 VS 2022 VS 2029 (K MT)
Table 36. Europe Flame Retardants Consumption by Country (2018-2023) & (K MT)
Table 37. Europe Flame Retardants Consumption by Country (2024-2029) & (K MT)
Table 38. Asia Pacific Flame Retardants Consumption Growth Rate by Region: 2018 VS 2022 VS 2029 (K MT)
Table 39. Asia Pacific Flame Retardants Consumption by Region (2018-2023) & (K MT)
Table 40. Asia Pacific Flame Retardants Consumption by Region (2024-2029) & (K MT)
Table 41. Latin America, Middle East & Africa Flame Retardants Consumption Growth Rate by Country: 2018 VS 2022 VS 2029 (K MT)
Table 42. Latin America, Middle East & Africa Flame Retardants Consumption by Country (2018-2023) & (K MT)
Table 43. Latin America, Middle East & Africa Flame Retardants Consumption by Country (2024-2029) & (K MT)
Table 44. Global Flame Retardants Production (K MT) by Type (2018-2023)
Table 45. Global Flame Retardants Production (K MT) by Type (2024-2029)
Table 46. Global Flame Retardants Production Market Share by Type (2018-2023)
Table 47. Global Flame Retardants Production Market Share by Type (2024-2029)
Table 48. Global Flame Retardants Production Value (US$ Million) by Type (2018-2023)
Table 49. Global Flame Retardants Production Value (US$ Million) by Type (2024-2029)
Table 50. Global Flame Retardants Production Value Share by Type (2018-2023)
Table 51. Global Flame Retardants Production Value Share by Type (2024-2029)
Table 52. Global Flame Retardants Price (USD/MT) by Type (2018-2023)
Table 53. Global Flame Retardants Price (USD/MT) by Type (2024-2029)
Table 54. Global Flame Retardants Production (K MT) by Application (2018-2023)
Table 55. Global Flame Retardants Production (K MT) by Application (2024-2029)
Table 56. Global Flame Retardants Production Market Share by Application (2018-2023)
Table 57. Global Flame Retardants Production Market Share by Application (2024-2029)
Table 58. Global Flame Retardants Production Value (US$ Million) by Application (2018-2023)
Table 59. Global Flame Retardants Production Value (US$ Million) by Application (2024-2029)
Table 60. Global Flame Retardants Production Value Share by Application (2018-2023)
Table 61. Global Flame Retardants Production Value Share by Application (2024-2029)
Table 62. Global Flame Retardants Price (USD/MT) by Application (2018-2023)
Table 63. Global Flame Retardants Price (USD/MT) by Application (2024-2029)
Table 64. Albemarle Flame Retardants Corporation Information
Table 65. Albemarle Specification and Application
Table 66. Albemarle Flame Retardants Production (K MT), Value (US$ Million), Price (USD/MT) and Gross Margin (2018-2023)
Table 67. Albemarle Main Business and Markets Served
Table 68. Albemarle Recent Developments/Updates
Table 69. ICL Flame Retardants Corporation Information
Table 70. ICL Specification and Application
Table 71. ICL Flame Retardants Production (K MT), Value (US$ Million), Price (USD/MT) and Gross Margin (2018-2023)
Table 72. ICL Main Business and Markets Served
Table 73. ICL Recent Developments/Updates
Table 74. Lanxess Flame Retardants Corporation Information
Table 75. Lanxess Specification and Application
Table 76. Lanxess Flame Retardants Production (K MT), Value (US$ Million), Price (USD/MT) and Gross Margin (2018-2023)
Table 77. Lanxess Main Business and Markets Served
Table 78. Lanxess Recent Developments/Updates
Table 79. Clariant Flame Retardants Corporation Information
Table 80. Clariant Specification and Application
Table 81. Clariant Flame Retardants Production (K MT), Value (US$ Million), Price (USD/MT) and Gross Margin (2018-2023)
Table 82. Clariant Main Business and Markets Served
Table 83. Clariant Recent Developments/Updates
Table 84. The Dow Chemical Company Flame Retardants Corporation Information
Table 85. The Dow Chemical Company Specification and Application
Table 86. The Dow Chemical Company Flame Retardants Production (K MT), Value (US$ Million), Price (USD/MT) and Gross Margin (2018-2023)
Table 87. The Dow Chemical Company Main Business and Markets Served
Table 88. The Dow Chemical Company Recent Developments/Updates
Table 89. Nabaltec AG Flame Retardants Corporation Information
Table 90. Nabaltec AG Specification and Application
Table 91. Nabaltec AG Flame Retardants Production (K MT), Value (US$ Million), Price (USD/MT) and Gross Margin (2018-2023)
Table 92. Nabaltec AG Main Business and Markets Served
Table 93. Nabaltec AG Recent Developments/Updates
Table 94. Lanxes AG Flame Retardants Corporation Information
Table 95. Lanxes AG Specification and Application
Table 96. Lanxes AG Flame Retardants Production (K MT), Value (US$ Million), Price (USD/MT) and Gross Margin (2018-2023)
Table 97. Lanxes AG Main Business and Markets Served
Table 98. Lanxes AG Recent Developments/Updates
Table 99. Italmatch Flame Retardants Corporation Information
Table 100. Italmatch Specification and Application
Table 101. Italmatch Flame Retardants Production (K MT), Value (US$ Million), Price (USD/MT) and Gross Margin (2018-2023)
Table 102. Italmatch Main Business and Markets Served
Table 103. Italmatch Recent Developments/Updates
Table 104. Huber Engineered Materials Flame Retardants Corporation Information
Table 105. Huber Engineered Materials Specification and Application
Table 106. Huber Engineered Materials Flame Retardants Production (K MT), Value (US$ Million), Price (USD/MT) and Gross Margin (2018-2023)
Table 107. Huber Engineered Materials Main Business and Markets Served
Table 108. Huber Engineered Materials Recent Developments/Updates
Table 109. Akzo Nobel Flame Retardants Corporation Information
Table 110. Akzo Nobel Specification and Application
Table 111. Akzo Nobel Flame Retardants Production (K MT), Value (US$ Million), Price (USD/MT) and Gross Margin (2018-2023)
Table 112. Akzo Nobel Main Business and Markets Served
Table 113. Akzo Nobel Recent Developments/Updates
Table 114. Key Raw Materials Lists
Table 115. Raw Materials Key Suppliers Lists
Table 116. Flame Retardants Distributors List
Table 117. Flame Retardants Customers List
Table 118. Flame Retardants Market Trends
Table 119. Flame Retardants Market Drivers
Table 120. Flame Retardants Market Challenges
Table 121. Flame Retardants Market Restraints
Table 122. Research Programs/Design for This Report
Table 123. Key Data Information from Secondary Sources
Table 124. Key Data Information from Primary Sources
List of Figures
Figure 1. Product Picture of Flame Retardants
Figure 2. Global Flame Retardants Market Value by Type, (US$ Million) & (2022 VS 2029)
Figure 3. Global Flame Retardants Market Share by Type: 2022 VS 2029
Figure 4. ATH Product Picture
Figure 5. Antimony Oxide Product Picture
Figure 6. Brominated Product Picture
Figure 7. Chlorinated Product Picture
Figure 8. Phosphorous Product Picture
Figure 9. Global Flame Retardants Market Value by Application, (US$ Million) & (2022 VS 2029)
Figure 10. Global Flame Retardants Market Share by Application: 2022 VS 2029
Figure 11. Electrical & Electronics
Figure 12. Transportation
Figure 13. Construction
Figure 14. Consumer Goods
Figure 15. Automotive
Figure 16. Global Flame Retardants Production Value (US$ Million), 2018 VS 2022 VS 2029
Figure 17. Global Flame Retardants Production Value (US$ Million) & (2018-2029)
Figure 18. Global Flame Retardants Production Capacity (K MT) & (2018-2029)
Figure 19. Global Flame Retardants Production (K MT) & (2018-2029)
Figure 20. Global Flame Retardants Average Price (USD/MT) & (2018-2029)
Figure 21. Flame Retardants Report Years Considered
Figure 22. Flame Retardants Production Share by Manufacturers in 2022
Figure 23. Flame Retardants Market Share by Company Type (Tier 1, Tier 2, and Tier 3): 2018 VS 2022
Figure 24. The Global 5 and 10 Largest Players: Market Share by Flame Retardants Revenue in 2022
Figure 25. Global Flame Retardants Production Value by Region: 2018 VS 2022 VS 2029 (US$ Million)
Figure 26. Global Flame Retardants Production Value Market Share by Region: 2018 VS 2022 VS 2029
Figure 27. Global Flame Retardants Production Comparison by Region: 2018 VS 2022 VS 2029 (K MT)
Figure 28. Global Flame Retardants Production Market Share by Region: 2018 VS 2022 VS 2029
Figure 29. North America Flame Retardants Production Value (US$ Million) Growth Rate (2018-2029)
Figure 30. Europe Flame Retardants Production Value (US$ Million) Growth Rate (2018-2029)
Figure 31. China Flame Retardants Production Value (US$ Million) Growth Rate (2018-2029)
Figure 32. Japan Flame Retardants Production Value (US$ Million) Growth Rate (2018-2029)
Figure 33. Global Flame Retardants Consumption by Region: 2018 VS 2022 VS 2029 (K MT)
Figure 34. Global Flame Retardants Consumption Market Share by Region: 2018 VS 2022 VS 2029
Figure 35. North America Flame Retardants Consumption and Growth Rate (2018-2023) & (K MT)
Figure 36. North America Flame Retardants Consumption Market Share by Country (2018-2029)
Figure 37. Canada Flame Retardants Consumption and Growth Rate (2018-2023) & (K MT)
Figure 38. U.S. Flame Retardants Consumption and Growth Rate (2018-2023) & (K MT)
Figure 39. Europe Flame Retardants Consumption and Growth Rate (2018-2023) & (K MT)
Figure 40. Europe Flame Retardants Consumption Market Share by Country (2018-2029)
Figure 41. Germany Flame Retardants Consumption and Growth Rate (2018-2023) & (K MT)
Figure 42. France Flame Retardants Consumption and Growth Rate (2018-2023) & (K MT)
Figure 43. U.K. Flame Retardants Consumption and Growth Rate (2018-2023) & (K MT)
Figure 44. Italy Flame Retardants Consumption and Growth Rate (2018-2023) & (K MT)
Figure 45. Russia Flame Retardants Consumption and Growth Rate (2018-2023) & (K MT)
Figure 46. Asia Pacific Flame Retardants Consumption and Growth Rate (2018-2023) & (K MT)
Figure 47. Asia Pacific Flame Retardants Consumption Market Share by Regions (2018-2029)
Figure 48. China Flame Retardants Consumption and Growth Rate (2018-2023) & (K MT)
Figure 49. Japan Flame Retardants Consumption and Growth Rate (2018-2023) & (K MT)
Figure 50. South Korea Flame Retardants Consumption and Growth Rate (2018-2023) & (K MT)
Figure 51. China Taiwan Flame Retardants Consumption and Growth Rate (2018-2023) & (K MT)
Figure 52. Southeast Asia Flame Retardants Consumption and Growth Rate (2018-2023) & (K MT)
Figure 53. India Flame Retardants Consumption and Growth Rate (2018-2023) & (K MT)
Figure 54. Latin America, Middle East & Africa Flame Retardants Consumption and Growth Rate (2018-2023) & (K MT)
Figure 55. Latin America, Middle East & Africa Flame Retardants Consumption Market Share by Country (2018-2029)
Figure 56. Mexico Flame Retardants Consumption and Growth Rate (2018-2023) & (K MT)
Figure 57. Brazil Flame Retardants Consumption and Growth Rate (2018-2023) & (K MT)
Figure 58. Turkey Flame Retardants Consumption and Growth Rate (2018-2023) & (K MT)
Figure 59. GCC Countries Flame Retardants Consumption and Growth Rate (2018-2023) & (K MT)
Figure 60. Global Production Market Share of Flame Retardants by Type (2018-2029)
Figure 61. Global Production Value Market Share of Flame Retardants by Type (2018-2029)
Figure 62. Global Flame Retardants Price (USD/MT) by Type (2018-2029)
Figure 63. Global Production Market Share of Flame Retardants by Application (2018-2029)
Figure 64. Global Production Value Market Share of Flame Retardants by Application (2018-2029)
Figure 65. Global Flame Retardants Price (USD/MT) by Application (2018-2029)
Figure 66. Flame Retardants Value Chain
Figure 67. Flame Retardants Production Process
Figure 68. Channels of Distribution (Direct Vs Distribution)
Figure 69. Distributors Profiles
Figure 70. Bottom-up and Top-down Approaches for This Report
Figure 71. Data Triangulation
$2900
$5800
HAVE A QUERY?
OUR CUSTOMER

SIMILAR REPORTS
Add to Cart
Add to Cart
Add to Cart
Add to Cart