List of Tables
Table 1. Global Market Customer Engagement Solutions Market Size (US$ Million) Comparison by Region 2018 VS 2022 VS 2029
Table 2. Global Customer Engagement Solutions Market Size by Region (2018-2023) & (US$ Million)
Table 3. Global Customer Engagement Solutions Market Size Share by Region (2018-2023)
Table 4. Global Customer Engagement Solutions Forecasted Market Size by Region (2024-2029) & (US$ Million)
Table 5. Global Customer Engagement Solutions Forecasted Market Size Share by Region (2024-2029)
Table 6. Global Customer Engagement Solutions Market Size (US$ Million) by Type: 2018 VS 2022 VS 2029
Table 7. Global Customer Engagement Solutions Market Size by Type (2018-2023) & (US$ Million)
Table 8. Global Customer Engagement Solutions Revenue Market Share by Type (2018-2023)
Table 9. Global Customer Engagement Solutions Forecasted Market Size by Type (2024-2029) & (US$ Million)
Table 10. Global Customer Engagement Solutions Revenue Market Share by Type (2024-2029)
Table 11. North America Customer Engagement Solutions Revenue by Type (2018-2023) & (US$ Million)
Table 12. North America Customer Engagement Solutions Revenue by Type (2024-2029) & (US$ Million)
Table 13. Europe Customer Engagement Solutions Revenue by Type (2018-2023) & (US$ Million)
Table 14. Europe Customer Engagement Solutions Revenue by Type (2024-2029) & (US$ Million)
Table 15. Asia-Pacific Customer Engagement Solutions Revenue by Type (2018-2023) & (US$ Million)
Table 16. Asia-Pacific Customer Engagement Solutions Revenue by Type (2024-2029) & (US$ Million)
Table 17. Latin America Customer Engagement Solutions Revenue by Type (2018-2023) & (US$ Million)
Table 18. Latin America Customer Engagement Solutions Revenue by Type (2024-2029) & (US$ Million)
Table 19. Middle East and Africa Customer Engagement Solutions Revenue by Type (2018-2023) & (US$ Million)
Table 20. Middle East and Africa Customer Engagement Solutions Revenue by Type (2024-2029) & (US$ Million)
Table 21. Global Customer Engagement Solutions Market Size (US$ Million) by Application: 2018 VS 2022 VS 2029
Table 22. Global Customer Engagement Solutions Market Size by Application (2018-2023) & (US$ Million)
Table 23. Global Customer Engagement Solutions Revenue Market Share by Application (2018-2023)
Table 24. Global Customer Engagement Solutions Forecasted Market Size by Application (2024-2029) & (US$ Million)
Table 25. Global Customer Engagement Solutions Revenue Market Share by Application (2024-2029)
Table 26. North America Customer Engagement Solutions Revenue by Application (2018-2023) & (US$ Million)
Table 27. North America Customer Engagement Solutions Revenue by Application (2024-2029) & (US$ Million)
Table 28. Europe Customer Engagement Solutions Revenue by Application (2018-2023) & (US$ Million)
Table 29. Europe Customer Engagement Solutions Revenue by Application (2024-2029) & (US$ Million)
Table 30. Asia-Pacific Customer Engagement Solutions Revenue by Application (2018-2023) & (US$ Million)
Table 31. Asia-Pacific Customer Engagement Solutions Revenue by Application (2024-2029) & (US$ Million)
Table 32. Latin America Customer Engagement Solutions Revenue by Application (2018-2023) & (US$ Million)
Table 33. Latin America Customer Engagement Solutions Revenue by Application (2024-2029) & (US$ Million)
Table 34. Middle East and Africa Customer Engagement Solutions Revenue by Application (2018-2023) & (US$ Million)
Table 35. Middle East and Africa Customer Engagement Solutions Revenue by Application (2024-2029) & (US$ Million)
Table 36. Global Customer Engagement Solutions Revenue (US$ Million) by Players (2018-2023)
Table 37. Global Customer Engagement Solutions Revenue Market Share by Players (2018-2023)
Table 38. Global Top Players Market Share by Company Type (Tier 1, Tier 2 and Tier 3) & (based on the Revenue in Customer Engagement Solutions as of 2022)
Table 39. Date of Key Players Enter into Customer Engagement Solutions Market
Table 40. Global Customer Engagement Solutions Key Players Headquarters and Area Served
Table 41. Customer Engagement Solutions Product Solution and Service
Table 42. Global Customer Engagement Solutions Players Market Concentration Ratio (CR5 and HHI)
Table 43. Mergers & Acquisitions, Expansion Plans
Table 44. Avaya Basic Information List
Table 45. Avaya Description and Business Overview
Table 46. Avaya Customer Engagement Solutions Products, Services and Solutions
Table 47. Revenue (US$ Million) in Customer Engagement Solutions Business of Avaya (2018-2023)
Table 48. Avaya Recent Developments
Table 49. Aspect Software Basic Information List
Table 50. Aspect Software Description and Business Overview
Table 51. Aspect Software Customer Engagement Solutions Products, Services and Solutions
Table 52. Revenue (US$ Million) in Customer Engagement Solutions Business of Aspect Software (2018-2023)
Table 53. Aspect Software Recent Developments
Table 54. Calabrio Basic Information List
Table 55. Calabrio Description and Business Overview
Table 56. Calabrio Customer Engagement Solutions Products, Services and Solutions
Table 57. Revenue (US$ Million) in Customer Engagement Solutions Business of Calabrio (2018-2023)
Table 58. Calabrio Recent Developments
Table 59. Genesys Basic Information List
Table 60. Genesys Description and Business Overview
Table 61. Genesys Customer Engagement Solutions Products, Services and Solutions
Table 62. Revenue (US$ Million) in Customer Engagement Solutions Business of Genesys (2018-2023)
Table 63. Genesys Recent Developments
Table 64. IBM Basic Information List
Table 65. IBM Description and Business Overview
Table 66. IBM Customer Engagement Solutions Products, Services and Solutions
Table 67. Revenue (US$ Million) in Customer Engagement Solutions Business of IBM (2018-2023)
Table 68. IBM Recent Developments
Table 69. Microsoft Basic Information List
Table 70. Microsoft Description and Business Overview
Table 71. Microsoft Customer Engagement Solutions Products, Services and Solutions
Table 72. Revenue (US$ Million) in Customer Engagement Solutions Business of Microsoft (2018-2023)
Table 73. Microsoft Recent Developments
Table 74. Nice Systems Basic Information List
Table 75. Nice Systems Description and Business Overview
Table 76. Nice Systems Customer Engagement Solutions Products, Services and Solutions
Table 77. Revenue (US$ Million) in Customer Engagement Solutions Business of Nice Systems (2018-2023)
Table 78. Nice Systems Recent Developments
Table 79. Nuance Communications Basic Information List
Table 80. Nuance Communications Description and Business Overview
Table 81. Nuance Communications Customer Engagement Solutions Products, Services and Solutions
Table 82. Revenue (US$ Million) in Customer Engagement Solutions Business of Nuance Communications (2018-2023)
Table 83. Nuance Communications Recent Developments
Table 84. Opentext Basic Information List
Table 85. Opentext Description and Business Overview
Table 86. Opentext Customer Engagement Solutions Products, Services and Solutions
Table 87. Revenue (US$ Million) in Customer Engagement Solutions Business of Opentext (2018-2023)
Table 88. Opentext Recent Developments
Table 89. Oracle Basic Information List
Table 90. Oracle Description and Business Overview
Table 91. Oracle Customer Engagement Solutions Products, Services and Solutions
Table 92. Revenue (US$ Million) in Customer Engagement Solutions Business of Oracle (2018-2023)
Table 93. Oracle Recent Developments
Table 94. Pegasystems Basic Information List
Table 95. Pegasystems Description and Business Overview
Table 96. Pegasystems Customer Engagement Solutions Products, Services and Solutions
Table 97. Revenue (US$ Million) in Customer Engagement Solutions Business of Pegasystems (2018-2023)
Table 98. Pegasystems Recent Developments
Table 99. Pitney Bowes Basic Information List
Table 100. Pitney Bowes Description and Business Overview
Table 101. Pitney Bowes Customer Engagement Solutions Products, Services and Solutions
Table 102. Revenue (US$ Million) in Customer Engagement Solutions Business of Pitney Bowes (2018-2023)
Table 103. Pitney Bowes Recent Developments
Table 104. Salesforce Basic Information List
Table 105. Salesforce Description and Business Overview
Table 106. Salesforce Customer Engagement Solutions Products, Services and Solutions
Table 107. Revenue (US$ Million) in Customer Engagement Solutions Business of Salesforce (2018-2023)
Table 108. Salesforce Recent Developments
Table 109. SAP Basic Information List
Table 110. SAP Description and Business Overview
Table 111. SAP Customer Engagement Solutions Products, Services and Solutions
Table 112. Revenue (US$ Million) in Customer Engagement Solutions Business of SAP (2018-2023)
Table 113. SAP Recent Developments
Table 114. Servicenow Basic Information List
Table 115. Servicenow Description and Business Overview
Table 116. Servicenow Customer Engagement Solutions Products, Services and Solutions
Table 117. Revenue (US$ Million) in Customer Engagement Solutions Business of Servicenow (2018-2023)
Table 118. Servicenow Recent Developments
Table 119. Verint Systems Basic Information List
Table 120. Verint Systems Description and Business Overview
Table 121. Verint Systems Customer Engagement Solutions Products, Services and Solutions
Table 122. Revenue (US$ Million) in Customer Engagement Solutions Business of Verint Systems (2018-2023)
Table 123. Verint Systems Recent Developments
Table 124. Zendesk Basic Information List
Table 125. Zendesk Description and Business Overview
Table 126. Zendesk Customer Engagement Solutions Products, Services and Solutions
Table 127. Revenue (US$ Million) in Customer Engagement Solutions Business of Zendesk (2018-2023)
Table 128. Zendesk Recent Developments
Table 129. Egain Corporation Basic Information List
Table 130. Egain Corporation Description and Business Overview
Table 131. Egain Corporation Customer Engagement Solutions Products, Services and Solutions
Table 132. Revenue (US$ Million) in Customer Engagement Solutions Business of Egain Corporation (2018-2023)
Table 133. Egain Corporation Recent Developments
Table 134. Bpmonline Basic Information List
Table 135. Bpmonline Description and Business Overview
Table 136. Bpmonline Customer Engagement Solutions Products, Services and Solutions
Table 137. Revenue (US$ Million) in Customer Engagement Solutions Business of Bpmonline (2018-2023)
Table 138. Bpmonline Recent Developments
Table 139. Crmnext Basic Information List
Table 140. Crmnext Description and Business Overview
Table 141. Crmnext Customer Engagement Solutions Products, Services and Solutions
Table 142. Revenue (US$ Million) in Customer Engagement Solutions Business of Crmnext (2018-2023)
Table 143. Crmnext Recent Developments
Table 144. Eptica Basic Information List
Table 145. Eptica Description and Business Overview
Table 146. Eptica Customer Engagement Solutions Products, Services and Solutions
Table 147. Revenue (US$ Million) in Customer Engagement Solutions Business of Eptica (2018-2023)
Table 148. Eptica Recent Developments
Table 149. Freshworks Basic Information List
Table 150. Freshworks Description and Business Overview
Table 151. Freshworks Customer Engagement Solutions Products, Services and Solutions
Table 152. Revenue (US$ Million) in Customer Engagement Solutions Business of Freshworks (2018-2023)
Table 153. Freshworks Recent Developments
Table 154. Ifs-Mplsystems Basic Information List
Table 155. Ifs-Mplsystems Description and Business Overview
Table 156. Ifs-Mplsystems Customer Engagement Solutions Products, Services and Solutions
Table 157. Revenue (US$ Million) in Customer Engagement Solutions Business of Ifs-Mplsystems (2018-2023)
Table 158. Ifs-Mplsystems Recent Developments
Table 159. Lithium Technologies Basic Information List
Table 160. Lithium Technologies Description and Business Overview
Table 161. Lithium Technologies Customer Engagement Solutions Products, Services and Solutions
Table 162. Revenue (US$ Million) in Customer Engagement Solutions Business of Lithium Technologies (2018-2023)
Table 163. Lithium Technologies Recent Developments
Table 164. Sugarcrm Basic Information List
Table 165. Sugarcrm Description and Business Overview
Table 166. Sugarcrm Customer Engagement Solutions Products, Services and Solutions
Table 167. Revenue (US$ Million) in Customer Engagement Solutions Business of Sugarcrm (2018-2023)
Table 168. Sugarcrm Recent Developments
Table 169. North America Customer Engagement Solutions Market Size by Country (2018-2023) & (US$ Million)
Table 170. North America Customer Engagement Solutions Market Size by Country (2024-2029) & (US$ Million)
Table 171. Europe Customer Engagement Solutions Market Size by Country (2018-2023) & (US$ Million)
Table 172. Europe Customer Engagement Solutions Market Size by Country (2024-2029) & (US$ Million)
Table 173. Asia-Pacific Customer Engagement Solutions Market Size Growth Rate (CAGR) by Region (US$ Million): 2018 VS 2022 VS 2029
Table 174. Asia-Pacific Customer Engagement Solutions Market Size by Region (2018-2023) & (US$ Million)
Table 175. Asia-Pacific Customer Engagement Solutions Market Size by Region (2024-2029) & (US$ Million)
Table 176. Asia-Pacific Customer Engagement Solutions Market Share by Region (2018-2023)
Table 177. Asia-Pacific Customer Engagement Solutions Market Share by Region (2024-2029)
Table 178. Latin America Customer Engagement Solutions Market Size Growth Rate (CAGR) by Region (US$ Million): 2018 VS 2022 VS 2029
Table 179. Latin America Customer Engagement Solutions Market Size by Country (2018-2023) & (US$ Million)
Table 180. Latin America Customer Engagement Solutions Market Size by Country (2024-2029) & (US$ Million)
Table 181. Middle East & Africa Customer Engagement Solutions Market Size Growth Rate (CAGR) by Region (US$ Million): 2018 VS 2022 VS 2029
Table 182. Middle East & Africa Customer Engagement Solutions Market Size by Country (2018-2023) & (US$ Million)
Table 183. Middle East & Africa Customer Engagement Solutions Market Size by Country (2024-2029) & (US$ Million)
Table 184. Customer Engagement Solutions Market Trends
Table 185. Customer Engagement Solutions Market Drivers
Table 186. Customer Engagement Solutions Market Challenges
Table 187. Customer Engagement Solutions Market Restraints
Table 188. Research Programs/Design for This Report
Table 189. Key Data Information from Secondary Sources
Table 190. Key Data Information from Primary Sources
List of Figures
Figure 1. Global Customer Engagement Solutions Market Size Year-over-Year 2018-2029 & (US$ Million)
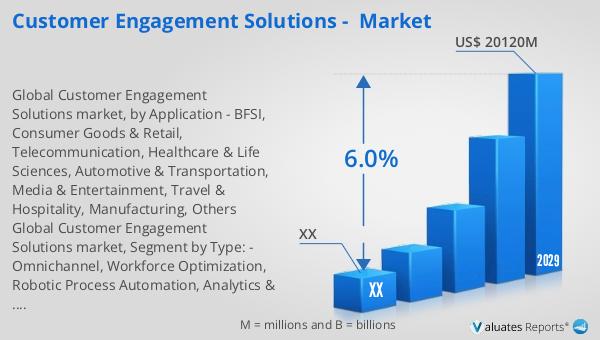
Figure 2. Global Customer Engagement Solutions Market Size (US$ Million), 2018 VS 2022 VS 2029
Figure 3. Global Customer Engagement Solutions Market Share by Regions: 2022 VS 2029
Figure 4. Global Customer Engagement Solutions Forecasted Market Size Share by Region (2024-2029)
Figure 5. North America Customer Engagement Solutions Market Size Growth Rate (2018-2029) & (US$ Million)
Figure 6. Europe Customer Engagement Solutions Market Size Growth Rate (2018-2029) & (US$ Million)
Figure 7. Asia-Pacific Customer Engagement Solutions Market Size Growth Rate (2018-2029) & (US$ Million)
Figure 8. Latin America Customer Engagement Solutions Market Size Growth Rate (2018-2029) & (US$ Million)
Figure 9. Middle East & Africa Customer Engagement Solutions Market Size Growth Rate (2018-2029) & (US$ Million)
Figure 10. Product Picture of Omnichannel
Figure 11. Global Omnichannel Market Size (US$ Million) & YoY Growth (2018-2029)
Figure 12. Product Picture of Workforce Optimization
Figure 13. Global Workforce Optimization Market Size (US$ Million) & YoY Growth (2018-2029)
Figure 14. Product Picture of Robotic Process Automation
Figure 15. Global Robotic Process Automation Market Size (US$ Million) & YoY Growth (2018-2029)
Figure 16. Product Picture of Analytics & Reporting
Figure 17. Global Analytics & Reporting Market Size (US$ Million) & YoY Growth (2018-2029)
Figure 18. Global Customer Engagement Solutions Market Size Share by Type: 2022 & 2029
Figure 19. North America Customer Engagement Solutions Revenue Market Share by Type (2018-2029)
Figure 20. Europe Customer Engagement Solutions Revenue Market Share by Type (2018-2029)
Figure 21. Asia-Pacific Customer Engagement Solutions Revenue Market Share by Type (2018-2029)
Figure 22. Latin America Customer Engagement Solutions Revenue Market Share by Type (2018-2029)
Figure 23. Middle East and Africa Customer Engagement Solutions Revenue Market Share by Type (2018-2029)
Figure 24. BFSI Market Size (US$ Million) & YoY Growth (2018-2029)
Figure 25. Consumer Goods & Retail Market Size (US$ Million) & YoY Growth (2018-2029)
Figure 26. Telecommunication Market Size (US$ Million) & YoY Growth (2018-2029)
Figure 27. Healthcare & Life Sciences Market Size (US$ Million) & YoY Growth (2018-2029)
Figure 28. Automotive & Transportation Market Size (US$ Million) & YoY Growth (2018-2029)
Figure 29. Media & Entertainment Market Size (US$ Million) & YoY Growth (2018-2029)
Figure 30. Travel & Hospitality Market Size (US$ Million) & YoY Growth (2018-2029)
Figure 31. Manufacturing Market Size (US$ Million) & YoY Growth (2018-2029)
Figure 32. Others Market Size (US$ Million) & YoY Growth (2018-2029)
Figure 33. Global Customer Engagement Solutions Market Size Share by Application: 2022 & 2029
Figure 34. North America Customer Engagement Solutions Revenue Market Share by Application (2018-2029)
Figure 35. Europe Customer Engagement Solutions Revenue Market Share by Application (2018-2029)
Figure 36. Asia-Pacific Customer Engagement Solutions Revenue Market Share by Application (2018-2029)
Figure 37. Latin America Customer Engagement Solutions Revenue Market Share by Application (2018-2029)
Figure 38. Middle East and Africa Customer Engagement Solutions Revenue Market Share by Application (2018-2029)
Figure 39. Customer Engagement Solutions Market Share by Company Type (Tier 1, Tier 2 and Tier 3): 2018 VS 2022
Figure 40. Global Top 5 and Top 10 Players Customer Engagement Solutions Market Share in 2022
Figure 41. North America Customer Engagement Solutions Market Share by Country (2018-2029)
Figure 42. U.S. Customer Engagement Solutions Market Size (2018-2029) & (US$ Million)
Figure 43. Canada Customer Engagement Solutions Market Size (2018-2029) & (US$ Million)
Figure 44. Germany Customer Engagement Solutions Market Size (2018-2029) & (US$ Million)
Figure 45. France Customer Engagement Solutions Market Size (2018-2029) & (US$ Million)
Figure 46. U.K. Customer Engagement Solutions Market Size (2018-2029) & (US$ Million)
Figure 47. Italy Customer Engagement Solutions Market Size (2018-2029) & (US$ Million)
Figure 48. Russia Customer Engagement Solutions Market Size (2018-2029) & (US$ Million)
Figure 49. Nordic Countries Customer Engagement Solutions Market Size (2018-2029) & (US$ Million)
Figure 50. Asia-Pacific Customer Engagement Solutions Market Share by Region (2018-2029)
Figure 51. China Customer Engagement Solutions Market Size (2018-2029) & (US$ Million)
Figure 52. Japan Customer Engagement Solutions Market Size (2018-2029) & (US$ Million)
Figure 53. South Korea Customer Engagement Solutions Market Size (2018-2029) & (US$ Million)
Figure 54. Southeast Asia Customer Engagement Solutions Market Size (2018-2029) & (US$ Million)
Figure 55. India Customer Engagement Solutions Market Size (2018-2029) & (US$ Million)
Figure 56. Australia Customer Engagement Solutions Market Size (2018-2029) & (US$ Million)
Figure 57. Latin America Customer Engagement Solutions Market Share by Country (2018-2029)
Figure 58. Mexico Customer Engagement Solutions Market Size (2018-2029) & (US$ Million)
Figure 59. Brazil Customer Engagement Solutions Market Size (2018-2029) & (US$ Million)
Figure 60. Middle East & Africa Customer Engagement Solutions Market Share by Country (2018-2029)
Figure 61. Turkey Customer Engagement Solutions Market Size (2018-2029) & (US$ Million)
Figure 62. Saudi Arabia Customer Engagement Solutions Market Size (2018-2029) & (US$ Million)
Figure 63. UAE Customer Engagement Solutions Market Size (2018-2029) & (US$ Million)
Figure 64. Bottom-up and Top-down Approaches for This Report