List of Tables
Table 1. Global Cutlerys Market Value Comparison by Type (2024 VS 2031) & (US$ Million)
Table 2. Global Cutlerys Market Value by Application (2024 VS 2031) & (US$ Million)
Table 3. Global Cutlerys Market Competitive Situation by Manufacturers in 2024
Table 4. Global Cutlerys Sales (M Units) of Key Manufacturers (2020-2025)
Table 5. Global Cutlerys Sales Market Share by Manufacturers (2020-2025)
Table 6. Global Cutlerys Revenue (US$ Million) by Manufacturers (2020-2025)
Table 7. Global Cutlerys Revenue Share by Manufacturers (2020-2025)
Table 8. Global Market Cutlerys Average Price (USD/K Units) of Key Manufacturers (2020-2025)
Table 9. Global Key Players of Cutlerys, Industry Ranking, 2022 VS 2023 VS 2024
Table 10. Global Key Manufacturers of Cutlerys, Manufacturing Sites & Headquarters
Table 11. Global Key Manufacturers of Cutlerys, Product Type & Application
Table 12. Global Key Manufacturers of Cutlerys, Date of Enter into This Industry
Table 13. Global Manufacturers Market Concentration Ratio (CR5 and HHI)
Table 14. Global Cutlerys by Company Type (Tier 1, Tier 2, and Tier 3) & (based on the Revenue in Cutlerys as of 2024)
Table 15. Manufacturers Mergers & Acquisitions, Expansion Plans
Table 16. Global Cutlerys Market Size by Region (US$ Million): 2020 VS 2024 VS 2031
Table 17. Global Cutlerys Sales by Region (2020-2025) & (M Units)
Table 18. Global Cutlerys Sales Market Share by Region (2020-2025)
Table 19. Global Cutlerys Sales by Region (2026-2031) & (M Units)
Table 20. Global Cutlerys Sales Market Share by Region (2026-2031)
Table 21. Global Cutlerys Revenue by Region (2020-2025) & (US$ Million)
Table 22. Global Cutlerys Revenue Market Share by Region (2020-2025)
Table 23. Global Cutlerys Revenue by Region (2026-2031) & (US$ Million)
Table 24. Global Cutlerys Revenue Market Share by Region (2026-2031)
Table 25. North America Cutlerys Revenue by Country: 2020 VS 2024 VS 2031 (US$ Million)
Table 26. North America Cutlerys Sales by Country (2020-2025) & (M Units)
Table 27. North America Cutlerys Sales by Country (2026-2031) & (M Units)
Table 28. North America Cutlerys Revenue by Country (2020-2025) & (US$ Million)
Table 29. North America Cutlerys Revenue by Country (2026-2031) & (US$ Million)
Table 30. Europe Cutlerys Revenue by Country: 2020 VS 2024 VS 2031 (US$ Million)
Table 31. Europe Cutlerys Sales by Country (2020-2025) & (M Units)
Table 32. Europe Cutlerys Sales by Country (2026-2031) & (M Units)
Table 33. Europe Cutlerys Revenue by Country (2020-2025) & (US$ Million)
Table 34. Europe Cutlerys Revenue by Country (2026-2031) & (US$ Million)
Table 35. Asia Pacific Cutlerys Revenue by Region: 2020 VS 2024 VS 2031 (US$ Million)
Table 36. Asia Pacific Cutlerys Sales by Region (2020-2025) & (M Units)
Table 37. Asia Pacific Cutlerys Sales by Region (2026-2031) & (M Units)
Table 38. Asia Pacific Cutlerys Revenue by Region (2020-2025) & (US$ Million)
Table 39. Asia Pacific Cutlerys Revenue by Region (2026-2031) & (US$ Million)
Table 40. Latin America Cutlerys Revenue by Country: 2020 VS 2024 VS 2031 (US$ Million)
Table 41. Latin America Cutlerys Sales by Country (2020-2025) & (M Units)
Table 42. Latin America Cutlerys Sales by Country (2026-2031) & (M Units)
Table 43. Latin America Cutlerys Revenue by Country (2020-2025) & (US$ Million)
Table 44. Latin America Cutlerys Revenue by Country (2026-2031) & (US$ Million)
Table 45. Middle East and Africa Cutlerys Revenue by Country: 2020 VS 2024 VS 2031 (US$ Million)
Table 46. Middle East and Africa Cutlerys Sales by Country (2020-2025) & (M Units)
Table 47. Middle East and Africa Cutlerys Sales by Country (2026-2031) & (M Units)
Table 48. Middle East and Africa Cutlerys Revenue by Country (2020-2025) & (US$ Million)
Table 49. Middle East and Africa Cutlerys Revenue by Country (2026-2031) & (US$ Million)
Table 50. Global Cutlerys Sales (M Units) by Type (2020-2025)
Table 51. Global Cutlerys Sales (M Units) by Type (2026-2031)
Table 52. Global Cutlerys Sales Market Share by Type (2020-2025)
Table 53. Global Cutlerys Sales Market Share by Type (2026-2031)
Table 54. Global Cutlerys Revenue (US$ Million) by Type (2020-2025)
Table 55. Global Cutlerys Revenue (US$ Million) by Type (2026-2031)
Table 56. Global Cutlerys Revenue Market Share by Type (2020-2025)
Table 57. Global Cutlerys Revenue Market Share by Type (2026-2031)
Table 58. Global Cutlerys Price (USD/K Units) by Type (2020-2025)
Table 59. Global Cutlerys Price (USD/K Units) by Type (2026-2031)
Table 60. Global Cutlerys Sales (M Units) by Application (2020-2025)
Table 61. Global Cutlerys Sales (M Units) by Application (2026-2031)
Table 62. Global Cutlerys Sales Market Share by Application (2020-2025)
Table 63. Global Cutlerys Sales Market Share by Application (2026-2031)
Table 64. Global Cutlerys Revenue (US$ Million) by Application (2020-2025)
Table 65. Global Cutlerys Revenue (US$ Million) by Application (2026-2031)
Table 66. Global Cutlerys Revenue Market Share by Application (2020-2025)
Table 67. Global Cutlerys Revenue Market Share by Application (2026-2031)
Table 68. Global Cutlerys Price (USD/K Units) by Application (2020-2025)
Table 69. Global Cutlerys Price (USD/K Units) by Application (2026-2031)
Table 70. ZWILLING Company Information
Table 71. ZWILLING Description and Business Overview
Table 72. ZWILLING Cutlerys Sales (M Units), Revenue (US$ Million), Price (USD/K Units) and Gross Margin (2020-2025)
Table 73. ZWILLING Cutlerys Product
Table 74. ZWILLING Recent Developments/Updates
Table 75. SEB Company Information
Table 76. SEB Description and Business Overview
Table 77. SEB Cutlerys Sales (M Units), Revenue (US$ Million), Price (USD/K Units) and Gross Margin (2020-2025)
Table 78. SEB Cutlerys Product
Table 79. SEB Recent Developments/Updates
Table 80. Biopac Company Information
Table 81. Biopac Description and Business Overview
Table 82. Biopac Cutlerys Sales (M Units), Revenue (US$ Million), Price (USD/K Units) and Gross Margin (2020-2025)
Table 83. Biopac Cutlerys Product
Table 84. Biopac Recent Developments/Updates
Table 85. KAI Company Information
Table 86. KAI Description and Business Overview
Table 87. KAI Cutlerys Sales (M Units), Revenue (US$ Million), Price (USD/K Units) and Gross Margin (2020-2025)
Table 88. KAI Cutlerys Product
Table 89. KAI Recent Developments/Updates
Table 90. Mitsuboshi Cutlery Company Information
Table 91. Mitsuboshi Cutlery Description and Business Overview
Table 92. Mitsuboshi Cutlery Cutlerys Sales (M Units), Revenue (US$ Million), Price (USD/K Units) and Gross Margin (2020-2025)
Table 93. Mitsuboshi Cutlery Cutlerys Product
Table 94. Mitsuboshi Cutlery Recent Developments/Updates
Table 95. Yamazaki Kinzoku Kogyo Company Information
Table 96. Yamazaki Kinzoku Kogyo Description and Business Overview
Table 97. Yamazaki Kinzoku Kogyo Cutlerys Sales (M Units), Revenue (US$ Million), Price (USD/K Units) and Gross Margin (2020-2025)
Table 98. Yamazaki Kinzoku Kogyo Cutlerys Product
Table 99. Yamazaki Kinzoku Kogyo Recent Developments/Updates
Table 100. Jikko Cutlery Company Information
Table 101. Jikko Cutlery Description and Business Overview
Table 102. Jikko Cutlery Cutlerys Sales (M Units), Revenue (US$ Million), Price (USD/K Units) and Gross Margin (2020-2025)
Table 103. Jikko Cutlery Cutlerys Product
Table 104. Jikko Cutlery Recent Developments/Updates
Table 105. Huhtamaki Company Information
Table 106. Huhtamaki Description and Business Overview
Table 107. Huhtamaki Cutlerys Sales (M Units), Revenue (US$ Million), Price (USD/K Units) and Gross Margin (2020-2025)
Table 108. Huhtamaki Cutlerys Product
Table 109. Huhtamaki Recent Developments/Updates
Table 110. Dart Company Information
Table 111. Dart Description and Business Overview
Table 112. Dart Cutlerys Sales (M Units), Revenue (US$ Million), Price (USD/K Units) and Gross Margin (2020-2025)
Table 113. Dart Cutlerys Product
Table 114. Dart Recent Developments/Updates
Table 115. Lollicup USA Company Information
Table 116. Lollicup USA Description and Business Overview
Table 117. Lollicup USA Cutlerys Sales (M Units), Revenue (US$ Million), Price (USD/K Units) and Gross Margin (2020-2025)
Table 118. Lollicup USA Cutlerys Product
Table 119. Lollicup USA Recent Developments/Updates
Table 120. Solia Company Information
Table 121. Solia Description and Business Overview
Table 122. Solia Cutlerys Sales (M Units), Revenue (US$ Million), Price (USD/K Units) and Gross Margin (2020-2025)
Table 123. Solia Cutlerys Product
Table 124. Solia Recent Developments/Updates
Table 125. TrueChoicePack (TCP) Company Information
Table 126. TrueChoicePack (TCP) Description and Business Overview
Table 127. TrueChoicePack (TCP) Cutlerys Sales (M Units), Revenue (US$ Million), Price (USD/K Units) and Gross Margin (2020-2025)
Table 128. TrueChoicePack (TCP) Cutlerys Product
Table 129. TrueChoicePack (TCP) Recent Developments/Updates
Table 130. Eco-Products Company Information
Table 131. Eco-Products Description and Business Overview
Table 132. Eco-Products Cutlerys Sales (M Units), Revenue (US$ Million), Price (USD/K Units) and Gross Margin (2020-2025)
Table 133. Eco-Products Cutlerys Product
Table 134. Eco-Products Recent Developments/Updates
Table 135. Swantex Company Information
Table 136. Swantex Description and Business Overview
Table 137. Swantex Cutlerys Sales (M Units), Revenue (US$ Million), Price (USD/K Units) and Gross Margin (2020-2025)
Table 138. Swantex Cutlerys Product
Table 139. Swantex Recent Developments/Updates
Table 140. David Mellor Design Company Information
Table 141. David Mellor Design Description and Business Overview
Table 142. David Mellor Design Cutlerys Sales (M Units), Revenue (US$ Million), Price (USD/K Units) and Gross Margin (2020-2025)
Table 143. David Mellor Design Cutlerys Product
Table 144. David Mellor Design Recent Developments/Updates
Table 145. Dopla Company Information
Table 146. Dopla Description and Business Overview
Table 147. Dopla Cutlerys Sales (M Units), Revenue (US$ Million), Price (USD/K Units) and Gross Margin (2020-2025)
Table 148. Dopla Cutlerys Product
Table 149. Dopla Recent Developments/Updates
Table 150. Sola Switzerland Company Information
Table 151. Sola Switzerland Description and Business Overview
Table 152. Sola Switzerland Cutlerys Sales (M Units), Revenue (US$ Million), Price (USD/K Units) and Gross Margin (2020-2025)
Table 153. Sola Switzerland Cutlerys Product
Table 154. Sola Switzerland Recent Developments/Updates
Table 155. Kaimei Housewares (Qingdao) Company Information
Table 156. Kaimei Housewares (Qingdao) Description and Business Overview
Table 157. Kaimei Housewares (Qingdao) Cutlerys Sales (M Units), Revenue (US$ Million), Price (USD/K Units) and Gross Margin (2020-2025)
Table 158. Kaimei Housewares (Qingdao) Cutlerys Product
Table 159. Kaimei Housewares (Qingdao) Recent Developments/Updates
Table 160. Ernst Klever Company Information
Table 161. Ernst Klever Description and Business Overview
Table 162. Ernst Klever Cutlerys Sales (M Units), Revenue (US$ Million), Price (USD/K Units) and Gross Margin (2020-2025)
Table 163. Ernst Klever Cutlerys Product
Table 164. Ernst Klever Recent Developments/Updates
Table 165. Wilkens Company Information
Table 166. Wilkens Description and Business Overview
Table 167. Wilkens Cutlerys Sales (M Units), Revenue (US$ Million), Price (USD/K Units) and Gross Margin (2020-2025)
Table 168. Wilkens Cutlerys Product
Table 169. Wilkens Recent Developments/Updates
Table 170. Fissler Company Information
Table 171. Fissler Description and Business Overview
Table 172. Fissler Cutlerys Sales (M Units), Revenue (US$ Million), Price (USD/K Units) and Gross Margin (2020-2025)
Table 173. Fissler Cutlerys Product
Table 174. Fissler Recent Developments/Updates
Table 175. WMF Company Information
Table 176. WMF Description and Business Overview
Table 177. WMF Cutlerys Sales (M Units), Revenue (US$ Million), Price (USD/K Units) and Gross Margin (2020-2025)
Table 178. WMF Cutlerys Product
Table 179. WMF Recent Developments/Updates
Table 180. Vinod Company Information
Table 181. Vinod Description and Business Overview
Table 182. Vinod Cutlerys Sales (M Units), Revenue (US$ Million), Price (USD/K Units) and Gross Margin (2020-2025)
Table 183. Vinod Cutlerys Product
Table 184. Vinod Recent Developments/Updates
Table 185. Klaus Meyer Company Information
Table 186. Klaus Meyer Description and Business Overview
Table 187. Klaus Meyer Cutlerys Sales (M Units), Revenue (US$ Million), Price (USD/K Units) and Gross Margin (2020-2025)
Table 188. Klaus Meyer Cutlerys Product
Table 189. Klaus Meyer Recent Developments/Updates
Table 190. Cristema Company Information
Table 191. Cristema Description and Business Overview
Table 192. Cristema Cutlerys Sales (M Units), Revenue (US$ Million), Price (USD/K Units) and Gross Margin (2020-2025)
Table 193. Cristema Cutlerys Product
Table 194. Cristema Recent Developments/Updates
Table 195. Germancut Company Information
Table 196. Germancut Description and Business Overview
Table 197. Germancut Cutlerys Sales (M Units), Revenue (US$ Million), Price (USD/K Units) and Gross Margin (2020-2025)
Table 198. Germancut Cutlerys Product
Table 199. Germancut Recent Developments/Updates
Table 200. Studio William Welch Company Information
Table 201. Studio William Welch Description and Business Overview
Table 202. Studio William Welch Cutlerys Sales (M Units), Revenue (US$ Million), Price (USD/K Units) and Gross Margin (2020-2025)
Table 203. Studio William Welch Cutlerys Product
Table 204. Studio William Welch Recent Developments/Updates
Table 205. Cuisinart Company Information
Table 206. Cuisinart Description and Business Overview
Table 207. Cuisinart Cutlerys Sales (M Units), Revenue (US$ Million), Price (USD/K Units) and Gross Margin (2020-2025)
Table 208. Cuisinart Cutlerys Product
Table 209. Cuisinart Recent Developments/Updates
Table 210. Pappco Greenware Company Information
Table 211. Pappco Greenware Description and Business Overview
Table 212. Pappco Greenware Cutlerys Sales (M Units), Revenue (US$ Million), Price (USD/K Units) and Gross Margin (2020-2025)
Table 213. Pappco Greenware Cutlerys Product
Table 214. Pappco Greenware Recent Developments/Updates
Table 215. Pakka Company Information
Table 216. Pakka Description and Business Overview
Table 217. Pakka Cutlerys Sales (M Units), Revenue (US$ Million), Price (USD/K Units) and Gross Margin (2020-2025)
Table 218. Pakka Cutlerys Product
Table 219. Pakka Recent Developments/Updates
Table 220. J&L Enterprise Company Information
Table 221. J&L Enterprise Description and Business Overview
Table 222. J&L Enterprise Cutlerys Sales (M Units), Revenue (US$ Million), Price (USD/K Units) and Gross Margin (2020-2025)
Table 223. J&L Enterprise Cutlerys Product
Table 224. J&L Enterprise Recent Developments/Updates
Table 225. Green Olive Environmental Technology Company Information
Table 226. Green Olive Environmental Technology Description and Business Overview
Table 227. Green Olive Environmental Technology Cutlerys Sales (M Units), Revenue (US$ Million), Price (USD/K Units) and Gross Margin (2020-2025)
Table 228. Green Olive Environmental Technology Cutlerys Product
Table 229. Green Olive Environmental Technology Recent Developments/Updates
Table 230. AS Food Packaging Greendale Company Information
Table 231. AS Food Packaging Greendale Description and Business Overview
Table 232. AS Food Packaging Greendale Cutlerys Sales (M Units), Revenue (US$ Million), Price (USD/K Units) and Gross Margin (2020-2025)
Table 233. AS Food Packaging Greendale Cutlerys Product
Table 234. AS Food Packaging Greendale Recent Developments/Updates
Table 235. DevEuro Paper Products Company Information
Table 236. DevEuro Paper Products Description and Business Overview
Table 237. DevEuro Paper Products Cutlerys Sales (M Units), Revenue (US$ Million), Price (USD/K Units) and Gross Margin (2020-2025)
Table 238. DevEuro Paper Products Cutlerys Product
Table 239. DevEuro Paper Products Recent Developments/Updates
Table 240. Saattvic Ecocare Products Company Information
Table 241. Saattvic Ecocare Products Description and Business Overview
Table 242. Saattvic Ecocare Products Cutlerys Sales (M Units), Revenue (US$ Million), Price (USD/K Units) and Gross Margin (2020-2025)
Table 243. Saattvic Ecocare Products Cutlerys Product
Table 244. Saattvic Ecocare Products Recent Developments/Updates
Table 245. Vegware Company Information
Table 246. Vegware Description and Business Overview
Table 247. Vegware Cutlerys Sales (M Units), Revenue (US$ Million), Price (USD/K Units) and Gross Margin (2020-2025)
Table 248. Vegware Cutlerys Product
Table 249. Vegware Recent Developments/Updates
Table 250. VerTerra Dinnerware Company Information
Table 251. VerTerra Dinnerware Description and Business Overview
Table 252. VerTerra Dinnerware Cutlerys Sales (M Units), Revenue (US$ Million), Price (USD/K Units) and Gross Margin (2020-2025)
Table 253. VerTerra Dinnerware Cutlerys Product
Table 254. VerTerra Dinnerware Recent Developments/Updates
Table 255. Leafware Company Information
Table 256. Leafware Description and Business Overview
Table 257. Leafware Cutlerys Sales (M Units), Revenue (US$ Million), Price (USD/K Units) and Gross Margin (2020-2025)
Table 258. Leafware Cutlerys Product
Table 259. Leafware Recent Developments/Updates
Table 260. Bambu Company Information
Table 261. Bambu Description and Business Overview
Table 262. Bambu Cutlerys Sales (M Units), Revenue (US$ Million), Price (USD/K Units) and Gross Margin (2020-2025)
Table 263. Bambu Cutlerys Product
Table 264. Bambu Recent Developments/Updates
Table 265. Ecoriti Company Information
Table 266. Ecoriti Description and Business Overview
Table 267. Ecoriti Cutlerys Sales (M Units), Revenue (US$ Million), Price (USD/K Units) and Gross Margin (2020-2025)
Table 268. Ecoriti Cutlerys Product
Table 269. Ecoriti Recent Developments/Updates
Table 270. Key Raw Materials Lists
Table 271. Raw Materials Key Suppliers Lists
Table 272. Cutlerys Distributors List
Table 273. Cutlerys Customers List
Table 274. Cutlerys Market Trends
Table 275. Cutlerys Market Drivers
Table 276. Cutlerys Market Challenges
Table 277. Cutlerys Market Restraints
Table 278. Research Programs/Design for This Report
Table 279. Key Data Information from Secondary Sources
Table 280. Key Data Information from Primary Sources
Table 281. Authors List of This Report
List of Figures
Figure 1. Product Picture of Cutlerys
Figure 2. Global Cutlerys Market Value Comparison by Type (2020-2031) & (US$ Million)
Figure 3. Global Cutlerys Market Share by Type: 2024 & 2031
Figure 4. Stainless Steel Cutlery Product Picture
Figure 5. Ceramic Cutlery Product Picture
Figure 6. Plastic Cutlery Product Picture
Figure 7. Bamboo & Wooden Cutlery Product Picture
Figure 8. Titanium Alloy Cutlery Product Picture
Figure 9. Global Cutlerys Market Value by Application (2020-2031) & (US$ Million)
Figure 10. Global Cutlerys Market Share by Application: 2024 & 2031
Figure 11. Food and Beverage
Figure 12. Household
Figure 13. Hospital
Figure 14. Aviation
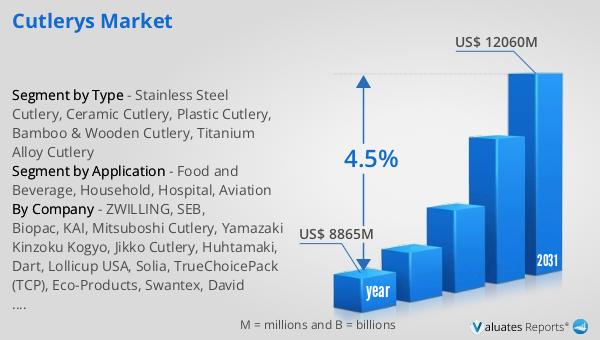
Figure 15. Global Cutlerys Revenue, (US$ Million), 2020 VS 2024 VS 2031
Figure 16. Global Cutlerys Market Size (2020-2031) & (US$ Million)
Figure 17. Global Cutlerys Sales (2020-2031) & (M Units)
Figure 18. Global Cutlerys Average Price (USD/K Units) & (2020-2031)
Figure 19. Cutlerys Report Years Considered
Figure 20. Cutlerys Sales Share by Manufacturers in 2024
Figure 21. Global Cutlerys Revenue Share by Manufacturers in 2024
Figure 22. Global 5 and 10 Largest Cutlerys Players: Market Share by Revenue in Cutlerys in 2024
Figure 23. Cutlerys Market Share by Company Type (Tier 1, Tier 2, and Tier 3): 2020 VS 2024
Figure 24. Global Cutlerys Market Size by Region (US$ Million): 2020 VS 2024 VS 2031
Figure 25. North America Cutlerys Sales Market Share by Country (2020-2031)
Figure 26. North America Cutlerys Revenue Market Share by Country (2020-2031)
Figure 27. United States Cutlerys Revenue Growth Rate (2020-2031) & (US$ Million)
Figure 28. Canada Cutlerys Revenue Growth Rate (2020-2031) & (US$ Million)
Figure 29. Europe Cutlerys Sales Market Share by Country (2020-2031)
Figure 30. Europe Cutlerys Revenue Market Share by Country (2020-2031)
Figure 31. Germany Cutlerys Revenue Growth Rate (2020-2031) & (US$ Million)
Figure 32. France Cutlerys Revenue Growth Rate (2020-2031) & (US$ Million)
Figure 33. U.K. Cutlerys Revenue Growth Rate (2020-2031) & (US$ Million)
Figure 34. Italy Cutlerys Revenue Growth Rate (2020-2031) & (US$ Million)
Figure 35. Russia Cutlerys Revenue Growth Rate (2020-2031) & (US$ Million)
Figure 36. Asia Pacific Cutlerys Sales Market Share by Region (2020-2031)
Figure 37. Asia Pacific Cutlerys Revenue Market Share by Region (2020-2031)
Figure 38. China Cutlerys Revenue Growth Rate (2020-2031) & (US$ Million)
Figure 39. Japan Cutlerys Revenue Growth Rate (2020-2031) & (US$ Million)
Figure 40. South Korea Cutlerys Revenue Growth Rate (2020-2031) & (US$ Million)
Figure 41. India Cutlerys Revenue Growth Rate (2020-2031) & (US$ Million)
Figure 42. Australia Cutlerys Revenue Growth Rate (2020-2031) & (US$ Million)
Figure 43. China Taiwan Cutlerys Revenue Growth Rate (2020-2031) & (US$ Million)
Figure 44. Southeast Asia Cutlerys Revenue Growth Rate (2020-2031) & (US$ Million)
Figure 45. Latin America Cutlerys Sales Market Share by Country (2020-2031)
Figure 46. Latin America Cutlerys Revenue Market Share by Country (2020-2031)
Figure 47. Mexico Cutlerys Revenue Growth Rate (2020-2031) & (US$ Million)
Figure 48. Brazil Cutlerys Revenue Growth Rate (2020-2031) & (US$ Million)
Figure 49. Argentina Cutlerys Revenue Growth Rate (2020-2031) & (US$ Million)
Figure 50. Colombia Cutlerys Revenue Growth Rate (2020-2031) & (US$ Million)
Figure 51. Middle East and Africa Cutlerys Sales Market Share by Country (2020-2031)
Figure 52. Middle East and Africa Cutlerys Revenue Market Share by Country (2020-2031)
Figure 53. Turkey Cutlerys Revenue Growth Rate (2020-2031) & (US$ Million)
Figure 54. Saudi Arabia Cutlerys Revenue Growth Rate (2020-2031) & (US$ Million)
Figure 55. UAE Cutlerys Revenue Growth Rate (2020-2031) & (US$ Million)
Figure 56. Global Sales Market Share of Cutlerys by Type (2020-2031)
Figure 57. Global Revenue Market Share of Cutlerys by Type (2020-2031)
Figure 58. Global Cutlerys Price (USD/K Units) by Type (2020-2031)
Figure 59. Global Sales Market Share of Cutlerys by Application (2020-2031)
Figure 60. Global Revenue Market Share of Cutlerys by Application (2020-2031)
Figure 61. Global Cutlerys Price (USD/K Units) by Application (2020-2031)
Figure 62. Cutlerys Value Chain
Figure 63. Channels of Distribution (Direct Vs Distribution)
Figure 64. Bottom-up and Top-down Approaches for This Report
Figure 65. Data Triangulation
Figure 66. Key Executives Interviewed