0
U.S. (TOLL FREE)
+1 (315) 215-3225
Automative

0
U.S. (TOLL FREE)
+1 (315) 215-3225
Global B2B Data Enrichment Services Market Research Report 2025
Published Date: December 2025
|
Report Code: QYRE-Auto-12E20200
Home | Market Reports | Internet & Telecom
Global B2B Data Enrichment Services Market Research Report 2025
BUY CHAPTERS

Global B2B Data Enrichment Services Market Research Report 2025

Code: QYRE-Auto-12E20200
Report
December 2025
Pages:128
QYResearch
Buy Now with 15% Discount
DESCRIPTION
TABLE OF CONTENT
TABLES & FIGURES

B2B Data Enrichment Services Market Size

The global market for B2B Data Enrichment Services was valued at US$ 2276 million in the year 2024 and is projected to reach a revised size of US$ 5524 million by 2031, growing at a CAGR of 13.5% during the forecast period.

B2B Data Enrichment Services Market

B2B Data Enrichment Services Market

B2B Data Enrichment Services are processes and tools used to enhance, refine, and improve raw business-to-business (B2B) data by appending missing information, correcting inaccuracies, and adding valuable context from external sources. The goal is to transform a simple list of company or contact names into a rich, actionable database that drives effective sales, marketing, and strategic decision-making.
North American market for B2B Data Enrichment Services is estimated to increase from $ million in 2024 to reach $ million by 2031, at a CAGR of % during the forecast period of 2025 through 2031.
Asia-Pacific market for B2B Data Enrichment Services is estimated to increase from $ million in 2024 to reach $ million by 2031, at a CAGR of % during the forecast period of 2025 through 2031.
The global market for B2B Data Enrichment Services in Large Enterprises is estimated to increase from $ million in 2024 to $ million by 2031, at a CAGR of % during the forecast period of 2025 through 2031.
The major global companies of B2B Data Enrichment Services include Cognism, Clearbit, ZoomInfo, DemandBase, Lead411, 6sense, Crunchbase, Enrich B2B, Pareto, Captain Data, etc. In 2024, the world's top three vendors accounted for approximately % of the revenue.
This report aims to provide a comprehensive presentation of the global market for B2B Data Enrichment Services, with both quantitative and qualitative analysis, to help readers develop business/growth strategies, assess the market competitive situation, analyze their position in the current marketplace, and make informed business decisions regarding B2B Data Enrichment Services.
The B2B Data Enrichment Services market size, estimations, and forecasts are provided in terms of and revenue ($ millions), considering 2024 as the base year, with history and forecast data for the period from 2020 to 2031. This report segments the global B2B Data Enrichment Services market comprehensively. Regional market sizes, concerning products by Type, by Application, by Method of Data Collection and by players, are also provided.
For a more in-depth understanding of the market, the report provides profiles of the competitive landscape, key competitors, and their respective market ranks. The report also discusses technological trends and new product developments.
The report will help the B2B Data Enrichment Services companies, new entrants, and industry chain related companies in this market with information on the revenues for the overall market and the sub-segments across the different segments, by company, by Type, by Application, and by regions.
Market Segmentation

Scope of B2B Data Enrichment Services Market Report

Report Metric Details
Report Name B2B Data Enrichment Services Market
Accounted market size in year US$ 2276 million
Forecasted market size in 2031 US$ 5524 million
CAGR 13.5%
Base Year year
Forecasted years 2025 - 2031
Segment by Type
  • Firmographic Enrichment Tools
  • Technographic Enrichment Tools
  • Demographic & Hierarchical Enrichment Tools
  • Intent Data & Psychographic Enrichment Tools
  • Financial & News-Based Enrichment Tools
Segment by Method of Data Collection
  • Crawler/Scraper-Based Tools
  • Crowdsourced/Community-Based Tools
  • Licensed & Proprietary Database Tools
  • API-Based Integration Tools
Segment by Pricing & Go-to-Market Model
  • Self-Service / SMB Focused
  • Enterprise / Sales-Led
  • Usage-Based / Credit Model
Segment by Application
  • Large Enterprises
  • SMEs
By Region
  • North America (United States, Canada)
  • Europe (Germany, France, UK, Italy, Russia) Rest of Europe
  • Nordic Countries
  • Asia-Pacific (China, Japan, South Korea)
  • Southeast Asia (India, Australia)
  • Rest of Asia
  • Latin America (Mexico, Brazil)
  • Rest of Latin America
  • Middle East & Africa (Turkey, Saudi Arabia, UAE, Rest of MEA)
By Company Cognism, Clearbit, ZoomInfo, DemandBase, Lead411, 6sense, Crunchbase, Enrich B2B, Pareto, Captain Data, Seamless.AI, Apollo, Snov.io API, InsideView, BeenVerified, Data Axle Genie, Dropcontact, Datagma, FullContact, RingLead, Klenty, Datanyze, LeadGenius, Enricher.io, Leadspace, Pipl, DiscoverOrg, SEON, Experian, Crunchbase Enterprise, MaxMind, BuiltWith, Leadfeeder, Openprise, Global Database
Forecast units USD million in value
Report coverage Revenue and volume forecast, company share, competitive landscape, growth factors and trends

Chapter Outline

  • Chapter 1: Introduces the report scope of the report, executive summary of different market segments (by Type, by Application, by Method of Data Collection etc), including the market size of each market segment, future development potential, and so on. It offers a high-level view of the current state of the market and its likely evolution in the short to mid-term, and long term.
  • Chapter 2: Introduces executive summary of global market size, regional market size, this section also introduces the market dynamics, latest developments of the market, the driving factors and restrictive factors of the market, the challenges and risks faced by companies in the industry, and the analysis of relevant policies in the industry.
  • Chapter 3: Detailed analysis of B2B Data Enrichment Services company competitive landscape, revenue market share, latest development plan, merger, and acquisition information, etc.
  • Chapter 4: Provides the analysis of various market segments by Type, covering the market size and development potential of each market segment, to help readers find the blue ocean market in different market segments.
  • Chapter 5: Provides the analysis of various market segments by Application, covering the market size and development potential of each market segment, to help readers find the blue ocean market in different downstream markets.
  • Chapter 6, 7, 8, 9, 10: North America, Europe, Asia Pacific, Latin America, Middle East and Africa segment by country. It provides a quantitative analysis of the market size and development potential of each region and its main countries and introduces the market development, future development prospects, market space, and capacity of each country in the world.
  • Chapter 11: Provides profiles of key players, introducing the basic situation of the main companies in the market in detail, including product sales, revenue, price, gross margin, product introduction, recent development, etc.
  • Chapter 12: The main points and conclusions of the report.

FAQ for this report

How fast is B2B Data Enrichment Services Market growing?

Ans: The B2B Data Enrichment Services Market witnessing a CAGR of 13.5% during the forecast period 2025-2031.

What is the B2B Data Enrichment Services Market size in 2031?

Ans: The B2B Data Enrichment Services Market size in 2031 will be US$ 5524 million.

Who are the main players in the B2B Data Enrichment Services Market report?

Ans: The main players in the B2B Data Enrichment Services Market are Cognism, Clearbit, ZoomInfo, DemandBase, Lead411, 6sense, Crunchbase, Enrich B2B, Pareto, Captain Data, Seamless.AI, Apollo, Snov.io API, InsideView, BeenVerified, Data Axle Genie, Dropcontact, Datagma, FullContact, RingLead, Klenty, Datanyze, LeadGenius, Enricher.io, Leadspace, Pipl, DiscoverOrg, SEON, Experian, Crunchbase Enterprise, MaxMind, BuiltWith, Leadfeeder, Openprise, Global Database

What are the Application segmentation covered in the B2B Data Enrichment Services Market report?

Ans: The Applications covered in the B2B Data Enrichment Services Market report are Large Enterprises, SMEs

What are the Type segmentation covered in the B2B Data Enrichment Services Market report?

Ans: The Types covered in the B2B Data Enrichment Services Market report are Firmographic Enrichment Tools, Technographic Enrichment Tools, Demographic & Hierarchical Enrichment Tools, Intent Data & Psychographic Enrichment Tools, Financial & News-Based Enrichment Tools

1 Report Overview
1.1 Study Scope
1.2 Market Analysis by Type
1.2.1 Global B2B Data Enrichment Services Market Size Growth Rate by Type: 2020 VS 2024 VS 2031
1.2.2 Firmographic Enrichment Tools
1.2.3 Technographic Enrichment Tools
1.2.4 Demographic & Hierarchical Enrichment Tools
1.2.5 Intent Data & Psychographic Enrichment Tools
1.2.6 Financial & News-Based Enrichment Tools
1.3 Market by Method of Data Collection
1.3.1 Global B2B Data Enrichment Services Market Size Growth Rate by Method of Data Collection: 2020 VS 2024 VS 2031
1.3.2 Crawler/Scraper-Based Tools
1.3.3 Crowdsourced/Community-Based Tools
1.3.4 Licensed & Proprietary Database Tools
1.3.5 API-Based Integration Tools
1.4 Market by Pricing & Go-to-Market Model
1.4.1 Global B2B Data Enrichment Services Market Size Growth Rate by Pricing & Go-to-Market Model: 2020 VS 2024 VS 2031
1.4.2 Self-Service / SMB Focused
1.4.3 Enterprise / Sales-Led
1.4.4 Usage-Based / Credit Model
1.5 Market by Application
1.5.1 Global B2B Data Enrichment Services Market Growth by Application: 2020 VS 2024 VS 2031
1.5.2 Large Enterprises
1.5.3 SMEs
1.6 Assumptions and Limitations
1.7 Study Objectives
1.8 Years Considered
2 Global Growth Trends
2.1 Global B2B Data Enrichment Services Market Perspective (2020-2031)
2.2 Global B2B Data Enrichment Services Growth Trends by Region
2.2.1 Global B2B Data Enrichment Services Market Size by Region: 2020 VS 2024 VS 2031
2.2.2 B2B Data Enrichment Services Historic Market Size by Region (2020-2025)
2.2.3 B2B Data Enrichment Services Forecasted Market Size by Region (2026-2031)
2.3 B2B Data Enrichment Services Market Dynamics
2.3.1 B2B Data Enrichment Services Industry Trends
2.3.2 B2B Data Enrichment Services Market Drivers
2.3.3 B2B Data Enrichment Services Market Challenges
2.3.4 B2B Data Enrichment Services Market Restraints
3 Competition Landscape by Key Players
3.1 Global Top B2B Data Enrichment Services Players by Revenue
3.1.1 Global Top B2B Data Enrichment Services Players by Revenue (2020-2025)
3.1.2 Global B2B Data Enrichment Services Revenue Market Share by Players (2020-2025)
3.2 Global Top B2B Data Enrichment Services Players by Company Type and Market Share by Company Type (Tier 1, Tier 2, and Tier 3)
3.3 Global Key Players Ranking by B2B Data Enrichment Services Revenue
3.4 Global B2B Data Enrichment Services Market Concentration Ratio
3.4.1 Global B2B Data Enrichment Services Market Concentration Ratio (CR5 and HHI)
3.4.2 Global Top 10 and Top 5 Companies by B2B Data Enrichment Services Revenue in 2024
3.5 Global Key Players of B2B Data Enrichment Services Head office and Area Served
3.6 Global Key Players of B2B Data Enrichment Services, Product and Application
3.7 Global Key Players of B2B Data Enrichment Services, Date of Enter into This Industry
3.8 Mergers & Acquisitions, Expansion Plans
4 B2B Data Enrichment Services Breakdown Data by Type
4.1 Global B2B Data Enrichment Services Historic Market Size by Type (2020-2025)
4.2 Global B2B Data Enrichment Services Forecasted Market Size by Type (2026-2031)
5 B2B Data Enrichment Services Breakdown Data by Application
5.1 Global B2B Data Enrichment Services Historic Market Size by Application (2020-2025)
5.2 Global B2B Data Enrichment Services Forecasted Market Size by Application (2026-2031)
6 North America
6.1 North America B2B Data Enrichment Services Market Size (2020-2031)
6.2 North America B2B Data Enrichment Services Market Growth Rate by Country: 2020 VS 2024 VS 2031
6.3 North America B2B Data Enrichment Services Market Size by Country (2020-2025)
6.4 North America B2B Data Enrichment Services Market Size by Country (2026-2031)
6.5 United States
6.6 Canada
7 Europe
7.1 Europe B2B Data Enrichment Services Market Size (2020-2031)
7.2 Europe B2B Data Enrichment Services Market Growth Rate by Country: 2020 VS 2024 VS 2031
7.3 Europe B2B Data Enrichment Services Market Size by Country (2020-2025)
7.4 Europe B2B Data Enrichment Services Market Size by Country (2026-2031)
7.5 Germany
7.6 France
7.7 U.K.
7.8 Italy
7.9 Russia
7.10 Ireland
8 Asia-Pacific
8.1 Asia-Pacific B2B Data Enrichment Services Market Size (2020-2031)
8.2 Asia-Pacific B2B Data Enrichment Services Market Growth Rate by Region: 2020 VS 2024 VS 2031
8.3 Asia-Pacific B2B Data Enrichment Services Market Size by Region (2020-2025)
8.4 Asia-Pacific B2B Data Enrichment Services Market Size by Region (2026-2031)
8.5 China
8.6 Japan
8.7 South Korea
8.8 Southeast Asia
8.9 India
8.10 Australia & New Zealand
9 Latin America
9.1 Latin America B2B Data Enrichment Services Market Size (2020-2031)
9.2 Latin America B2B Data Enrichment Services Market Growth Rate by Country: 2020 VS 2024 VS 2031
9.3 Latin America B2B Data Enrichment Services Market Size by Country (2020-2025)
9.4 Latin America B2B Data Enrichment Services Market Size by Country (2026-2031)
9.5 Mexico
9.6 Brazil
10 Middle East & Africa
10.1 Middle East & Africa B2B Data Enrichment Services Market Size (2020-2031)
10.2 Middle East & Africa B2B Data Enrichment Services Market Growth Rate by Country: 2020 VS 2024 VS 2031
10.3 Middle East & Africa B2B Data Enrichment Services Market Size by Country (2020-2025)
10.4 Middle East & Africa B2B Data Enrichment Services Market Size by Country (2026-2031)
10.5 Israel
10.6 Saudi Arabia
10.7 UAE
11 Key Players Profiles
11.1 Cognism
11.1.1 Cognism Company Details
11.1.2 Cognism Business Overview
11.1.3 Cognism B2B Data Enrichment Services Introduction
11.1.4 Cognism Revenue in B2B Data Enrichment Services Business (2020-2025)
11.1.5 Cognism Recent Development
11.2 Clearbit
11.2.1 Clearbit Company Details
11.2.2 Clearbit Business Overview
11.2.3 Clearbit B2B Data Enrichment Services Introduction
11.2.4 Clearbit Revenue in B2B Data Enrichment Services Business (2020-2025)
11.2.5 Clearbit Recent Development
11.3 ZoomInfo
11.3.1 ZoomInfo Company Details
11.3.2 ZoomInfo Business Overview
11.3.3 ZoomInfo B2B Data Enrichment Services Introduction
11.3.4 ZoomInfo Revenue in B2B Data Enrichment Services Business (2020-2025)
11.3.5 ZoomInfo Recent Development
11.4 DemandBase
11.4.1 DemandBase Company Details
11.4.2 DemandBase Business Overview
11.4.3 DemandBase B2B Data Enrichment Services Introduction
11.4.4 DemandBase Revenue in B2B Data Enrichment Services Business (2020-2025)
11.4.5 DemandBase Recent Development
11.5 Lead411
11.5.1 Lead411 Company Details
11.5.2 Lead411 Business Overview
11.5.3 Lead411 B2B Data Enrichment Services Introduction
11.5.4 Lead411 Revenue in B2B Data Enrichment Services Business (2020-2025)
11.5.5 Lead411 Recent Development
11.6 6sense
11.6.1 6sense Company Details
11.6.2 6sense Business Overview
11.6.3 6sense B2B Data Enrichment Services Introduction
11.6.4 6sense Revenue in B2B Data Enrichment Services Business (2020-2025)
11.6.5 6sense Recent Development
11.7 Crunchbase
11.7.1 Crunchbase Company Details
11.7.2 Crunchbase Business Overview
11.7.3 Crunchbase B2B Data Enrichment Services Introduction
11.7.4 Crunchbase Revenue in B2B Data Enrichment Services Business (2020-2025)
11.7.5 Crunchbase Recent Development
11.8 Enrich B2B
11.8.1 Enrich B2B Company Details
11.8.2 Enrich B2B Business Overview
11.8.3 Enrich B2B B2B Data Enrichment Services Introduction
11.8.4 Enrich B2B Revenue in B2B Data Enrichment Services Business (2020-2025)
11.8.5 Enrich B2B Recent Development
11.9 Pareto
11.9.1 Pareto Company Details
11.9.2 Pareto Business Overview
11.9.3 Pareto B2B Data Enrichment Services Introduction
11.9.4 Pareto Revenue in B2B Data Enrichment Services Business (2020-2025)
11.9.5 Pareto Recent Development
11.10 Captain Data
11.10.1 Captain Data Company Details
11.10.2 Captain Data Business Overview
11.10.3 Captain Data B2B Data Enrichment Services Introduction
11.10.4 Captain Data Revenue in B2B Data Enrichment Services Business (2020-2025)
11.10.5 Captain Data Recent Development
11.11 Seamless.AI
11.11.1 Seamless.AI Company Details
11.11.2 Seamless.AI Business Overview
11.11.3 Seamless.AI B2B Data Enrichment Services Introduction
11.11.4 Seamless.AI Revenue in B2B Data Enrichment Services Business (2020-2025)
11.11.5 Seamless.AI Recent Development
11.12 Apollo
11.12.1 Apollo Company Details
11.12.2 Apollo Business Overview
11.12.3 Apollo B2B Data Enrichment Services Introduction
11.12.4 Apollo Revenue in B2B Data Enrichment Services Business (2020-2025)
11.12.5 Apollo Recent Development
11.13 Snov.io API
11.13.1 Snov.io API Company Details
11.13.2 Snov.io API Business Overview
11.13.3 Snov.io API B2B Data Enrichment Services Introduction
11.13.4 Snov.io API Revenue in B2B Data Enrichment Services Business (2020-2025)
11.13.5 Snov.io API Recent Development
11.14 InsideView
11.14.1 InsideView Company Details
11.14.2 InsideView Business Overview
11.14.3 InsideView B2B Data Enrichment Services Introduction
11.14.4 InsideView Revenue in B2B Data Enrichment Services Business (2020-2025)
11.14.5 InsideView Recent Development
11.15 BeenVerified
11.15.1 BeenVerified Company Details
11.15.2 BeenVerified Business Overview
11.15.3 BeenVerified B2B Data Enrichment Services Introduction
11.15.4 BeenVerified Revenue in B2B Data Enrichment Services Business (2020-2025)
11.15.5 BeenVerified Recent Development
11.16 Data Axle Genie
11.16.1 Data Axle Genie Company Details
11.16.2 Data Axle Genie Business Overview
11.16.3 Data Axle Genie B2B Data Enrichment Services Introduction
11.16.4 Data Axle Genie Revenue in B2B Data Enrichment Services Business (2020-2025)
11.16.5 Data Axle Genie Recent Development
11.17 Dropcontact
11.17.1 Dropcontact Company Details
11.17.2 Dropcontact Business Overview
11.17.3 Dropcontact B2B Data Enrichment Services Introduction
11.17.4 Dropcontact Revenue in B2B Data Enrichment Services Business (2020-2025)
11.17.5 Dropcontact Recent Development
11.18 Datagma
11.18.1 Datagma Company Details
11.18.2 Datagma Business Overview
11.18.3 Datagma B2B Data Enrichment Services Introduction
11.18.4 Datagma Revenue in B2B Data Enrichment Services Business (2020-2025)
11.18.5 Datagma Recent Development
11.19 FullContact
11.19.1 FullContact Company Details
11.19.2 FullContact Business Overview
11.19.3 FullContact B2B Data Enrichment Services Introduction
11.19.4 FullContact Revenue in B2B Data Enrichment Services Business (2020-2025)
11.19.5 FullContact Recent Development
11.20 RingLead
11.20.1 RingLead Company Details
11.20.2 RingLead Business Overview
11.20.3 RingLead B2B Data Enrichment Services Introduction
11.20.4 RingLead Revenue in B2B Data Enrichment Services Business (2020-2025)
11.20.5 RingLead Recent Development
11.21 Klenty
11.21.1 Klenty Company Details
11.21.2 Klenty Business Overview
11.21.3 Klenty B2B Data Enrichment Services Introduction
11.21.4 Klenty Revenue in B2B Data Enrichment Services Business (2020-2025)
11.21.5 Klenty Recent Development
11.22 Datanyze
11.22.1 Datanyze Company Details
11.22.2 Datanyze Business Overview
11.22.3 Datanyze B2B Data Enrichment Services Introduction
11.22.4 Datanyze Revenue in B2B Data Enrichment Services Business (2020-2025)
11.22.5 Datanyze Recent Development
11.23 LeadGenius
11.23.1 LeadGenius Company Details
11.23.2 LeadGenius Business Overview
11.23.3 LeadGenius B2B Data Enrichment Services Introduction
11.23.4 LeadGenius Revenue in B2B Data Enrichment Services Business (2020-2025)
11.23.5 LeadGenius Recent Development
11.24 Enricher.io
11.24.1 Enricher.io Company Details
11.24.2 Enricher.io Business Overview
11.24.3 Enricher.io B2B Data Enrichment Services Introduction
11.24.4 Enricher.io Revenue in B2B Data Enrichment Services Business (2020-2025)
11.24.5 Enricher.io Recent Development
11.25 Leadspace
11.25.1 Leadspace Company Details
11.25.2 Leadspace Business Overview
11.25.3 Leadspace B2B Data Enrichment Services Introduction
11.25.4 Leadspace Revenue in B2B Data Enrichment Services Business (2020-2025)
11.25.5 Leadspace Recent Development
11.26 Pipl
11.26.1 Pipl Company Details
11.26.2 Pipl Business Overview
11.26.3 Pipl B2B Data Enrichment Services Introduction
11.26.4 Pipl Revenue in B2B Data Enrichment Services Business (2020-2025)
11.26.5 Pipl Recent Development
11.27 DiscoverOrg
11.27.1 DiscoverOrg Company Details
11.27.2 DiscoverOrg Business Overview
11.27.3 DiscoverOrg B2B Data Enrichment Services Introduction
11.27.4 DiscoverOrg Revenue in B2B Data Enrichment Services Business (2020-2025)
11.27.5 DiscoverOrg Recent Development
11.28 SEON
11.28.1 SEON Company Details
11.28.2 SEON Business Overview
11.28.3 SEON B2B Data Enrichment Services Introduction
11.28.4 SEON Revenue in B2B Data Enrichment Services Business (2020-2025)
11.28.5 SEON Recent Development
11.29 Experian
11.29.1 Experian Company Details
11.29.2 Experian Business Overview
11.29.3 Experian B2B Data Enrichment Services Introduction
11.29.4 Experian Revenue in B2B Data Enrichment Services Business (2020-2025)
11.29.5 Experian Recent Development
11.30 Crunchbase Enterprise
11.30.1 Crunchbase Enterprise Company Details
11.30.2 Crunchbase Enterprise Business Overview
11.30.3 Crunchbase Enterprise B2B Data Enrichment Services Introduction
11.30.4 Crunchbase Enterprise Revenue in B2B Data Enrichment Services Business (2020-2025)
11.30.5 Crunchbase Enterprise Recent Development
11.31 MaxMind
11.31.1 MaxMind Company Details
11.31.2 MaxMind Business Overview
11.31.3 MaxMind B2B Data Enrichment Services Introduction
11.31.4 MaxMind Revenue in B2B Data Enrichment Services Business (2020-2025)
11.31.5 MaxMind Recent Development
11.32 BuiltWith
11.32.1 BuiltWith Company Details
11.32.2 BuiltWith Business Overview
11.32.3 BuiltWith B2B Data Enrichment Services Introduction
11.32.4 BuiltWith Revenue in B2B Data Enrichment Services Business (2020-2025)
11.32.5 BuiltWith Recent Development
11.33 Leadfeeder
11.33.1 Leadfeeder Company Details
11.33.2 Leadfeeder Business Overview
11.33.3 Leadfeeder B2B Data Enrichment Services Introduction
11.33.4 Leadfeeder Revenue in B2B Data Enrichment Services Business (2020-2025)
11.33.5 Leadfeeder Recent Development
11.34 Openprise
11.34.1 Openprise Company Details
11.34.2 Openprise Business Overview
11.34.3 Openprise B2B Data Enrichment Services Introduction
11.34.4 Openprise Revenue in B2B Data Enrichment Services Business (2020-2025)
11.34.5 Openprise Recent Development
11.35 Global Database
11.35.1 Global Database Company Details
11.35.2 Global Database Business Overview
11.35.3 Global Database B2B Data Enrichment Services Introduction
11.35.4 Global Database Revenue in B2B Data Enrichment Services Business (2020-2025)
11.35.5 Global Database Recent Development
12 Analyst's Viewpoints/Conclusions
13 Appendix
13.1 Research Methodology
13.1.1 Methodology/Research Approach
13.1.1.1 Research Programs/Design
13.1.1.2 Market Size Estimation
13.1.1.3 Market Breakdown and Data Triangulation
13.1.2 Data Source
13.1.2.1 Secondary Sources
13.1.2.2 Primary Sources
13.2 Author Details
13.3 Disclaimer
List of Tables
 Table 1. Global B2B Data Enrichment Services Market Size Growth Rate by Type (US$ Million): 2020 VS 2024 VS 2031
 Table 2. Key Players of Firmographic Enrichment Tools
 Table 3. Key Players of Technographic Enrichment Tools
 Table 4. Key Players of Demographic & Hierarchical Enrichment Tools
 Table 5. Key Players of Intent Data & Psychographic Enrichment Tools
 Table 6. Key Players of Financial & News-Based Enrichment Tools
 Table 7. Global B2B Data Enrichment Services Market Size Growth Rate by Method of Data Collection (US$ Million): 2020 VS 2024 VS 2031
 Table 8. Key Players of Crawler/Scraper-Based Tools
 Table 9. Key Players of Crowdsourced/Community-Based Tools
 Table 10. Key Players of Licensed & Proprietary Database Tools
 Table 11. Key Players of API-Based Integration Tools
 Table 12. Global B2B Data Enrichment Services Market Size Growth Rate by Pricing & Go-to-Market Model (US$ Million): 2020 VS 2024 VS 2031
 Table 13. Key Players of Self-Service / SMB Focused
 Table 14. Key Players of Enterprise / Sales-Led
 Table 15. Key Players of Usage-Based / Credit Model
 Table 16. Global B2B Data Enrichment Services Market Size Growth by Application (US$ Million): 2020 VS 2024 VS 2031
 Table 17. Global B2B Data Enrichment Services Market Size by Region (US$ Million): 2020 VS 2024 VS 2031
 Table 18. Global B2B Data Enrichment Services Market Size by Region (2020-2025) & (US$ Million)
 Table 19. Global B2B Data Enrichment Services Market Share by Region (2020-2025)
 Table 20. Global B2B Data Enrichment Services Forecasted Market Size by Region (2026-2031) & (US$ Million)
 Table 21. Global B2B Data Enrichment Services Market Share by Region (2026-2031)
 Table 22. B2B Data Enrichment Services Market Trends
 Table 23. B2B Data Enrichment Services Market Drivers
 Table 24. B2B Data Enrichment Services Market Challenges
 Table 25. B2B Data Enrichment Services Market Restraints
 Table 26. Global B2B Data Enrichment Services Revenue by Players (2020-2025) & (US$ Million)
 Table 27. Global B2B Data Enrichment Services Market Share by Players (2020-2025)
 Table 28. Global Top B2B Data Enrichment Services Players by Company Type (Tier 1, Tier 2, and Tier 3) & (based on the Revenue in B2B Data Enrichment Services as of 2024)
 Table 29. Ranking of Global Top B2B Data Enrichment Services Companies by Revenue (US$ Million) in 2024
 Table 30. Global 5 Largest Players Market Share by B2B Data Enrichment Services Revenue (CR5 and HHI) & (2020-2025)
 Table 31. Global Key Players of B2B Data Enrichment Services, Headquarters and Area Served
 Table 32. Global Key Players of B2B Data Enrichment Services, Product and Application
 Table 33. Global Key Players of B2B Data Enrichment Services, Date of Enter into This Industry
 Table 34. Mergers & Acquisitions, Expansion Plans
 Table 35. Global B2B Data Enrichment Services Market Size by Type (2020-2025) & (US$ Million)
 Table 36. Global B2B Data Enrichment Services Revenue Market Share by Type (2020-2025)
 Table 37. Global B2B Data Enrichment Services Forecasted Market Size by Type (2026-2031) & (US$ Million)
 Table 38. Global B2B Data Enrichment Services Revenue Market Share by Type (2026-2031)
 Table 39. Global B2B Data Enrichment Services Market Size by Application (2020-2025) & (US$ Million)
 Table 40. Global B2B Data Enrichment Services Revenue Market Share by Application (2020-2025)
 Table 41. Global B2B Data Enrichment Services Forecasted Market Size by Application (2026-2031) & (US$ Million)
 Table 42. Global B2B Data Enrichment Services Revenue Market Share by Application (2026-2031)
 Table 43. North America B2B Data Enrichment Services Market Size Growth Rate by Country (US$ Million): 2020 VS 2024 VS 2031
 Table 44. North America B2B Data Enrichment Services Market Size by Country (2020-2025) & (US$ Million)
 Table 45. North America B2B Data Enrichment Services Market Size by Country (2026-2031) & (US$ Million)
 Table 46. Europe B2B Data Enrichment Services Market Size Growth Rate by Country (US$ Million): 2020 VS 2024 VS 2031
 Table 47. Europe B2B Data Enrichment Services Market Size by Country (2020-2025) & (US$ Million)
 Table 48. Europe B2B Data Enrichment Services Market Size by Country (2026-2031) & (US$ Million)
 Table 49. Asia-Pacific B2B Data Enrichment Services Market Size Growth Rate by Region (US$ Million): 2020 VS 2024 VS 2031
 Table 50. Asia-Pacific B2B Data Enrichment Services Market Size by Region (2020-2025) & (US$ Million)
 Table 51. Asia-Pacific B2B Data Enrichment Services Market Size by Region (2026-2031) & (US$ Million)
 Table 52. Latin America B2B Data Enrichment Services Market Size Growth Rate by Country (US$ Million): 2020 VS 2024 VS 2031
 Table 53. Latin America B2B Data Enrichment Services Market Size by Country (2020-2025) & (US$ Million)
 Table 54. Latin America B2B Data Enrichment Services Market Size by Country (2026-2031) & (US$ Million)
 Table 55. Middle East & Africa B2B Data Enrichment Services Market Size Growth Rate by Country (US$ Million): 2020 VS 2024 VS 2031
 Table 56. Middle East & Africa B2B Data Enrichment Services Market Size by Country (2020-2025) & (US$ Million)
 Table 57. Middle East & Africa B2B Data Enrichment Services Market Size by Country (2026-2031) & (US$ Million)
 Table 58. Cognism Company Details
 Table 59. Cognism Business Overview
 Table 60. Cognism B2B Data Enrichment Services Product
 Table 61. Cognism Revenue in B2B Data Enrichment Services Business (2020-2025) & (US$ Million)
 Table 62. Cognism Recent Development
 Table 63. Clearbit Company Details
 Table 64. Clearbit Business Overview
 Table 65. Clearbit B2B Data Enrichment Services Product
 Table 66. Clearbit Revenue in B2B Data Enrichment Services Business (2020-2025) & (US$ Million)
 Table 67. Clearbit Recent Development
 Table 68. ZoomInfo Company Details
 Table 69. ZoomInfo Business Overview
 Table 70. ZoomInfo B2B Data Enrichment Services Product
 Table 71. ZoomInfo Revenue in B2B Data Enrichment Services Business (2020-2025) & (US$ Million)
 Table 72. ZoomInfo Recent Development
 Table 73. DemandBase Company Details
 Table 74. DemandBase Business Overview
 Table 75. DemandBase B2B Data Enrichment Services Product
 Table 76. DemandBase Revenue in B2B Data Enrichment Services Business (2020-2025) & (US$ Million)
 Table 77. DemandBase Recent Development
 Table 78. Lead411 Company Details
 Table 79. Lead411 Business Overview
 Table 80. Lead411 B2B Data Enrichment Services Product
 Table 81. Lead411 Revenue in B2B Data Enrichment Services Business (2020-2025) & (US$ Million)
 Table 82. Lead411 Recent Development
 Table 83. 6sense Company Details
 Table 84. 6sense Business Overview
 Table 85. 6sense B2B Data Enrichment Services Product
 Table 86. 6sense Revenue in B2B Data Enrichment Services Business (2020-2025) & (US$ Million)
 Table 87. 6sense Recent Development
 Table 88. Crunchbase Company Details
 Table 89. Crunchbase Business Overview
 Table 90. Crunchbase B2B Data Enrichment Services Product
 Table 91. Crunchbase Revenue in B2B Data Enrichment Services Business (2020-2025) & (US$ Million)
 Table 92. Crunchbase Recent Development
 Table 93. Enrich B2B Company Details
 Table 94. Enrich B2B Business Overview
 Table 95. Enrich B2B B2B Data Enrichment Services Product
 Table 96. Enrich B2B Revenue in B2B Data Enrichment Services Business (2020-2025) & (US$ Million)
 Table 97. Enrich B2B Recent Development
 Table 98. Pareto Company Details
 Table 99. Pareto Business Overview
 Table 100. Pareto B2B Data Enrichment Services Product
 Table 101. Pareto Revenue in B2B Data Enrichment Services Business (2020-2025) & (US$ Million)
 Table 102. Pareto Recent Development
 Table 103. Captain Data Company Details
 Table 104. Captain Data Business Overview
 Table 105. Captain Data B2B Data Enrichment Services Product
 Table 106. Captain Data Revenue in B2B Data Enrichment Services Business (2020-2025) & (US$ Million)
 Table 107. Captain Data Recent Development
 Table 108. Seamless.AI Company Details
 Table 109. Seamless.AI Business Overview
 Table 110. Seamless.AI B2B Data Enrichment Services Product
 Table 111. Seamless.AI Revenue in B2B Data Enrichment Services Business (2020-2025) & (US$ Million)
 Table 112. Seamless.AI Recent Development
 Table 113. Apollo Company Details
 Table 114. Apollo Business Overview
 Table 115. Apollo B2B Data Enrichment Services Product
 Table 116. Apollo Revenue in B2B Data Enrichment Services Business (2020-2025) & (US$ Million)
 Table 117. Apollo Recent Development
 Table 118. Snov.io API Company Details
 Table 119. Snov.io API Business Overview
 Table 120. Snov.io API B2B Data Enrichment Services Product
 Table 121. Snov.io API Revenue in B2B Data Enrichment Services Business (2020-2025) & (US$ Million)
 Table 122. Snov.io API Recent Development
 Table 123. InsideView Company Details
 Table 124. InsideView Business Overview
 Table 125. InsideView B2B Data Enrichment Services Product
 Table 126. InsideView Revenue in B2B Data Enrichment Services Business (2020-2025) & (US$ Million)
 Table 127. InsideView Recent Development
 Table 128. BeenVerified Company Details
 Table 129. BeenVerified Business Overview
 Table 130. BeenVerified B2B Data Enrichment Services Product
 Table 131. BeenVerified Revenue in B2B Data Enrichment Services Business (2020-2025) & (US$ Million)
 Table 132. BeenVerified Recent Development
 Table 133. Data Axle Genie Company Details
 Table 134. Data Axle Genie Business Overview
 Table 135. Data Axle Genie B2B Data Enrichment Services Product
 Table 136. Data Axle Genie Revenue in B2B Data Enrichment Services Business (2020-2025) & (US$ Million)
 Table 137. Data Axle Genie Recent Development
 Table 138. Dropcontact Company Details
 Table 139. Dropcontact Business Overview
 Table 140. Dropcontact B2B Data Enrichment Services Product
 Table 141. Dropcontact Revenue in B2B Data Enrichment Services Business (2020-2025) & (US$ Million)
 Table 142. Dropcontact Recent Development
 Table 143. Datagma Company Details
 Table 144. Datagma Business Overview
 Table 145. Datagma B2B Data Enrichment Services Product
 Table 146. Datagma Revenue in B2B Data Enrichment Services Business (2020-2025) & (US$ Million)
 Table 147. Datagma Recent Development
 Table 148. FullContact Company Details
 Table 149. FullContact Business Overview
 Table 150. FullContact B2B Data Enrichment Services Product
 Table 151. FullContact Revenue in B2B Data Enrichment Services Business (2020-2025) & (US$ Million)
 Table 152. FullContact Recent Development
 Table 153. RingLead Company Details
 Table 154. RingLead Business Overview
 Table 155. RingLead B2B Data Enrichment Services Product
 Table 156. RingLead Revenue in B2B Data Enrichment Services Business (2020-2025) & (US$ Million)
 Table 157. RingLead Recent Development
 Table 158. Klenty Company Details
 Table 159. Klenty Business Overview
 Table 160. Klenty B2B Data Enrichment Services Product
 Table 161. Klenty Revenue in B2B Data Enrichment Services Business (2020-2025) & (US$ Million)
 Table 162. Klenty Recent Development
 Table 163. Datanyze Company Details
 Table 164. Datanyze Business Overview
 Table 165. Datanyze B2B Data Enrichment Services Product
 Table 166. Datanyze Revenue in B2B Data Enrichment Services Business (2020-2025) & (US$ Million)
 Table 167. Datanyze Recent Development
 Table 168. LeadGenius Company Details
 Table 169. LeadGenius Business Overview
 Table 170. LeadGenius B2B Data Enrichment Services Product
 Table 171. LeadGenius Revenue in B2B Data Enrichment Services Business (2020-2025) & (US$ Million)
 Table 172. LeadGenius Recent Development
 Table 173. Enricher.io Company Details
 Table 174. Enricher.io Business Overview
 Table 175. Enricher.io B2B Data Enrichment Services Product
 Table 176. Enricher.io Revenue in B2B Data Enrichment Services Business (2020-2025) & (US$ Million)
 Table 177. Enricher.io Recent Development
 Table 178. Leadspace Company Details
 Table 179. Leadspace Business Overview
 Table 180. Leadspace B2B Data Enrichment Services Product
 Table 181. Leadspace Revenue in B2B Data Enrichment Services Business (2020-2025) & (US$ Million)
 Table 182. Leadspace Recent Development
 Table 183. Pipl Company Details
 Table 184. Pipl Business Overview
 Table 185. Pipl B2B Data Enrichment Services Product
 Table 186. Pipl Revenue in B2B Data Enrichment Services Business (2020-2025) & (US$ Million)
 Table 187. Pipl Recent Development
 Table 188. DiscoverOrg Company Details
 Table 189. DiscoverOrg Business Overview
 Table 190. DiscoverOrg B2B Data Enrichment Services Product
 Table 191. DiscoverOrg Revenue in B2B Data Enrichment Services Business (2020-2025) & (US$ Million)
 Table 192. DiscoverOrg Recent Development
 Table 193. SEON Company Details
 Table 194. SEON Business Overview
 Table 195. SEON B2B Data Enrichment Services Product
 Table 196. SEON Revenue in B2B Data Enrichment Services Business (2020-2025) & (US$ Million)
 Table 197. SEON Recent Development
 Table 198. Experian Company Details
 Table 199. Experian Business Overview
 Table 200. Experian B2B Data Enrichment Services Product
 Table 201. Experian Revenue in B2B Data Enrichment Services Business (2020-2025) & (US$ Million)
 Table 202. Experian Recent Development
 Table 203. Crunchbase Enterprise Company Details
 Table 204. Crunchbase Enterprise Business Overview
 Table 205. Crunchbase Enterprise B2B Data Enrichment Services Product
 Table 206. Crunchbase Enterprise Revenue in B2B Data Enrichment Services Business (2020-2025) & (US$ Million)
 Table 207. Crunchbase Enterprise Recent Development
 Table 208. MaxMind Company Details
 Table 209. MaxMind Business Overview
 Table 210. MaxMind B2B Data Enrichment Services Product
 Table 211. MaxMind Revenue in B2B Data Enrichment Services Business (2020-2025) & (US$ Million)
 Table 212. MaxMind Recent Development
 Table 213. BuiltWith Company Details
 Table 214. BuiltWith Business Overview
 Table 215. BuiltWith B2B Data Enrichment Services Product
 Table 216. BuiltWith Revenue in B2B Data Enrichment Services Business (2020-2025) & (US$ Million)
 Table 217. BuiltWith Recent Development
 Table 218. Leadfeeder Company Details
 Table 219. Leadfeeder Business Overview
 Table 220. Leadfeeder B2B Data Enrichment Services Product
 Table 221. Leadfeeder Revenue in B2B Data Enrichment Services Business (2020-2025) & (US$ Million)
 Table 222. Leadfeeder Recent Development
 Table 223. Openprise Company Details
 Table 224. Openprise Business Overview
 Table 225. Openprise B2B Data Enrichment Services Product
 Table 226. Openprise Revenue in B2B Data Enrichment Services Business (2020-2025) & (US$ Million)
 Table 227. Openprise Recent Development
 Table 228. Global Database Company Details
 Table 229. Global Database Business Overview
 Table 230. Global Database B2B Data Enrichment Services Product
 Table 231. Global Database Revenue in B2B Data Enrichment Services Business (2020-2025) & (US$ Million)
 Table 232. Global Database Recent Development
 Table 233. Research Programs/Design for This Report
 Table 234. Key Data Information from Secondary Sources
 Table 235. Key Data Information from Primary Sources
 Table 236. Authors List of This Report


List of Figures
 Figure 1. B2B Data Enrichment Services Picture
 Figure 2. Global B2B Data Enrichment Services Market Size Comparison by Type (2020-2031) & (US$ Million)
 Figure 3. Global B2B Data Enrichment Services Market Share by Type: 2024 VS 2031
 Figure 4. Firmographic Enrichment Tools Features
 Figure 5. Technographic Enrichment Tools Features
 Figure 6. Demographic & Hierarchical Enrichment Tools Features
 Figure 7. Intent Data & Psychographic Enrichment Tools Features
 Figure 8. Financial & News-Based Enrichment Tools Features
 Figure 9. Global B2B Data Enrichment Services Market Size Comparison by Method of Data Collection (2020-2031) & (US$ Million)
 Figure 10. Crawler/Scraper-Based Tools Features
 Figure 11. Crowdsourced/Community-Based Tools Features
 Figure 12. Licensed & Proprietary Database Tools Features
 Figure 13. API-Based Integration Tools Features
 Figure 14. Global B2B Data Enrichment Services Market Size Comparison by Pricing & Go-to-Market Model (2020-2031) & (US$ Million)
 Figure 15. Self-Service / SMB Focused Features
 Figure 16. Enterprise / Sales-Led Features
 Figure 17. Usage-Based / Credit Model Features
 Figure 18. Global B2B Data Enrichment Services Market Size by Application (2020-2031) & (US$ Million)
 Figure 19. Global B2B Data Enrichment Services Market Share by Application: 2024 VS 2031
 Figure 20. Large Enterprises Case Studies
 Figure 21. SMEs Case Studies
 Figure 22. B2B Data Enrichment Services Report Years Considered
 Figure 23. Global B2B Data Enrichment Services Market Size (US$ Million), Year-over-Year: 2020-2031
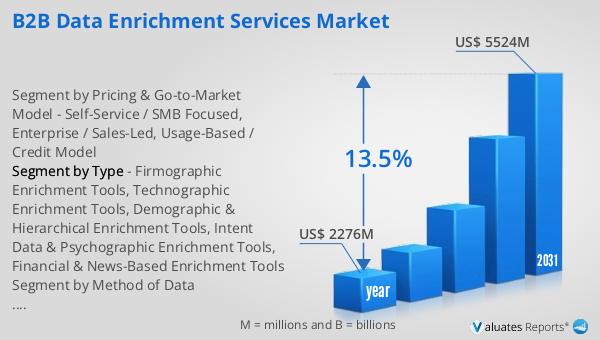
 Figure 24. Global B2B Data Enrichment Services Market Size, (US$ Million), 2020 VS 2024 VS 2031
 Figure 25. Global B2B Data Enrichment Services Market Share by Region: 2024 VS 2031
 Figure 26. Global B2B Data Enrichment Services Market Share by Players in 2024
 Figure 27. Global B2B Data Enrichment Services Market Share by Company Type (Tier 1, Tier 2, and Tier 3)
 Figure 28. The Top 10 and 5 Players Market Share by B2B Data Enrichment Services Revenue in 2024
 Figure 29. North America B2B Data Enrichment Services Market Size YoY Growth (2020-2031) & (US$ Million)
 Figure 30. North America B2B Data Enrichment Services Market Share by Country (2020-2031)
 Figure 31. United States B2B Data Enrichment Services Market Size YoY Growth (2020-2031) & (US$ Million)
 Figure 32. Canada B2B Data Enrichment Services Market Size YoY Growth (2020-2031) & (US$ Million)
 Figure 33. Europe B2B Data Enrichment Services Market Size YoY Growth (2020-2031) & (US$ Million)
 Figure 34. Europe B2B Data Enrichment Services Market Share by Country (2020-2031)
 Figure 35. Germany B2B Data Enrichment Services Market Size YoY Growth (2020-2031) & (US$ Million)
 Figure 36. France B2B Data Enrichment Services Market Size YoY Growth (2020-2031) & (US$ Million)
 Figure 37. U.K. B2B Data Enrichment Services Market Size YoY Growth (2020-2031) & (US$ Million)
 Figure 38. Italy B2B Data Enrichment Services Market Size YoY Growth (2020-2031) & (US$ Million)
 Figure 39. Russia B2B Data Enrichment Services Market Size YoY Growth (2020-2031) & (US$ Million)
 Figure 40. Ireland B2B Data Enrichment Services Market Size YoY Growth (2020-2031) & (US$ Million)
 Figure 41. Asia-Pacific B2B Data Enrichment Services Market Size YoY Growth (2020-2031) & (US$ Million)
 Figure 42. Asia-Pacific B2B Data Enrichment Services Market Share by Region (2020-2031)
 Figure 43. China B2B Data Enrichment Services Market Size YoY Growth (2020-2031) & (US$ Million)
 Figure 44. Japan B2B Data Enrichment Services Market Size YoY Growth (2020-2031) & (US$ Million)
 Figure 45. South Korea B2B Data Enrichment Services Market Size YoY Growth (2020-2031) & (US$ Million)
 Figure 46. Southeast Asia B2B Data Enrichment Services Market Size YoY Growth (2020-2031) & (US$ Million)
 Figure 47. India B2B Data Enrichment Services Market Size YoY Growth (2020-2031) & (US$ Million)
 Figure 48. Australia & New Zealand B2B Data Enrichment Services Market Size YoY Growth (2020-2031) & (US$ Million)
 Figure 49. Latin America B2B Data Enrichment Services Market Size YoY Growth (2020-2031) & (US$ Million)
 Figure 50. Latin America B2B Data Enrichment Services Market Share by Country (2020-2031)
 Figure 51. Mexico B2B Data Enrichment Services Market Size YoY Growth (2020-2031) & (US$ Million)
 Figure 52. Brazil B2B Data Enrichment Services Market Size YoY Growth (2020-2031) & (US$ Million)
 Figure 53. Middle East & Africa B2B Data Enrichment Services Market Size YoY Growth (2020-2031) & (US$ Million)
 Figure 54. Middle East & Africa B2B Data Enrichment Services Market Share by Country (2020-2031)
 Figure 55. Israel B2B Data Enrichment Services Market Size YoY Growth (2020-2031) & (US$ Million)
 Figure 56. Saudi Arabia B2B Data Enrichment Services Market Size YoY Growth (2020-2031) & (US$ Million)
 Figure 57. UAE B2B Data Enrichment Services Market Size YoY Growth (2020-2031) & (US$ Million)
 Figure 58. Cognism Revenue Growth Rate in B2B Data Enrichment Services Business (2020-2025)
 Figure 59. Clearbit Revenue Growth Rate in B2B Data Enrichment Services Business (2020-2025)
 Figure 60. ZoomInfo Revenue Growth Rate in B2B Data Enrichment Services Business (2020-2025)
 Figure 61. DemandBase Revenue Growth Rate in B2B Data Enrichment Services Business (2020-2025)
 Figure 62. Lead411 Revenue Growth Rate in B2B Data Enrichment Services Business (2020-2025)
 Figure 63. 6sense Revenue Growth Rate in B2B Data Enrichment Services Business (2020-2025)
 Figure 64. Crunchbase Revenue Growth Rate in B2B Data Enrichment Services Business (2020-2025)
 Figure 65. Enrich B2B Revenue Growth Rate in B2B Data Enrichment Services Business (2020-2025)
 Figure 66. Pareto Revenue Growth Rate in B2B Data Enrichment Services Business (2020-2025)
 Figure 67. Captain Data Revenue Growth Rate in B2B Data Enrichment Services Business (2020-2025)
 Figure 68. Seamless.AI Revenue Growth Rate in B2B Data Enrichment Services Business (2020-2025)
 Figure 69. Apollo Revenue Growth Rate in B2B Data Enrichment Services Business (2020-2025)
 Figure 70. Snov.io API Revenue Growth Rate in B2B Data Enrichment Services Business (2020-2025)
 Figure 71. InsideView Revenue Growth Rate in B2B Data Enrichment Services Business (2020-2025)
 Figure 72. BeenVerified Revenue Growth Rate in B2B Data Enrichment Services Business (2020-2025)
 Figure 73. Data Axle Genie Revenue Growth Rate in B2B Data Enrichment Services Business (2020-2025)
 Figure 74. Dropcontact Revenue Growth Rate in B2B Data Enrichment Services Business (2020-2025)
 Figure 75. Datagma Revenue Growth Rate in B2B Data Enrichment Services Business (2020-2025)
 Figure 76. FullContact Revenue Growth Rate in B2B Data Enrichment Services Business (2020-2025)
 Figure 77. RingLead Revenue Growth Rate in B2B Data Enrichment Services Business (2020-2025)
 Figure 78. Klenty Revenue Growth Rate in B2B Data Enrichment Services Business (2020-2025)
 Figure 79. Datanyze Revenue Growth Rate in B2B Data Enrichment Services Business (2020-2025)
 Figure 80. LeadGenius Revenue Growth Rate in B2B Data Enrichment Services Business (2020-2025)
 Figure 81. Enricher.io Revenue Growth Rate in B2B Data Enrichment Services Business (2020-2025)
 Figure 82. Leadspace Revenue Growth Rate in B2B Data Enrichment Services Business (2020-2025)
 Figure 83. Pipl Revenue Growth Rate in B2B Data Enrichment Services Business (2020-2025)
 Figure 84. DiscoverOrg Revenue Growth Rate in B2B Data Enrichment Services Business (2020-2025)
 Figure 85. SEON Revenue Growth Rate in B2B Data Enrichment Services Business (2020-2025)
 Figure 86. Experian Revenue Growth Rate in B2B Data Enrichment Services Business (2020-2025)
 Figure 87. Crunchbase Enterprise Revenue Growth Rate in B2B Data Enrichment Services Business (2020-2025)
 Figure 88. MaxMind Revenue Growth Rate in B2B Data Enrichment Services Business (2020-2025)
 Figure 89. BuiltWith Revenue Growth Rate in B2B Data Enrichment Services Business (2020-2025)
 Figure 90. Leadfeeder Revenue Growth Rate in B2B Data Enrichment Services Business (2020-2025)
 Figure 91. Openprise Revenue Growth Rate in B2B Data Enrichment Services Business (2020-2025)
 Figure 92. Global Database Revenue Growth Rate in B2B Data Enrichment Services Business (2020-2025)
 Figure 93. Bottom-up and Top-down Approaches for This Report
 Figure 94. Data Triangulation
 Figure 95. Key Executives Interviewed
SELECT A FORMAT
Added to Cart
Electronic (PDF)

$2900

This license allows only one user to access the PDF.
Electronic (PDF)

$4350

This license allows 1 - 5 user to access the PDF, license is suitable for small groups of 5 users working together
Electronic (PDF)

$5800

This license allows users/teams in a same Enterprise to use this report, various departments within an enterpise can use this report
Add to Cart
Buy Now (15% Discount)

OUR CUSTOMER

Bioinformatics Barcelona

SIMILAR REPORTS


RELATED REPORTS

Global WiFi 6 Devices Market Research Report 2025

120 Pages
Type: Report
Code: QYRE-Auto-27M19831
Wed Dec 03 00:00:00 UTC 2025

Add to Cart

Global Ultra Wideband RF Mixer Die Market Research Report 2025

120 Pages
Type: Report
Code: QYRE-Auto-5U20123
Wed Dec 03 00:00:00 UTC 2025

Add to Cart

Global Mobile Game Network Optimization Tools Market Research Report 2025

120 Pages
Type: Report
Code: QYRE-Auto-33W18146
Tue Dec 02 00:00:00 UTC 2025

Add to Cart

Global Virtual Voicemail Market Research Report 2025

120 Pages
Type: Report
Code: QYRE-Auto-12E18239
Tue Dec 02 00:00:00 UTC 2025

Add to Cart