1 Market Overview
1.1 Antimicrobial Plastic Additives Product Introduction
1.2 Global Antimicrobial Plastic Additives Market Size Forecast
1.2.1 Global Antimicrobial Plastic Additives Sales Value (2021–2032)
1.2.2 Global Antimicrobial Plastic Additives Sales Volume (2021–2032)
1.2.3 Global Antimicrobial Plastic Additives Sales Price (2021–2032)
1.3 Antimicrobial Plastic Additives Market Trends & Drivers
1.3.1 Antimicrobial Plastic Additives Industry Trends
1.3.2 Antimicrobial Plastic Additives Market Drivers & Opportunities
1.3.3 Antimicrobial Plastic Additives Market Challenges
1.3.4 Antimicrobial Plastic Additives Market Restraints
1.3.5 Impact of U.S. Tariffs
1.4 Assumptions and Limitations
1.5 Study Objectives
1.6 Years Considered
2 Competitive Analysis by Company
2.1 Global Antimicrobial Plastic Additives Players Revenue Ranking (2025)
2.2 Global Antimicrobial Plastic Additives Revenue by Company (2021–2026)
2.3 Global Antimicrobial Plastic Additives Sales Volume Ranking of Players (2025)
2.4 Global Antimicrobial Plastic Additives Sales Volume by Company (2021–2026)
2.5 Global Antimicrobial Plastic Additives Average Price by Company (2021–2026)
2.6 Key Manufacturers Antimicrobial Plastic Additives Manufacturing Base and Headquarters
2.7 Key Manufacturers Antimicrobial Plastic Additives Product Offerings
2.8 Key Manufacturers Start of Mass Production of Antimicrobial Plastic Additives
2.9 Antimicrobial Plastic Additives Market Competitive Analysis
2.9.1 Antimicrobial Plastic Additives Market Concentration Rate (2021–2026)
2.9.2 Global 5 and 10 Largest Manufacturers by Antimicrobial Plastic Additives Revenue in 2025
2.9.3 Global Companies by Tier (Tier 1, Tier 2, Tier 3), based on Antimicrobial Plastic Additives revenue, 2025
2.10 Mergers & Acquisitions and Expansion
3 Segmentation Antimicrobial Plastic Additives Market Classification
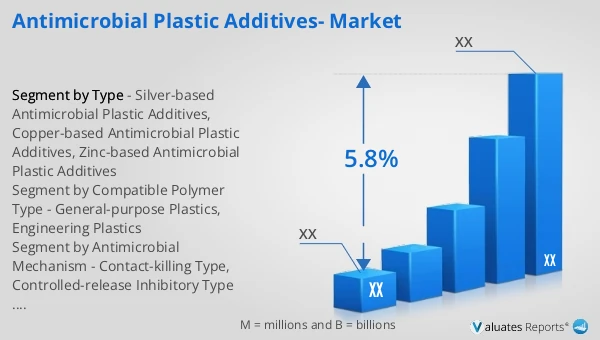
3.1 Introduction by Type
3.1.1 Silver-based Antimicrobial Plastic Additives
3.1.2 Copper-based Antimicrobial Plastic Additives
3.1.3 Zinc-based Antimicrobial Plastic Additives
3.1.4 Global Antimicrobial Plastic Additives Sales Value by Type
3.1.4.1 Global Antimicrobial Plastic Additives Sales Value by Type (2021 vs 2025 vs 2032)
3.1.4.2 Global Antimicrobial Plastic Additives Sales Value, by Type (2021–2032)
3.1.4.3 Global Antimicrobial Plastic Additives Sales Value, by Type (%), 2021–2032
3.1.5 Global Antimicrobial Plastic Additives Sales Volume by Type
3.1.5.1 Global Antimicrobial Plastic Additives Sales Volume by Type (2021 vs 2025 vs 2032)
3.1.5.2 Global Antimicrobial Plastic Additives Sales Volume, by Type (2021–2032)
3.1.5.3 Global Antimicrobial Plastic Additives Sales Volume, by Type (%), 2021–2032
3.1.6 Global Antimicrobial Plastic Additives Average Price by Type (2021–2032)
3.2 Introduction by Antimicrobial Ingredient Type
3.2.1 Inorganic Antimicrobial Additives
3.2.2 Organic Antimicrobial Additives
3.2.3 Global Antimicrobial Plastic Additives Sales Value by Antimicrobial Ingredient Type
3.2.3.1 Global Antimicrobial Plastic Additives Sales Value by Antimicrobial Ingredient Type (2021 vs 2025 vs 2032)
3.2.3.2 Global Antimicrobial Plastic Additives Sales Value, by Antimicrobial Ingredient Type (2021–2032)
3.2.3.3 Global Antimicrobial Plastic Additives Sales Value, by Antimicrobial Ingredient Type (%), 2021–2032
3.2.4 Global Antimicrobial Plastic Additives Sales Volume by Antimicrobial Ingredient Type
3.2.4.1 Global Antimicrobial Plastic Additives Sales Volume by Antimicrobial Ingredient Type (2021 vs 2025 vs 2032)
3.2.4.2 Global Antimicrobial Plastic Additives Sales Volume, by Antimicrobial Ingredient Type (2021–2032)
3.2.4.3 Global Antimicrobial Plastic Additives Sales Volume, by Antimicrobial Ingredient Type (%), 2021–2032
3.2.5 Global Antimicrobial Plastic Additives Average Price by Antimicrobial Ingredient Type (2021–2032)
3.3 Introduction by Antimicrobial Mechanism
3.3.1 Contact-killing Type
3.3.2 Controlled-release Inhibitory Type
3.3.3 Global Antimicrobial Plastic Additives Sales Value by Antimicrobial Mechanism
3.3.3.1 Global Antimicrobial Plastic Additives Sales Value by Antimicrobial Mechanism (2021 vs 2025 vs 2032)
3.3.3.2 Global Antimicrobial Plastic Additives Sales Value, by Antimicrobial Mechanism (2021–2032)
3.3.3.3 Global Antimicrobial Plastic Additives Sales Value, by Antimicrobial Mechanism (%), 2021–2032
3.3.4 Global Antimicrobial Plastic Additives Sales Volume by Antimicrobial Mechanism
3.3.4.1 Global Antimicrobial Plastic Additives Sales Volume by Antimicrobial Mechanism (2021 vs 2025 vs 2032)
3.3.4.2 Global Antimicrobial Plastic Additives Sales Volume, by Antimicrobial Mechanism (2021–2032)
3.3.4.3 Global Antimicrobial Plastic Additives Sales Volume, by Antimicrobial Mechanism (%), 2021–2032
3.3.5 Global Antimicrobial Plastic Additives Average Price by Antimicrobial Mechanism (2021–2032)
3.4 Introduction by Compatible Polymer Type
3.4.1 General-purpose Plastics
3.4.2 Engineering Plastics
3.4.3 Global Antimicrobial Plastic Additives Sales Value by Compatible Polymer Type
3.4.3.1 Global Antimicrobial Plastic Additives Sales Value by Compatible Polymer Type (2021 vs 2025 vs 2032)
3.4.3.2 Global Antimicrobial Plastic Additives Sales Value, by Compatible Polymer Type (2021–2032)
3.4.3.3 Global Antimicrobial Plastic Additives Sales Value, by Compatible Polymer Type (%), 2021–2032
3.4.4 Global Antimicrobial Plastic Additives Sales Volume by Compatible Polymer Type
3.4.4.1 Global Antimicrobial Plastic Additives Sales Volume by Compatible Polymer Type (2021 vs 2025 vs 2032)
3.4.4.2 Global Antimicrobial Plastic Additives Sales Volume, by Compatible Polymer Type (2021–2032)
3.4.4.3 Global Antimicrobial Plastic Additives Sales Volume, by Compatible Polymer Type (%), 2021–2032
3.4.5 Global Antimicrobial Plastic Additives Average Price by Compatible Polymer Type (2021–2032)
4 Segmentation by Application
4.1 Introduction by Application
4.1.1 Healthcare
4.1.2 Packaging
4.1.3 Food & Beverage
4.1.4 Construction
4.1.5 Others
4.2 Global Antimicrobial Plastic Additives Sales Value by Application
4.2.1 Global Antimicrobial Plastic Additives Sales Value by Application (2021 vs 2025 vs 2032)
4.2.2 Global Antimicrobial Plastic Additives Sales Value, by Application (2021–2032)
4.2.3 Global Antimicrobial Plastic Additives Sales Value, by Application (%), 2021–2032
4.3 Global Antimicrobial Plastic Additives Sales Volume by Application
4.3.1 Global Antimicrobial Plastic Additives Sales Volume by Application (2021 vs 2025 vs 2032)
4.3.2 Global Antimicrobial Plastic Additives Sales Volume, by Application (2021–2032)
4.3.3 Global Antimicrobial Plastic Additives Sales Volume, by Application (%), 2021–2032
4.4 Global Antimicrobial Plastic Additives Average Price by Application (2021–2032)
5 Segmentation by Region
5.1 Global Antimicrobial Plastic Additives Sales Value by Region
5.1.1 Global Antimicrobial Plastic Additives Sales Value by Region: 2021 vs 2025 vs 2032
5.1.2 Global Antimicrobial Plastic Additives Sales Value by Region (2021–2026)
5.1.3 Global Antimicrobial Plastic Additives Sales Value by Region (2027–2032)
5.1.4 Global Antimicrobial Plastic Additives Sales Value by Region (%), 2021–2032
5.2 Global Antimicrobial Plastic Additives Sales Volume by Region
5.2.1 Global Antimicrobial Plastic Additives Sales Volume by Region: 2021 vs 2025 vs 2032
5.2.2 Global Antimicrobial Plastic Additives Sales Volume by Region (2021–2026)
5.2.3 Global Antimicrobial Plastic Additives Sales Volume by Region (2027–2032)
5.2.4 Global Antimicrobial Plastic Additives Sales Volume by Region (%), 2021–2032
5.3 Global Antimicrobial Plastic Additives Average Price by Region (2021–2032)
5.4 North America
5.4.1 North America Antimicrobial Plastic Additives Sales Value, 2021–2032
5.4.2 North America Antimicrobial Plastic Additives Sales Value by Country (%), 2025 vs 2032
5.5 Europe
5.5.1 Europe Antimicrobial Plastic Additives Sales Value, 2021–2032
5.5.2 Europe Antimicrobial Plastic Additives Sales Value by Country (%), 2025 vs 2032
5.6 Asia Pacific
5.6.1 Asia Pacific Antimicrobial Plastic Additives Sales Value, 2021–2032
5.6.2 Asia Pacific Antimicrobial Plastic Additives Sales Value by Region (%), 2025 vs 2032
5.7 South America
5.7.1 South America Antimicrobial Plastic Additives Sales Value, 2021–2032
5.7.2 South America Antimicrobial Plastic Additives Sales Value by Country (%), 2025 vs 2032
5.8 Middle East & Africa
5.8.1 Middle East & Africa Antimicrobial Plastic Additives Sales Value, 2021–2032
5.8.2 Middle East & Africa Antimicrobial Plastic Additives Sales Value by Country (%), 2025 vs 2032
6 Segmentation by Key Countries/Regions
6.1 Key Countries/Regions Antimicrobial Plastic Additives Sales Value Growth Trends, 2021 vs 2025 vs 2032
6.2 Key Countries/Regions Antimicrobial Plastic Additives Sales Value and Sales Volume
6.2.1 Key Countries/Regions Antimicrobial Plastic Additives Sales Value, 2021–2032
6.2.2 Key Countries/Regions Antimicrobial Plastic Additives Sales Volume, 2021–2032
6.3 United States
6.3.1 United States Antimicrobial Plastic Additives Sales Value, 2021–2032
6.3.2 United States Antimicrobial Plastic Additives Sales Value by Type (%), 2025 vs 2032
6.3.3 United States Antimicrobial Plastic Additives Sales Value by Application, 2025 vs 2032
6.4 Europe
6.4.1 Europe Antimicrobial Plastic Additives Sales Value, 2021–2032
6.4.2 Europe Antimicrobial Plastic Additives Sales Value by Type (%), 2025 vs 2032
6.4.3 Europe Antimicrobial Plastic Additives Sales Value by Application, 2025 vs 2032
6.5 China
6.5.1 China Antimicrobial Plastic Additives Sales Value, 2021–2032
6.5.2 China Antimicrobial Plastic Additives Sales Value by Type (%), 2025 vs 2032
6.5.3 China Antimicrobial Plastic Additives Sales Value by Application, 2025 vs 2032
6.6 Japan
6.6.1 Japan Antimicrobial Plastic Additives Sales Value, 2021–2032
6.6.2 Japan Antimicrobial Plastic Additives Sales Value by Type (%), 2025 vs 2032
6.6.3 Japan Antimicrobial Plastic Additives Sales Value by Application, 2025 vs 2032
6.7 South Korea
6.7.1 South Korea Antimicrobial Plastic Additives Sales Value, 2021–2032
6.7.2 South Korea Antimicrobial Plastic Additives Sales Value by Type (%), 2025 vs 2032
6.7.3 South Korea Antimicrobial Plastic Additives Sales Value by Application, 2025 vs 2032
6.8 Southeast Asia
6.8.1 Southeast Asia Antimicrobial Plastic Additives Sales Value, 2021–2032
6.8.2 Southeast Asia Antimicrobial Plastic Additives Sales Value by Type (%), 2025 vs 2032
6.8.3 Southeast Asia Antimicrobial Plastic Additives Sales Value by Application, 2025 vs 2032
6.9 India
6.9.1 India Antimicrobial Plastic Additives Sales Value, 2021–2032
6.9.2 India Antimicrobial Plastic Additives Sales Value by Type (%), 2025 vs 2032
6.9.3 India Antimicrobial Plastic Additives Sales Value by Application, 2025 vs 2032
7 Company Profiles
7.1 Biocote Limited
7.1.1 Biocote Limited Company Information
7.1.2 Biocote Limited Introduction and Business Overview
7.1.3 Biocote Limited Antimicrobial Plastic Additives Sales, Revenue, Price and Gross Margin (2021–2026)
7.1.4 Biocote Limited Antimicrobial Plastic Additives Product Offerings
7.1.5 Biocote Limited Recent Developments
7.2 Microban Products Company
7.2.1 Microban Products Company Company Information
7.2.2 Microban Products Company Introduction and Business Overview
7.2.3 Microban Products Company Antimicrobial Plastic Additives Sales, Revenue, Price and Gross Margin (2021–2026)
7.2.4 Microban Products Company Antimicrobial Plastic Additives Product Offerings
7.2.5 Microban Products Company Recent Developments
7.3 Addmaster Ltd (Polygiene Group)
7.3.1 Addmaster Ltd (Polygiene Group) Company Information
7.3.2 Addmaster Ltd (Polygiene Group) Introduction and Business Overview
7.3.3 Addmaster Ltd (Polygiene Group) Antimicrobial Plastic Additives Sales, Revenue, Price and Gross Margin (2021–2026)
7.3.4 Addmaster Ltd (Polygiene Group) Antimicrobial Plastic Additives Product Offerings
7.3.5 Addmaster Ltd (Polygiene Group) Recent Developments
7.4 Symphony Environmental Plc
7.4.1 Symphony Environmental Plc Company Information
7.4.2 Symphony Environmental Plc Introduction and Business Overview
7.4.3 Symphony Environmental Plc Antimicrobial Plastic Additives Sales, Revenue, Price and Gross Margin (2021–2026)
7.4.4 Symphony Environmental Plc Antimicrobial Plastic Additives Product Offerings
7.4.5 Symphony Environmental Plc Recent Developments
7.5 Phoenix Plastics
7.5.1 Phoenix Plastics Company Information
7.5.2 Phoenix Plastics Introduction and Business Overview
7.5.3 Phoenix Plastics Antimicrobial Plastic Additives Sales, Revenue, Price and Gross Margin (2021–2026)
7.5.4 Phoenix Plastics Antimicrobial Plastic Additives Product Offerings
7.5.5 Phoenix Plastics Recent Developments
7.6 Sanitized
7.6.1 Sanitized Company Information
7.6.2 Sanitized Introduction and Business Overview
7.6.3 Sanitized Antimicrobial Plastic Additives Sales, Revenue, Price and Gross Margin (2021–2026)
7.6.4 Sanitized Antimicrobial Plastic Additives Product Offerings
7.6.5 Sanitized Recent Developments
7.7 RTP Company
7.7.1 RTP Company Company Information
7.7.2 RTP Company Introduction and Business Overview
7.7.3 RTP Company Antimicrobial Plastic Additives Sales, Revenue, Price and Gross Margin (2021–2026)
7.7.4 RTP Company Antimicrobial Plastic Additives Product Offerings
7.7.5 RTP Company Recent Developments
7.8 ZeoVation
7.8.1 ZeoVation Company Information
7.8.2 ZeoVation Introduction and Business Overview
7.8.3 ZeoVation Antimicrobial Plastic Additives Sales, Revenue, Price and Gross Margin (2021–2026)
7.8.4 ZeoVation Antimicrobial Plastic Additives Product Offerings
7.8.5 ZeoVation Recent Developments
7.9 Blend Colours Pvt. Ltd.
7.9.1 Blend Colours Pvt. Ltd. Company Information
7.9.2 Blend Colours Pvt. Ltd. Introduction and Business Overview
7.9.3 Blend Colours Pvt. Ltd. Antimicrobial Plastic Additives Sales, Revenue, Price and Gross Margin (2021–2026)
7.9.4 Blend Colours Pvt. Ltd. Antimicrobial Plastic Additives Product Offerings
7.9.5 Blend Colours Pvt. Ltd. Recent Developments
7.10 Americhem
7.10.1 Americhem Company Information
7.10.2 Americhem Introduction and Business Overview
7.10.3 Americhem Antimicrobial Plastic Additives Sales, Revenue, Price and Gross Margin (2021–2026)
7.10.4 Americhem Antimicrobial Plastic Additives Product Offerings
7.10.5 Americhem Recent Developments
7.11 Avient
7.11.1 Avient Company Information
7.11.2 Avient Introduction and Business Overview
7.11.3 Avient Antimicrobial Plastic Additives Sales, Revenue, Price and Gross Margin (2021–2026)
7.11.4 Avient Antimicrobial Plastic Additives Product Offerings
7.11.5 Avient Recent Developments
7.12 Primex Plastics Corporation
7.12.1 Primex Plastics Corporation Company Information
7.12.2 Primex Plastics Corporation Introduction and Business Overview
7.12.3 Primex Plastics Corporation Antimicrobial Plastic Additives Sales, Revenue, Price and Gross Margin (2021–2026)
7.12.4 Primex Plastics Corporation Antimicrobial Plastic Additives Product Offerings
7.12.5 Primex Plastics Corporation Recent Developments
7.13 Belton Industries
7.13.1 Belton Industries Company Information
7.13.2 Belton Industries Introduction and Business Overview
7.13.3 Belton Industries Antimicrobial Plastic Additives Sales, Revenue, Price and Gross Margin (2021–2026)
7.13.4 Belton Industries Antimicrobial Plastic Additives Product Offerings
7.13.5 Belton Industries Recent Developments
7.14 SAREX
7.14.1 SAREX Company Information
7.14.2 SAREX Introduction and Business Overview
7.14.3 SAREX Antimicrobial Plastic Additives Sales, Revenue, Price and Gross Margin (2021–2026)
7.14.4 SAREX Antimicrobial Plastic Additives Product Offerings
7.14.5 SAREX Recent Developments
7.15 Ampacet Corporation
7.15.1 Ampacet Corporation Company Information
7.15.2 Ampacet Corporation Introduction and Business Overview
7.15.3 Ampacet Corporation Antimicrobial Plastic Additives Sales, Revenue, Price and Gross Margin (2021–2026)
7.15.4 Ampacet Corporation Antimicrobial Plastic Additives Product Offerings
7.15.5 Ampacet Corporation Recent Developments
8 Industry Chain Analysis
8.1 Antimicrobial Plastic Additives Industrial Chain
8.2 Antimicrobial Plastic Additives Upstream Analysis
8.2.1 Key Raw Materials
8.2.2 Key Suppliers of Raw Materials
8.2.3 Manufacturing Cost Structure
8.3 Midstream Analysis
8.4 Downstream Analysis (Customer Analysis)
8.5 Sales Model and Sales Channelss
8.5.1 Antimicrobial Plastic Additives Sales Model
8.5.2 Sales Channels
8.5.3 Antimicrobial Plastic Additives Distributors
9 Research Findings and Conclusion
10 Appendix
10.1 Research Methodology
10.1.1 Methodology/Research Approach
10.1.1.1 Research Programs/Design
10.1.1.2 Market Size Estimation
10.1.1.3 Market Breakdown and Data Triangulation
10.1.2 Data Source
10.1.2.1 Secondary Sources
10.1.2.2 Primary Sources
10.2 Author Details
10.3 Disclaimer