1 Market Overview
1.1 Alcohol-Based Markers Product Introduction
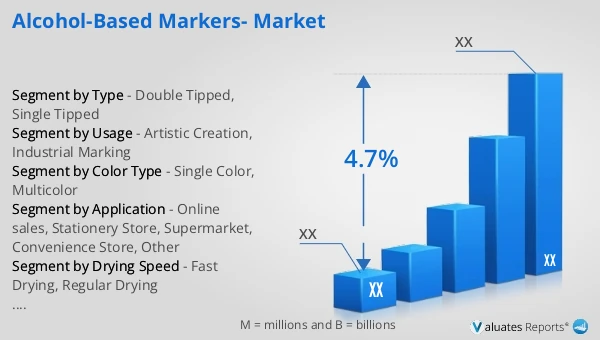
1.2 Global Alcohol-Based Markers Market Size Forecast
1.2.1 Global Alcohol-Based Markers Sales Value (2021–2032)
1.2.2 Global Alcohol-Based Markers Sales Volume (2021–2032)
1.2.3 Global Alcohol-Based Markers Sales Price (2021–2032)
1.3 Alcohol-Based Markers Market Trends & Drivers
1.3.1 Alcohol-Based Markers Industry Trends
1.3.2 Alcohol-Based Markers Market Drivers & Opportunities
1.3.3 Alcohol-Based Markers Market Challenges
1.3.4 Alcohol-Based Markers Market Restraints
1.3.5 Impact of U.S. Tariffs
1.4 Assumptions and Limitations
1.5 Study Objectives
1.6 Years Considered
2 Competitive Analysis by Company
2.1 Global Alcohol-Based Markers Players Revenue Ranking (2025)
2.2 Global Alcohol-Based Markers Revenue by Company (2021–2026)
2.3 Global Alcohol-Based Markers Sales Volume Ranking of Players (2025)
2.4 Global Alcohol-Based Markers Sales Volume by Company (2021–2026)
2.5 Global Alcohol-Based Markers Average Price by Company (2021–2026)
2.6 Key Manufacturers Alcohol-Based Markers Manufacturing Base and Headquarters
2.7 Key Manufacturers Alcohol-Based Markers Product Offerings
2.8 Key Manufacturers Start of Mass Production of Alcohol-Based Markers
2.9 Alcohol-Based Markers Market Competitive Analysis
2.9.1 Alcohol-Based Markers Market Concentration Rate (2021–2026)
2.9.2 Global 5 and 10 Largest Manufacturers by Alcohol-Based Markers Revenue in 2025
2.9.3 Global Companies by Tier (Tier 1, Tier 2, Tier 3), based on Alcohol-Based Markers revenue, 2025
2.10 Mergers & Acquisitions and Expansion
3 Segmentation Alcohol-Based Markers Market Classification
3.1 Introduction by Type
3.1.1 Double Tipped
3.1.2 Single Tipped
3.1.3 Global Alcohol-Based Markers Sales Value by Type
3.1.3.1 Global Alcohol-Based Markers Sales Value by Type (2021 vs 2025 vs 2032)
3.1.3.2 Global Alcohol-Based Markers Sales Value, by Type (2021–2032)
3.1.3.3 Global Alcohol-Based Markers Sales Value, by Type (%), 2021–2032
3.1.4 Global Alcohol-Based Markers Sales Volume by Type
3.1.4.1 Global Alcohol-Based Markers Sales Volume by Type (2021 vs 2025 vs 2032)
3.1.4.2 Global Alcohol-Based Markers Sales Volume, by Type (2021–2032)
3.1.4.3 Global Alcohol-Based Markers Sales Volume, by Type (%), 2021–2032
3.1.5 Global Alcohol-Based Markers Average Price by Type (2021–2032)
3.2 Introduction by Color Type
3.2.1 Single Color
3.2.2 Multicolor
3.2.3 Global Alcohol-Based Markers Sales Value by Color Type
3.2.3.1 Global Alcohol-Based Markers Sales Value by Color Type (2021 vs 2025 vs 2032)
3.2.3.2 Global Alcohol-Based Markers Sales Value, by Color Type (2021–2032)
3.2.3.3 Global Alcohol-Based Markers Sales Value, by Color Type (%), 2021–2032
3.2.4 Global Alcohol-Based Markers Sales Volume by Color Type
3.2.4.1 Global Alcohol-Based Markers Sales Volume by Color Type (2021 vs 2025 vs 2032)
3.2.4.2 Global Alcohol-Based Markers Sales Volume, by Color Type (2021–2032)
3.2.4.3 Global Alcohol-Based Markers Sales Volume, by Color Type (%), 2021–2032
3.2.5 Global Alcohol-Based Markers Average Price by Color Type (2021–2032)
3.3 Introduction by Usage
3.3.1 Artistic Creation
3.3.2 Industrial Marking
3.3.3 Global Alcohol-Based Markers Sales Value by Usage
3.3.3.1 Global Alcohol-Based Markers Sales Value by Usage (2021 vs 2025 vs 2032)
3.3.3.2 Global Alcohol-Based Markers Sales Value, by Usage (2021–2032)
3.3.3.3 Global Alcohol-Based Markers Sales Value, by Usage (%), 2021–2032
3.3.4 Global Alcohol-Based Markers Sales Volume by Usage
3.3.4.1 Global Alcohol-Based Markers Sales Volume by Usage (2021 vs 2025 vs 2032)
3.3.4.2 Global Alcohol-Based Markers Sales Volume, by Usage (2021–2032)
3.3.4.3 Global Alcohol-Based Markers Sales Volume, by Usage (%), 2021–2032
3.3.5 Global Alcohol-Based Markers Average Price by Usage (2021–2032)
3.4 Introduction by Drying Speed
3.4.1 Fast Drying
3.4.2 Regular Drying
3.4.3 Global Alcohol-Based Markers Sales Value by Drying Speed
3.4.3.1 Global Alcohol-Based Markers Sales Value by Drying Speed (2021 vs 2025 vs 2032)
3.4.3.2 Global Alcohol-Based Markers Sales Value, by Drying Speed (2021–2032)
3.4.3.3 Global Alcohol-Based Markers Sales Value, by Drying Speed (%), 2021–2032
3.4.4 Global Alcohol-Based Markers Sales Volume by Drying Speed
3.4.4.1 Global Alcohol-Based Markers Sales Volume by Drying Speed (2021 vs 2025 vs 2032)
3.4.4.2 Global Alcohol-Based Markers Sales Volume, by Drying Speed (2021–2032)
3.4.4.3 Global Alcohol-Based Markers Sales Volume, by Drying Speed (%), 2021–2032
3.4.5 Global Alcohol-Based Markers Average Price by Drying Speed (2021–2032)
4 Segmentation by Application
4.1 Introduction by Application
4.1.1 Online sales
4.1.2 Stationery Store
4.1.3 Supermarket
4.1.4 Convenience Store
4.1.5 Other
4.2 Global Alcohol-Based Markers Sales Value by Application
4.2.1 Global Alcohol-Based Markers Sales Value by Application (2021 vs 2025 vs 2032)
4.2.2 Global Alcohol-Based Markers Sales Value, by Application (2021–2032)
4.2.3 Global Alcohol-Based Markers Sales Value, by Application (%), 2021–2032
4.3 Global Alcohol-Based Markers Sales Volume by Application
4.3.1 Global Alcohol-Based Markers Sales Volume by Application (2021 vs 2025 vs 2032)
4.3.2 Global Alcohol-Based Markers Sales Volume, by Application (2021–2032)
4.3.3 Global Alcohol-Based Markers Sales Volume, by Application (%), 2021–2032
4.4 Global Alcohol-Based Markers Average Price by Application (2021–2032)
5 Segmentation by Region
5.1 Global Alcohol-Based Markers Sales Value by Region
5.1.1 Global Alcohol-Based Markers Sales Value by Region: 2021 vs 2025 vs 2032
5.1.2 Global Alcohol-Based Markers Sales Value by Region (2021–2026)
5.1.3 Global Alcohol-Based Markers Sales Value by Region (2027–2032)
5.1.4 Global Alcohol-Based Markers Sales Value by Region (%), 2021–2032
5.2 Global Alcohol-Based Markers Sales Volume by Region
5.2.1 Global Alcohol-Based Markers Sales Volume by Region: 2021 vs 2025 vs 2032
5.2.2 Global Alcohol-Based Markers Sales Volume by Region (2021–2026)
5.2.3 Global Alcohol-Based Markers Sales Volume by Region (2027–2032)
5.2.4 Global Alcohol-Based Markers Sales Volume by Region (%), 2021–2032
5.3 Global Alcohol-Based Markers Average Price by Region (2021–2032)
5.4 North America
5.4.1 North America Alcohol-Based Markers Sales Value, 2021–2032
5.4.2 North America Alcohol-Based Markers Sales Value by Country (%), 2025 vs 2032
5.5 Europe
5.5.1 Europe Alcohol-Based Markers Sales Value, 2021–2032
5.5.2 Europe Alcohol-Based Markers Sales Value by Country (%), 2025 vs 2032
5.6 Asia Pacific
5.6.1 Asia Pacific Alcohol-Based Markers Sales Value, 2021–2032
5.6.2 Asia Pacific Alcohol-Based Markers Sales Value by Region (%), 2025 vs 2032
5.7 South America
5.7.1 South America Alcohol-Based Markers Sales Value, 2021–2032
5.7.2 South America Alcohol-Based Markers Sales Value by Country (%), 2025 vs 2032
5.8 Middle East & Africa
5.8.1 Middle East & Africa Alcohol-Based Markers Sales Value, 2021–2032
5.8.2 Middle East & Africa Alcohol-Based Markers Sales Value by Country (%), 2025 vs 2032
6 Segmentation by Key Countries/Regions
6.1 Key Countries/Regions Alcohol-Based Markers Sales Value Growth Trends, 2021 vs 2025 vs 2032
6.2 Key Countries/Regions Alcohol-Based Markers Sales Value and Sales Volume
6.2.1 Key Countries/Regions Alcohol-Based Markers Sales Value, 2021–2032
6.2.2 Key Countries/Regions Alcohol-Based Markers Sales Volume, 2021–2032
6.3 United States
6.3.1 United States Alcohol-Based Markers Sales Value, 2021–2032
6.3.2 United States Alcohol-Based Markers Sales Value by Type (%), 2025 vs 2032
6.3.3 United States Alcohol-Based Markers Sales Value by Application, 2025 vs 2032
6.4 Europe
6.4.1 Europe Alcohol-Based Markers Sales Value, 2021–2032
6.4.2 Europe Alcohol-Based Markers Sales Value by Type (%), 2025 vs 2032
6.4.3 Europe Alcohol-Based Markers Sales Value by Application, 2025 vs 2032
6.5 China
6.5.1 China Alcohol-Based Markers Sales Value, 2021–2032
6.5.2 China Alcohol-Based Markers Sales Value by Type (%), 2025 vs 2032
6.5.3 China Alcohol-Based Markers Sales Value by Application, 2025 vs 2032
6.6 Japan
6.6.1 Japan Alcohol-Based Markers Sales Value, 2021–2032
6.6.2 Japan Alcohol-Based Markers Sales Value by Type (%), 2025 vs 2032
6.6.3 Japan Alcohol-Based Markers Sales Value by Application, 2025 vs 2032
6.7 South Korea
6.7.1 South Korea Alcohol-Based Markers Sales Value, 2021–2032
6.7.2 South Korea Alcohol-Based Markers Sales Value by Type (%), 2025 vs 2032
6.7.3 South Korea Alcohol-Based Markers Sales Value by Application, 2025 vs 2032
6.8 Southeast Asia
6.8.1 Southeast Asia Alcohol-Based Markers Sales Value, 2021–2032
6.8.2 Southeast Asia Alcohol-Based Markers Sales Value by Type (%), 2025 vs 2032
6.8.3 Southeast Asia Alcohol-Based Markers Sales Value by Application, 2025 vs 2032
6.9 India
6.9.1 India Alcohol-Based Markers Sales Value, 2021–2032
6.9.2 India Alcohol-Based Markers Sales Value by Type (%), 2025 vs 2032
6.9.3 India Alcohol-Based Markers Sales Value by Application, 2025 vs 2032
7 Company Profiles
7.1 Ohuhu
7.1.1 Ohuhu Company Information
7.1.2 Ohuhu Introduction and Business Overview
7.1.3 Ohuhu Alcohol-Based Markers Sales, Revenue, Price and Gross Margin (2021–2026)
7.1.4 Ohuhu Alcohol-Based Markers Product Offerings
7.1.5 Ohuhu Recent Developments
7.2 Prismacolor
7.2.1 Prismacolor Company Information
7.2.2 Prismacolor Introduction and Business Overview
7.2.3 Prismacolor Alcohol-Based Markers Sales, Revenue, Price and Gross Margin (2021–2026)
7.2.4 Prismacolor Alcohol-Based Markers Product Offerings
7.2.5 Prismacolor Recent Developments
7.3 Too Corporation
7.3.1 Too Corporation Company Information
7.3.2 Too Corporation Introduction and Business Overview
7.3.3 Too Corporation Alcohol-Based Markers Sales, Revenue, Price and Gross Margin (2021–2026)
7.3.4 Too Corporation Alcohol-Based Markers Product Offerings
7.3.5 Too Corporation Recent Developments
7.4 Yosoo Basic
7.4.1 Yosoo Basic Company Information
7.4.2 Yosoo Basic Introduction and Business Overview
7.4.3 Yosoo Basic Alcohol-Based Markers Sales, Revenue, Price and Gross Margin (2021–2026)
7.4.4 Yosoo Basic Alcohol-Based Markers Product Offerings
7.4.5 Yosoo Basic Recent Developments
7.5 Artify Artist
7.5.1 Artify Artist Company Information
7.5.2 Artify Artist Introduction and Business Overview
7.5.3 Artify Artist Alcohol-Based Markers Sales, Revenue, Price and Gross Margin (2021–2026)
7.5.4 Artify Artist Alcohol-Based Markers Product Offerings
7.5.5 Artify Artist Recent Developments
7.6 Touchnew
7.6.1 Touchnew Company Information
7.6.2 Touchnew Introduction and Business Overview
7.6.3 Touchnew Alcohol-Based Markers Sales, Revenue, Price and Gross Margin (2021–2026)
7.6.4 Touchnew Alcohol-Based Markers Product Offerings
7.6.5 Touchnew Recent Developments
7.7 Caliart
7.7.1 Caliart Company Information
7.7.2 Caliart Introduction and Business Overview
7.7.3 Caliart Alcohol-Based Markers Sales, Revenue, Price and Gross Margin (2021–2026)
7.7.4 Caliart Alcohol-Based Markers Product Offerings
7.7.5 Caliart Recent Developments
7.8 Shuttle Art
7.8.1 Shuttle Art Company Information
7.8.2 Shuttle Art Introduction and Business Overview
7.8.3 Shuttle Art Alcohol-Based Markers Sales, Revenue, Price and Gross Margin (2021–2026)
7.8.4 Shuttle Art Alcohol-Based Markers Product Offerings
7.8.5 Shuttle Art Recent Developments
7.9 Bianyo
7.9.1 Bianyo Company Information
7.9.2 Bianyo Introduction and Business Overview
7.9.3 Bianyo Alcohol-Based Markers Sales, Revenue, Price and Gross Margin (2021–2026)
7.9.4 Bianyo Alcohol-Based Markers Product Offerings
7.9.5 Bianyo Recent Developments
7.10 Spectrum Noir
7.10.1 Spectrum Noir Company Information
7.10.2 Spectrum Noir Introduction and Business Overview
7.10.3 Spectrum Noir Alcohol-Based Markers Sales, Revenue, Price and Gross Margin (2021–2026)
7.10.4 Spectrum Noir Alcohol-Based Markers Product Offerings
7.10.5 Spectrum Noir Recent Developments
7.11 Chameleon Deluxe
7.11.1 Chameleon Deluxe Company Information
7.11.2 Chameleon Deluxe Introduction and Business Overview
7.11.3 Chameleon Deluxe Alcohol-Based Markers Sales, Revenue, Price and Gross Margin (2021–2026)
7.11.4 Chameleon Deluxe Alcohol-Based Markers Product Offerings
7.11.5 Chameleon Deluxe Recent Developments
8 Industry Chain Analysis
8.1 Alcohol-Based Markers Industrial Chain
8.2 Alcohol-Based Markers Upstream Analysis
8.2.1 Key Raw Materials
8.2.2 Key Suppliers of Raw Materials
8.2.3 Manufacturing Cost Structure
8.3 Midstream Analysis
8.4 Downstream Analysis (Customer Analysis)
8.5 Sales Model and Sales Channelss
8.5.1 Alcohol-Based Markers Sales Model
8.5.2 Sales Channels
8.5.3 Alcohol-Based Markers Distributors
9 Research Findings and Conclusion
10 Appendix
10.1 Research Methodology
10.1.1 Methodology/Research Approach
10.1.1.1 Research Programs/Design
10.1.1.2 Market Size Estimation
10.1.1.3 Market Breakdown and Data Triangulation
10.1.2 Data Source
10.1.2.1 Secondary Sources
10.1.2.2 Primary Sources
10.2 Author Details
10.3 Disclaimer