0
U.S. (TOLL FREE)
+1 (315) 215-3225
Automative

0
U.S. (TOLL FREE)
+1 (315) 215-3225
Global and India Reactive Dyes Market Report & Forecast 2023-2029
Published Date: December 2023
|
Report Code: QYRE-Auto-12O16044
Home | Market Reports | Business & Industrial| Chemicals Industry
Global and India Reactive Dyes Market Report Forecast 2023 2029
BUY CHAPTERS

Global and India Reactive Dyes Market Report & Forecast 2023-2029

Code: QYRE-Auto-12O16044
Report
December 2023
Pages:121
QYResearch
Buy Now with 15% Discount
DESCRIPTION
TABLE OF CONTENT
TABLES & FIGURES

and India Reactive Dyes Market Size

The global Reactive Dyes revenue was US$ 4581.7 million in 2022 and is forecast to a readjusted size of US$ 5495.3 million by 2029 with a CAGR of 2.6% during the forecast period (2023-2029).

and India Reactive Dyes Market

and India Reactive Dyes Market

In a reactive dye, a chromophore (an atom or group whose presence is responsible for the colour of a compound) contains a substituent that reacts with the substrate. Reactive dyes have good fastness properties owing to the bonding that occurs during dyeing. Reactive dyes are most commonly used in dyeing of cellulose like cotton or flax, but also wool is dyeable with reactive dyes. This report studies the Reactive Dyes market.
In India, the Reactive Dyes revenue is expected to grow from US$ million in 2022 to US$ million by 2029, at a CAGR of % during the forecast period (2023-2029).
The production regions of Reactive Dyes are mainly located in China and India. China was the leader production regions, which achieved about 46% volume market share.
As for the region consumption, the China remained the largest market for Reactive Dyes in the world, with 41% market share consumption. Other major consuming regions include India and Europe, which account for 15% and 19% respectively. For the various types of Reactive Dyes, Halogen Reactive Dyes are growing in the past, which was hold 27% market share approximately.
Reactive Dyes are used in a wide range of applications such as Polyester, Nylon and Polyurethane Fibers. Reactive Dyes are also used in Cotton Textiles, Wool and Silk. Apparel Cotton Textiles was the largest filed, which was esteemed to hold 37% market share.
Jinji Dyestuffs and Runtu are the top 2 players of Reactive Dyes, with about 14% market shares.
This report focuses on global and India Reactive Dyes market, also covers the segmentation data of other regions in regional level and county level.
India is now the world’s most populous country. According to IMF (its July update to its World Economic Outlook), India’s GDP growth is projected at 6.1% in 2023, powered by domestic investment. First and foremost, the key factor in India's rapid economic growth is the huge supply and demand from a large population base. Demand and supply sides working in both directions to support India's economic stability.
India is a market full of opportunities, and the demand for Reactive Dyes will continue to grow rapidly in the future.
Global Reactive Dyes Scope and Market Size
Reactive Dyes market is segmented in regional and country, by players, by type and by application. Companies, stakeholders, and other participants in the global Reactive Dyes market will be able to gain the upper hand as they use the report as a powerful resource. The segmental analysis focuses on revenue and forecast by type and by application for the period 2018-2029.
For India market, this report focuses on the Reactive Dyes market size by players, by Type and by Application, for the period 2018-2029. The key players include the global and local players, which play important roles in India.

Scope of and India Reactive Dyes Market Report

Report Metric Details
Report Name and India Reactive Dyes Market
Forecasted market size in 2029 US$ 5495.3 million
CAGR 2.6%
Forecasted years 2023 - 2029
Segment by Type
  • Halogen
  • Activated Vinyl Compound
  • Others
Segment by Application
  • Polyester, Nylon and Polyurethane Fibers
  • Cotton Textiles
  • Wool and Silk
  • Others
By Region
  • North America (United States, Canada)
  • Europe (Germany, France, UK, Italy, Russia) Rest of Europe
  • Nordic Countries
  • Asia-Pacific (China, Japan, South Korea)
  • Southeast Asia (India, Australia)
  • Rest of Asia
  • Latin America (Mexico, Brazil)
  • Rest of Latin America
  • Middle East & Africa (Turkey, Saudi Arabia, UAE, Rest of MEA)
By Company Archroma, Huntsman, Kiri Industries, Kyung-In, Colourtex, Jay Chemicals, Everlight Chemical, BEZEMA, Bodal Chemical, Sumitomo, Eksoy, Aarti Industries Ltd, Setas, Anand International, Jinji Dyestuffs, LonSen, Hubei Chuyuan, Runtu, Zhejiang Yide Chemical, Jihua Group, Zhejiang Jinguang Industrial, ANOKY, Hisoar Pharmaceutical
Forecast units USD million in value
Report coverage Revenue and volume forecast, company share, competitive landscape, growth factors and trends

FAQ for this report

What is the and India Reactive Dyes Market size in 2029?

Ans: The and India Reactive Dyes Market size in 2029 will be US$ 5495.3 million.

What is the and India Reactive Dyes Market production share by region?

Ans: China was the leader production regions, which achieved about 46% volume market share.

What is the and India Reactive Dyes Market share by region?

Ans: As for the region consumption, the China remained the largest market for Reactive Dyes in the world, with 41% market share consumption. According to IMF (its July update to its World Economic Outlook), India’s GDP growth is projected at 6.1% in 2023, powered by domestic investment.

What is the and India Reactive Dyes Market share by type?

Ans: For the various types of Reactive Dyes, Halogen Reactive Dyes are growing in the past, which was hold 27% market share approximately.

What is the and India Reactive Dyes Market share by application?

Ans: Apparel Cotton Textiles was the largest filed, which was esteemed to hold 37% market share.

What is the market share of major companies in and India Reactive Dyes Market?

Ans: Jinji Dyestuffs and Runtu are the top 2 players of Reactive Dyes, with about 14% market shares.

Who are the main players in the and India Reactive Dyes Market report?

Ans: The main players in the and India Reactive Dyes Market are Archroma, Huntsman, Kiri Industries, Kyung-In, Colourtex, Jay Chemicals, Everlight Chemical, BEZEMA, Bodal Chemical, Sumitomo, Eksoy, Aarti Industries Ltd, Setas, Anand International, Jinji Dyestuffs, LonSen, Hubei Chuyuan, Runtu, Zhejiang Yide Chemical, Jihua Group, Zhejiang Jinguang Industrial, ANOKY, Hisoar Pharmaceutical

What are the Application segmentation covered in the and India Reactive Dyes Market report?

Ans: The Applications covered in the and India Reactive Dyes Market report are Polyester, Nylon and Polyurethane Fibers, Cotton Textiles, Wool and Silk, Others

What are the Type segmentation covered in the and India Reactive Dyes Market report?

Ans: The Types covered in the and India Reactive Dyes Market report are Halogen, Activated Vinyl Compound, Others

Recommended Reports

Dyes Market Overview

Reactive Dyes Industry

Dyeing Technology

1 Study Coverage
1.1 Reactive Dyes Product Introduction
1.2 Global Reactive Dyes Outlook 2018 VS 2022 VS 2029
1.2.1 Global Reactive Dyes Sales in US$ Million for the Year 2018-2029
1.2.2 Global Reactive Dyes Sales in Volume for the Year 2018-2029
1.3 India Reactive Dyes Outlook 2018 VS 2022 VS 2029
1.3.1 India Reactive Dyes Sales in US$ Million for the Year 2018-2029
1.3.2 India Reactive Dyes Sales in Volume for the Year 2018-2029
1.4 Reactive Dyes Market Size, India VS Global, 2018 VS 2022 VS 2029
1.4.1 The Market Share of India Reactive Dyes in Global, 2018 VS 2022 VS 2029
1.4.2 The Growth Rate of Reactive Dyes Market Size, India VS Global, 2018 VS 2022 VS 2029
1.5 Reactive Dyes Market Dynamics
1.5.1 Reactive Dyes Industry Trends
1.5.2 Reactive Dyes Market Drivers
1.5.3 Reactive Dyes Market Challenges
1.5.4 Reactive Dyes Market Restraints
1.6 Study Objectives
1.7 Years Considered
1.8 Years Considered
2 Reactive Dyes by Type
2.1 Reactive Dyes Market Segment by Type
2.1.1 Halogen
2.1.2 Activated Vinyl Compound
2.1.3 Others
2.2 Global Reactive Dyes Market Size by Type
2.2.1 Global Reactive Dyes Sales in Value, by Type (2018, 2022 & 2029)
2.2.2 Global Reactive Dyes Sales in Volume, by Type (2018, 2022 & 2029)
2.2.3 Global Reactive Dyes Average Selling Price (ASP) by Type (2018, 2022 & 2029)
2.3 India Reactive Dyes Market Size by Type
2.3.1 India Reactive Dyes Sales in Value, by Type (2018, 2022 & 2029)
2.3.2 India Reactive Dyes Sales in Volume, by Type (2018, 2022 & 2029)
2.3.3 India Reactive Dyes Average Selling Price (ASP) by Type (2018, 2022 & 2029)
3 Reactive Dyes by Application
3.1 Reactive Dyes Market Segment by Application
3.1.1 Polyester, Nylon and Polyurethane Fibers
3.1.2 Cotton Textiles
3.1.3 Wool and Silk
3.1.4 Others
3.2 Global Reactive Dyes Market Size by Application
3.2.1 Global Reactive Dyes Sales in Value, by Application (2018, 2022 & 2029)
3.2.2 Global Reactive Dyes Sales in Volume, by Application (2018, 2022 & 2029)
3.3.3 Global Reactive Dyes Average Selling Price (ASP) by Application (2018, 2022 & 2029)
3.3 India Reactive Dyes Market Size by Application
3.3.1 India Reactive Dyes Sales in Value, by Application (2018, 2022 & 2029)
3.3.2 India Reactive Dyes Sales in Volume, by Application (2018, 2022 & 2029)
3.3.3 India Reactive Dyes Average Selling Price (ASP) by Application (2018, 2022 & 2029)
4 Global Reactive Dyes Competitor Landscape by Company
4.1 Global Reactive Dyes Market Size by Company
4.1.1 Global Key Manufacturers of Reactive Dyes, Ranked by Revenue (2022)
4.1.2 Global Reactive Dyes Revenue by Manufacturer (2018-2023)
4.1.3 Global Reactive Dyes Sales by Manufacturer (2018-2023)
4.1.4 Global Reactive Dyes Price by Manufacturer (2018-2023)
4.2 Global Reactive Dyes Concentration Ratio (CR)
4.2.1 Reactive Dyes Market Concentration Ratio (CR)
4.2.2 Global Top 5 and Top 10 Largest Manufacturers of Reactive Dyes in 2022
4.2.3 Global Reactive Dyes Market Share by Company Type (Tier 1, Tier 2, and Tier 3)
4.3 Global Key Manufacturers of Reactive Dyes, Manufacturing Base Distribution and Headquarters
4.4 Global Key Manufacturers of Reactive Dyes, Product Offered and Application
4.5 Global Key Manufacturers of Reactive Dyes, Date of Enter into This Industry
4.6 Manufacturers Mergers & Acquisitions, Expansion Plans
4.7 India Reactive Dyes Market Size by Company
4.7.1 Key Players of Reactive Dyes in India, Ranked by Revenue (2022)
4.7.2 India Reactive Dyes Revenue by Players (2018-2023)
4.7.3 India Reactive Dyes Sales by Players (2018-2023)
5 Global Reactive Dyes Market Size by Region
5.1 Global Reactive Dyes Market Size by Region: 2018 VS 2022 VS 2029
5.2 Global Reactive Dyes Market Size in Volume by Region (2018-2029)
5.2.1 Global Reactive Dyes Sales in Volume by Region: 2018-2023
5.2.2 Global Reactive Dyes Sales in Volume Forecast by Region (2024-2029)
5.3 Global Reactive Dyes Market Size in Value by Region (2018-2029)
5.3.1 Global Reactive Dyes Sales in Value by Region: 2018-2023
5.3.2 Global Reactive Dyes Sales in Value by Region: 2024-2029
6 Americas
6.1 Americas Reactive Dyes Market Size YoY Growth 2018-2029
6.2 Americas Reactive Dyes Sales in Volume, by Type (2018, 2022 & 2029)
6.3 Americas Reactive Dyes Sales in Volume, by Application (2018, 2022 & 2029)
6.4 Americas Reactive Dyes Market Facts & Figures by Country (2018, 2022 & 2029)
6.4.1 Americas Reactive Dyes Sales in Value by Country (2018, 2022 & 2029)
6.4.2 Americas Reactive Dyes Sales in Volume by Country (2018, 2022 & 2029)
6.4.3 United States
6.4.4 Canada
6.4.5 Mexico
6.4.6 Brazil
7 EMEA
7.1 EMEA Reactive Dyes Market Size YoY Growth 2018-2029
7.2 EMEA Reactive Dyes Sales in Volume, by Type (2018, 2022 & 2029)
7.3 EMEA Reactive Dyes Sales in Volume, by Application (2018, 2022 & 2029)
7.4 EMEA Reactive Dyes Market Facts & Figures by Country (2018, 2022 & 2029)
7.4.1 EMEA Reactive Dyes Sales in Value by Country (2018, 2022 & 2029)
7.4.2 EMEA Reactive Dyes Sales in Volume by Country (2018, 2022 & 2029)
7.4.3 Europe
7.4.4 Middle East
7.4.5 Africa
8 China
8.1 China Reactive Dyes Market Size YoY Growth 2018-2029
8.2 China Reactive Dyes Sales in Volume, by Type (2018, 2022 & 2029)
8.3 China Reactive Dyes Sales in Volume, by Application (2018, 2022 & 2029)
9 APAC
9.1 APAC Reactive Dyes Market Size YoY Growth 2018-2029
9.2 APAC Reactive Dyes Sales in Volume, by Type (2018, 2022 & 2029)
9.3 APAC Reactive Dyes Sales in Volume, by Application (2018, 2022 & 2029)
9.4 APAC Reactive Dyes Market Facts & Figures by Region (2018, 2022 & 2029)
9.4.1 APAC Reactive Dyes Sales in Value by Region (2018, 2022 & 2029)
9.4.2 APAC Reactive Dyes Sales in Volume by Region (2018, 2022 & 2029)
9.4.3 Japan
9.4.4 South Korea
9.4.5 China Taiwan
9.4.6 Southeast Asia
9.4.7 India
10 Company Profiles
10.1 Archroma
10.1.1 Archroma Company Information
10.1.2 Archroma Description and Business Overview
10.1.3 Archroma Reactive Dyes Sales, Revenue and Gross Margin (2018-2023)
10.1.4 Archroma Reactive Dyes Products Offered
10.1.5 Archroma Recent Development
10.2 Huntsman
10.2.1 Huntsman Company Information
10.2.2 Huntsman Description and Business Overview
10.2.3 Huntsman Reactive Dyes Sales, Revenue and Gross Margin (2018-2023)
10.2.4 Huntsman Reactive Dyes Products Offered
10.2.5 Huntsman Recent Development
10.3 Kiri Industries
10.3.1 Kiri Industries Company Information
10.3.2 Kiri Industries Description and Business Overview
10.3.3 Kiri Industries Reactive Dyes Sales, Revenue and Gross Margin (2018-2023)
10.3.4 Kiri Industries Reactive Dyes Products Offered
10.3.5 Kiri Industries Recent Development
10.4 Kyung-In
10.4.1 Kyung-In Company Information
10.4.2 Kyung-In Description and Business Overview
10.4.3 Kyung-In Reactive Dyes Sales, Revenue and Gross Margin (2018-2023)
10.4.4 Kyung-In Reactive Dyes Products Offered
10.4.5 Kyung-In Recent Development
10.5 Colourtex
10.5.1 Colourtex Company Information
10.5.2 Colourtex Description and Business Overview
10.5.3 Colourtex Reactive Dyes Sales, Revenue and Gross Margin (2018-2023)
10.5.4 Colourtex Reactive Dyes Products Offered
10.5.5 Colourtex Recent Development
10.6 Jay Chemicals
10.6.1 Jay Chemicals Company Information
10.6.2 Jay Chemicals Description and Business Overview
10.6.3 Jay Chemicals Reactive Dyes Sales, Revenue and Gross Margin (2018-2023)
10.6.4 Jay Chemicals Reactive Dyes Products Offered
10.6.5 Jay Chemicals Recent Development
10.7 Everlight Chemical
10.7.1 Everlight Chemical Company Information
10.7.2 Everlight Chemical Description and Business Overview
10.7.3 Everlight Chemical Reactive Dyes Sales, Revenue and Gross Margin (2018-2023)
10.7.4 Everlight Chemical Reactive Dyes Products Offered
10.7.5 Everlight Chemical Recent Development
10.8 BEZEMA
10.8.1 BEZEMA Company Information
10.8.2 BEZEMA Description and Business Overview
10.8.3 BEZEMA Reactive Dyes Sales, Revenue and Gross Margin (2018-2023)
10.8.4 BEZEMA Reactive Dyes Products Offered
10.8.5 BEZEMA Recent Development
10.9 Bodal Chemical
10.9.1 Bodal Chemical Company Information
10.9.2 Bodal Chemical Description and Business Overview
10.9.3 Bodal Chemical Reactive Dyes Sales, Revenue and Gross Margin (2018-2023)
10.9.4 Bodal Chemical Reactive Dyes Products Offered
10.9.5 Bodal Chemical Recent Development
10.10 Sumitomo
10.10.1 Sumitomo Company Information
10.10.2 Sumitomo Description and Business Overview
10.10.3 Sumitomo Reactive Dyes Sales, Revenue and Gross Margin (2018-2023)
10.10.4 Sumitomo Reactive Dyes Products Offered
10.10.5 Sumitomo Recent Development
10.11 Eksoy
10.11.1 Eksoy Company Information
10.11.2 Eksoy Description and Business Overview
10.11.3 Eksoy Reactive Dyes Sales, Revenue and Gross Margin (2018-2023)
10.11.4 Eksoy Reactive Dyes Products Offered
10.11.5 Eksoy Recent Development
10.12 Aarti Industries Ltd
10.12.1 Aarti Industries Ltd Company Information
10.12.2 Aarti Industries Ltd Description and Business Overview
10.12.3 Aarti Industries Ltd Reactive Dyes Sales, Revenue and Gross Margin (2018-2023)
10.12.4 Aarti Industries Ltd Reactive Dyes Products Offered
10.12.5 Aarti Industries Ltd Recent Development
10.13 Setas
10.13.1 Setas Company Information
10.13.2 Setas Description and Business Overview
10.13.3 Setas Reactive Dyes Sales, Revenue and Gross Margin (2018-2023)
10.13.4 Setas Reactive Dyes Products Offered
10.13.5 Setas Recent Development
10.14 Anand International
10.14.1 Anand International Company Information
10.14.2 Anand International Description and Business Overview
10.14.3 Anand International Reactive Dyes Sales, Revenue and Gross Margin (2018-2023)
10.14.4 Anand International Reactive Dyes Products Offered
10.14.5 Anand International Recent Development
10.15 Jinji Dyestuffs
10.15.1 Jinji Dyestuffs Company Information
10.15.2 Jinji Dyestuffs Description and Business Overview
10.15.3 Jinji Dyestuffs Reactive Dyes Sales, Revenue and Gross Margin (2018-2023)
10.15.4 Jinji Dyestuffs Reactive Dyes Products Offered
10.15.5 Jinji Dyestuffs Recent Development
10.16 LonSen
10.16.1 LonSen Company Information
10.16.2 LonSen Description and Business Overview
10.16.3 LonSen Reactive Dyes Sales, Revenue and Gross Margin (2018-2023)
10.16.4 LonSen Reactive Dyes Products Offered
10.16.5 LonSen Recent Development
10.17 Hubei Chuyuan
10.17.1 Hubei Chuyuan Company Information
10.17.2 Hubei Chuyuan Description and Business Overview
10.17.3 Hubei Chuyuan Reactive Dyes Sales, Revenue and Gross Margin (2018-2023)
10.17.4 Hubei Chuyuan Reactive Dyes Products Offered
10.17.5 Hubei Chuyuan Recent Development
10.18 Runtu
10.18.1 Runtu Company Information
10.18.2 Runtu Description and Business Overview
10.18.3 Runtu Reactive Dyes Sales, Revenue and Gross Margin (2018-2023)
10.18.4 Runtu Reactive Dyes Products Offered
10.18.5 Runtu Recent Development
10.19 Zhejiang Yide Chemical
10.19.1 Zhejiang Yide Chemical Company Information
10.19.2 Zhejiang Yide Chemical Description and Business Overview
10.19.3 Zhejiang Yide Chemical Reactive Dyes Sales, Revenue and Gross Margin (2018-2023)
10.19.4 Zhejiang Yide Chemical Reactive Dyes Products Offered
10.19.5 Zhejiang Yide Chemical Recent Development
10.20 Jihua Group
10.20.1 Jihua Group Company Information
10.20.2 Jihua Group Description and Business Overview
10.20.3 Jihua Group Reactive Dyes Sales, Revenue and Gross Margin (2018-2023)
10.20.4 Jihua Group Reactive Dyes Products Offered
10.20.5 Jihua Group Recent Development
10.21 Zhejiang Jinguang Industrial
10.21.1 Zhejiang Jinguang Industrial Company Information
10.21.2 Zhejiang Jinguang Industrial Description and Business Overview
10.21.3 Zhejiang Jinguang Industrial Reactive Dyes Sales, Revenue and Gross Margin (2018-2023)
10.21.4 Zhejiang Jinguang Industrial Reactive Dyes Products Offered
10.21.5 Zhejiang Jinguang Industrial Recent Development
10.22 ANOKY
10.22.1 ANOKY Company Information
10.22.2 ANOKY Description and Business Overview
10.22.3 ANOKY Reactive Dyes Sales, Revenue and Gross Margin (2018-2023)
10.22.4 ANOKY Reactive Dyes Products Offered
10.22.5 ANOKY Recent Development
10.23 Hisoar Pharmaceutical
10.23.1 Hisoar Pharmaceutical Company Information
10.23.2 Hisoar Pharmaceutical Description and Business Overview
10.23.3 Hisoar Pharmaceutical Reactive Dyes Sales, Revenue and Gross Margin (2018-2023)
10.23.4 Hisoar Pharmaceutical Reactive Dyes Products Offered
10.23.5 Hisoar Pharmaceutical Recent Development
11 Industry Chain and Sales Channels Analysis
11.1 Reactive Dyes Industry Chain Analysis
11.2 Reactive Dyes Key Raw Materials
11.2.1 Key Raw Materials
11.2.2 Raw Materials Key Suppliers
11.3 Reactive Dyes Production Mode & Process
11.4 Reactive Dyes Sales and Marketing
11.4.1 Reactive Dyes Sales Channels
11.4.2 Reactive Dyes Distributors
11.5 Reactive Dyes Customers
12 Research Findings and Conclusion
13 Appendix
13.1 Research Methodology
13.1.1 Methodology/Research Approach
13.1.2 Data Source
13.2 Author Details
13.3 Disclaimer
List of Tables
    Table 1. Reactive Dyes CAGR in Value, India VS Global, 2018 VS 2022 VS 2029
    Table 2. Reactive Dyes Market Trends
    Table 3. Reactive Dyes Market Drivers
    Table 4. Reactive Dyes Market Challenges
    Table 5. Reactive Dyes Market Restraints
    Table 6. Global Reactive Dyes Sales Growth Rate (CAGR) by Type: 2018 VS 2022 VS 2029 (US$ Million)
    Table 7. India Reactive Dyes Sales Growth Rate (CAGR) by Type: 2018 VS 2022 VS 2029 (US$ Million)
    Table 8. Global Reactive Dyes Sales Growth Rate (CAGR) by Application: 2018 VS 2022 VS 2029 (US$ Million)
    Table 9. India Reactive Dyes Sales Growth Rate (CAGR) by Application: 2018 VS 2022 VS 2029 (US$ Million)
    Table 10. Global Key Manufacturers of Reactive Dyes, Ranked by Revenue (2022) & (US$ Million)
    Table 11. Global Reactive Dyes Revenue by Manufacturer, (US$ Million), 2018-2023
    Table 12. Global Reactive Dyes Revenue Share by Manufacturer, 2018-2023
    Table 13. Global Reactive Dyes Sales by Manufacturer, (K MT), 2018-2023
    Table 14. Global Reactive Dyes Sales Share by Manufacturer, 2018-2023
    Table 15. Global Reactive Dyes Price by Manufacturer (2018-2023) & (USD/MT)
    Table 16. Global Reactive Dyes Manufacturers Market Concentration Ratio (CR5 and HHI)
    Table 17. Global Reactive Dyes by Company Type (Tier 1, Tier 2, and Tier 3) & (based on the Revenue in Reactive Dyes as of 2022)
    Table 18. Global Key Manufacturers of Reactive Dyes, Manufacturing Base Distribution and Headquarters
    Table 19. Global Key Manufacturers of Reactive Dyes, Product Offered and Application
    Table 20. Global Key Manufacturers of Reactive Dyes, Date of Enter into This Industry
    Table 21. Manufacturers Mergers & Acquisitions, Expansion Plans
    Table 22. Key Players of Reactive Dyes in India, Ranked by Revenue (2022) & (US$ million)
    Table 23. India Reactive Dyes Revenue by Players, (US$ Million), (2018-2023)
    Table 24. India Reactive Dyes Revenue Share by Players, (2018-2023)
    Table 25. India Reactive Dyes Sales by Players, (K MT), (2018-2023)
    Table 26. India Reactive Dyes Sales Share by Players, (2018-2023)
    Table 27. Global Reactive Dyes Market Size Growth Rate (CAGR) by Region (US$ Million): 2018 VS 2022 VS 2029
    Table 28. Global Reactive Dyes Sales in Volume by Region (2018-2023) & (K MT)
    Table 29. Global Reactive Dyes Sales in Volume Forecast by Region (2024-2029) & (K MT)
    Table 30. Global Reactive Dyes Sales in Value by Region (2018-2023) & (US$ Million)
    Table 31. Global Reactive Dyes Sales in Value Forecast by Region (2024-2029) & (US$ Million)
    Table 32. Americas Reactive Dyes Market Size Growth Rate (CAGR) by Country (US$ Million): 2018 VS 2022 VS 2029
    Table 33. Americas Reactive Dyes Sales in Value by Country (2018-2023) & (US$ Million)
    Table 34. Americas Reactive Dyes Sales in Value by Country (2024-2029) & (US$ Million)
    Table 35. Americas Reactive Dyes Sales in Volume by Country (2018-2023) & (K MT)
    Table 36. Americas Reactive Dyes Sales in Volume by Country (2024-2029) & (K MT)
    Table 37. EMEA Reactive Dyes Market Size Growth Rate (CAGR) by Country (US$ Million): 2018 VS 2022 VS 2029
    Table 38. EMEA Reactive Dyes Sales in Value by Country (2018-2023) & (US$ Million)
    Table 39. EMEA Reactive Dyes Sales in Value by Country (2024-2029) & (US$ Million)
    Table 40. EMEA Reactive Dyes Sales in Volume by Country (2018-2023) & (K MT)
    Table 41. EMEA Reactive Dyes Sales in Volume by Country (2024-2029) & (K MT)
    Table 42. APAC Reactive Dyes Market Size Growth Rate (CAGR) by Country (US$ Million): 2018 VS 2022 VS 2029
    Table 43. APAC Reactive Dyes Sales in Value by Country (2018-2023) & (US$ Million)
    Table 44. APAC Reactive Dyes Sales in Value by Country (2024-2029) & (US$ Million)
    Table 45. APAC Reactive Dyes Sales in Volume by Country (2018-2023) & (K MT)
    Table 46. APAC Reactive Dyes Sales in Volume by Country (2024-2029) & (K MT)
    Table 47. Archroma Company Information
    Table 48. Archroma Description and Business Overview
    Table 49. Archroma Reactive Dyes Sales (K MT), Revenue (US$ Million), Price (USD/MT) and Gross Margin (2018-2023)
    Table 50. Archroma Reactive Dyes Product
    Table 51. Archroma Recent Development
    Table 52. Huntsman Company Information
    Table 53. Huntsman Description and Business Overview
    Table 54. Huntsman Reactive Dyes Sales (K MT), Revenue (US$ Million), Price (USD/MT) and Gross Margin (2018-2023)
    Table 55. Huntsman Reactive Dyes Product
    Table 56. Huntsman Recent Development
    Table 57. Kiri Industries Company Information
    Table 58. Kiri Industries Description and Business Overview
    Table 59. Kiri Industries Reactive Dyes Sales (K MT), Revenue (US$ Million), Price (USD/MT) and Gross Margin (2018-2023)
    Table 60. Kiri Industries Reactive Dyes Product
    Table 61. Kiri Industries Recent Development
    Table 62. Kyung-In Company Information
    Table 63. Kyung-In Description and Business Overview
    Table 64. Kyung-In Reactive Dyes Sales (K MT), Revenue (US$ Million), Price (USD/MT) and Gross Margin (2018-2023)
    Table 65. Kyung-In Reactive Dyes Product
    Table 66. Kyung-In Recent Development
    Table 67. Colourtex Company Information
    Table 68. Colourtex Description and Business Overview
    Table 69. Colourtex Reactive Dyes Sales (K MT), Revenue (US$ Million), Price (USD/MT) and Gross Margin (2018-2023)
    Table 70. Colourtex Reactive Dyes Product
    Table 71. Colourtex Recent Development
    Table 72. Jay Chemicals Company Information
    Table 73. Jay Chemicals Description and Business Overview
    Table 74. Jay Chemicals Reactive Dyes Sales (K MT), Revenue (US$ Million), Price (USD/MT) and Gross Margin (2018-2023)
    Table 75. Jay Chemicals Reactive Dyes Product
    Table 76. Jay Chemicals Recent Development
    Table 77. Everlight Chemical Company Information
    Table 78. Everlight Chemical Description and Business Overview
    Table 79. Everlight Chemical Reactive Dyes Sales (K MT), Revenue (US$ Million), Price (USD/MT) and Gross Margin (2018-2023)
    Table 80. Everlight Chemical Reactive Dyes Product
    Table 81. Everlight Chemical Recent Development
    Table 82. BEZEMA Company Information
    Table 83. BEZEMA Description and Business Overview
    Table 84. BEZEMA Reactive Dyes Sales (K MT), Revenue (US$ Million), Price (USD/MT) and Gross Margin (2018-2023)
    Table 85. BEZEMA Reactive Dyes Product
    Table 86. BEZEMA Recent Development
    Table 87. Bodal Chemical Company Information
    Table 88. Bodal Chemical Description and Business Overview
    Table 89. Bodal Chemical Reactive Dyes Sales (K MT), Revenue (US$ Million), Price (USD/MT) and Gross Margin (2018-2023)
    Table 90. Bodal Chemical Reactive Dyes Product
    Table 91. Bodal Chemical Recent Development
    Table 92. Sumitomo Company Information
    Table 93. Sumitomo Description and Business Overview
    Table 94. Sumitomo Reactive Dyes Sales (K MT), Revenue (US$ Million), Price (USD/MT) and Gross Margin (2018-2023)
    Table 95. Sumitomo Reactive Dyes Product
    Table 96. Sumitomo Recent Development
    Table 97. Eksoy Company Information
    Table 98. Eksoy Description and Business Overview
    Table 99. Eksoy Reactive Dyes Sales (K MT), Revenue (US$ Million), Price (USD/MT) and Gross Margin (2018-2023)
    Table 100. Eksoy Reactive Dyes Product
    Table 101. Eksoy Recent Development
    Table 102. Aarti Industries Ltd Company Information
    Table 103. Aarti Industries Ltd Description and Business Overview
    Table 104. Aarti Industries Ltd Reactive Dyes Sales (K MT), Revenue (US$ Million), Price (USD/MT) and Gross Margin (2018-2023)
    Table 105. Aarti Industries Ltd Reactive Dyes Product
    Table 106. Aarti Industries Ltd Recent Development
    Table 107. Setas Company Information
    Table 108. Setas Description and Business Overview
    Table 109. Setas Reactive Dyes Sales (K MT), Revenue (US$ Million), Price (USD/MT) and Gross Margin (2018-2023)
    Table 110. Setas Reactive Dyes Product
    Table 111. Setas Recent Development
    Table 112. Anand International Company Information
    Table 113. Anand International Description and Business Overview
    Table 114. Anand International Reactive Dyes Sales (K MT), Revenue (US$ Million), Price (USD/MT) and Gross Margin (2018-2023)
    Table 115. Anand International Reactive Dyes Product
    Table 116. Anand International Recent Development
    Table 117. Jinji Dyestuffs Company Information
    Table 118. Jinji Dyestuffs Description and Business Overview
    Table 119. Jinji Dyestuffs Reactive Dyes Sales (K MT), Revenue (US$ Million), Price (USD/MT) and Gross Margin (2018-2023)
    Table 120. Jinji Dyestuffs Reactive Dyes Product
    Table 121. Jinji Dyestuffs Recent Development
    Table 122. LonSen Company Information
    Table 123. LonSen Description and Business Overview
    Table 124. LonSen Reactive Dyes Sales (K MT), Revenue (US$ Million), Price (USD/MT) and Gross Margin (2018-2023)
    Table 125. LonSen Reactive Dyes Product
    Table 126. LonSen Recent Development
    Table 127. Hubei Chuyuan Company Information
    Table 128. Hubei Chuyuan Description and Business Overview
    Table 129. Hubei Chuyuan Reactive Dyes Sales (K MT), Revenue (US$ Million), Price (USD/MT) and Gross Margin (2018-2023)
    Table 130. Hubei Chuyuan Reactive Dyes Product
    Table 131. Hubei Chuyuan Recent Development
    Table 132. Runtu Company Information
    Table 133. Runtu Description and Business Overview
    Table 134. Runtu Reactive Dyes Sales (K MT), Revenue (US$ Million), Price (USD/MT) and Gross Margin (2018-2023)
    Table 135. Runtu Reactive Dyes Product
    Table 136. Runtu Recent Development
    Table 137. Zhejiang Yide Chemical Company Information
    Table 138. Zhejiang Yide Chemical Description and Business Overview
    Table 139. Zhejiang Yide Chemical Reactive Dyes Sales (K MT), Revenue (US$ Million), Price (USD/MT) and Gross Margin (2018-2023)
    Table 140. Zhejiang Yide Chemical Reactive Dyes Product
    Table 141. Zhejiang Yide Chemical Recent Development
    Table 142. Jihua Group Company Information
    Table 143. Jihua Group Description and Business Overview
    Table 144. Jihua Group Reactive Dyes Sales (K MT), Revenue (US$ Million), Price (USD/MT) and Gross Margin (2018-2023)
    Table 145. Jihua Group Reactive Dyes Product
    Table 146. Jihua Group Recent Development
    Table 147. Zhejiang Jinguang Industrial Company Information
    Table 148. Zhejiang Jinguang Industrial Description and Business Overview
    Table 149. Zhejiang Jinguang Industrial Reactive Dyes Sales (K MT), Revenue (US$ Million), Price (USD/MT) and Gross Margin (2018-2023)
    Table 150. Zhejiang Jinguang Industrial Reactive Dyes Product
    Table 151. Zhejiang Jinguang Industrial Recent Development
    Table 152. ANOKY Company Information
    Table 153. ANOKY Description and Business Overview
    Table 154. ANOKY Reactive Dyes Sales (K MT), Revenue (US$ Million), Price (USD/MT) and Gross Margin (2018-2023)
    Table 155. ANOKY Reactive Dyes Product
    Table 156. ANOKY Recent Development
    Table 157. Hisoar Pharmaceutical Company Information
    Table 158. Hisoar Pharmaceutical Description and Business Overview
    Table 159. Hisoar Pharmaceutical Reactive Dyes Sales (K MT), Revenue (US$ Million), Price (USD/MT) and Gross Margin (2018-2023)
    Table 160. Hisoar Pharmaceutical Reactive Dyes Product
    Table 161. Hisoar Pharmaceutical Recent Development
    Table 162. Key Raw Materials Lists
    Table 163. Raw Materials Key Suppliers Lists
    Table 164. Reactive Dyes Customers List
    Table 165. Reactive Dyes Distributors List
    Table 166. Research Programs/Design for This Report
    Table 167. Key Data Information from Secondary Sources
    Table 168. Key Data Information from Primary Sources
List of Figures
    Figure 1. Reactive Dyes Product Picture
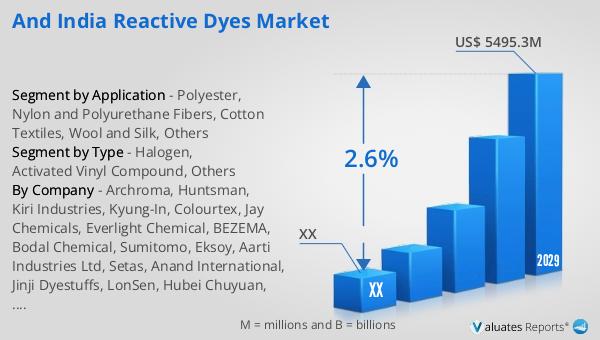
    Figure 2. Global Reactive Dyes Revenue, (US$ Million), 2018 VS 2022 VS 2029
    Figure 3. Global Reactive Dyes Market Size 2018-2029 (US$ Million)
    Figure 4. Global Reactive Dyes Sales 2018-2029 (K MT)
    Figure 5. India Reactive Dyes Revenue, (US$ Million), 2018 VS 2022 VS 2029
    Figure 6. India Reactive Dyes Market Size 2018-2029 (US$ Million)
    Figure 7. India Reactive Dyes Sales 2018-2029 (K MT)
    Figure 8. India Reactive Dyes Market Share in Global, in Value (US$ Million) 2018-2029
    Figure 9. India Reactive Dyes Market Share in Global, in Volume (K MT) 2018-2029
    Figure 10. Reactive Dyes Report Years Considered
    Figure 11. Product Picture of Halogen
    Figure 12. Product Picture of Activated Vinyl Compound
    Figure 13. Product Picture of Others
    Figure 14. Global Reactive Dyes Market Share by Type in 2022 & 2029
    Figure 15. Global Reactive Dyes Sales in Value by Type (2018-2029) & (US$ Million)
    Figure 16. Global Reactive Dyes Sales Market Share in Value by Type (2018-2029)
    Figure 17. Global Reactive Dyes Sales by Type (2018-2029) & (K MT)
    Figure 18. Global Reactive Dyes Sales Market Share in Volume by Type (2018-2029)
    Figure 19. Global Reactive Dyes Price by Type (2018-2029) & (USD/MT)
    Figure 20. India Reactive Dyes Market Share by Type in 2022 & 2029
    Figure 21. India Reactive Dyes Sales in Value by Type (2018-2029) & (US$ Million)
    Figure 22. India Reactive Dyes Sales Market Share in Value by Type (2018-2029)
    Figure 23. India Reactive Dyes Sales by Type (2018-2029) & (K MT)
    Figure 24. India Reactive Dyes Sales Market Share in Volume by Type (2018-2029)
    Figure 25. India Reactive Dyes Price by Type (2018-2029) & (USD/MT)
    Figure 26. Product Picture of Polyester, Nylon and Polyurethane Fibers
    Figure 27. Product Picture of Cotton Textiles
    Figure 28. Product Picture of Wool and Silk
    Figure 29. Product Picture of Others
    Figure 30. Global Reactive Dyes Market Share by Application in 2022 & 2029
    Figure 31. Global Reactive Dyes Sales in Value by Application (2018-2029) & (US$ Million)
    Figure 32. Global Reactive Dyes Sales Market Share in Value by Application (2018-2029)
    Figure 33. Global Reactive Dyes Sales by Application (2018-2029) & (K MT)
    Figure 34. Global Reactive Dyes Sales Market Share in Volume by Application (2018-2029)
    Figure 35. Global Reactive Dyes Price by Application (2018-2029) & (USD/MT)
    Figure 36. India Reactive Dyes Market Share by Application in 2022 & 2029
    Figure 37. India Reactive Dyes Sales in Value by Application (2018-2029) & (US$ Million)
    Figure 38. India Reactive Dyes Sales Market Share in Value by Application (2018-2029)
    Figure 39. India Reactive Dyes Sales by Application (2018-2029) & (K MT)
    Figure 40. India Reactive Dyes Sales Market Share in Volume by Application (2018-2029)
    Figure 41. India Reactive Dyes Price by Application (2018-2029) & (USD/MT)
    Figure 42. Americas Reactive Dyes Sales in Volume Growth Rate 2018-2029 (K MT)
    Figure 43. Americas Reactive Dyes Sales in Value Growth Rate 2018-2029 (US$ Million)
    Figure 44. Americas Reactive Dyes Sales by Type (2018-2029) & (K MT)
    Figure 45. Americas Reactive Dyes Sales Market Share in Volume by Type (2018-2029)
    Figure 46. Americas Reactive Dyes Sales by Application (2018-2029) & (K MT)
    Figure 47. Americas Reactive Dyes Sales Market Share in Volume by Application (2018-2029)
    Figure 48. United States Reactive Dyes Sales in Value Growth Rate (2018-2029) & (US$ Million)
    Figure 49. Canada Reactive Dyes Sales in Value Growth Rate (2018-2029) & (US$ Million)
    Figure 50. Mexico Reactive Dyes Sales in Value Growth Rate (2018-2029) & (US$ Million)
    Figure 51. Brazil Reactive Dyes Sales in Value Growth Rate (2018-2029) & (US$ Million)
    Figure 52. EMEA Reactive Dyes Sales in Volume Growth Rate 2018-2029 (K MT)
    Figure 53. EMEA Reactive Dyes Sales in Value Growth Rate 2018-2029 (US$ Million)
    Figure 54. EMEA Reactive Dyes Sales by Type (2018-2029) & (K MT)
    Figure 55. EMEA Reactive Dyes Sales Market Share in Volume by Type (2018-2029)
    Figure 56. EMEA Reactive Dyes Sales by Application (2018-2029) & (K MT)
    Figure 57. EMEA Reactive Dyes Sales Market Share in Volume by Application (2018-2029)
    Figure 58. Europe Reactive Dyes Sales in Value Growth Rate (2018-2029) & (US$ Million)
    Figure 59. Middle East Reactive Dyes Sales in Value Growth Rate (2018-2029) & (US$ Million)
    Figure 60. Africa Reactive Dyes Sales in Value Growth Rate (2018-2029) & (US$ Million)
    Figure 61. China Reactive Dyes Sales in Volume Growth Rate 2018-2029 (K MT)
    Figure 62. China Reactive Dyes Sales in Value Growth Rate 2018-2029 (US$ Million)
    Figure 63. China Reactive Dyes Sales by Type (2018-2029) & (K MT)
    Figure 64. China Reactive Dyes Sales Market Share in Volume by Type (2018-2029)
    Figure 65. China Reactive Dyes Sales by Application (2018-2029) & (K MT)
    Figure 66. China Reactive Dyes Sales Market Share in Volume by Application (2018-2029)
    Figure 67. APAC Reactive Dyes Sales in Volume Growth Rate 2018-2029 (K MT)
    Figure 68. APAC Reactive Dyes Sales in Value Growth Rate 2018-2029 (US$ Million)
    Figure 69. APAC Reactive Dyes Sales by Type (2018-2029) & (K MT)
    Figure 70. APAC Reactive Dyes Sales Market Share in Volume by Type (2018-2029)
    Figure 71. APAC Reactive Dyes Sales by Application (2018-2029) & (K MT)
    Figure 72. APAC Reactive Dyes Sales Market Share in Volume by Application (2018-2029)
    Figure 73. Japan Reactive Dyes Sales in Value Growth Rate (2018-2029) & (US$ Million)
    Figure 74. South Korea Reactive Dyes Sales in Value Growth Rate (2018-2029) & (US$ Million)
    Figure 75. China Taiwan Reactive Dyes Sales in Value Growth Rate (2018-2029) & (US$ Million)
    Figure 76. Southeast Asia Reactive Dyes Sales in Value Growth Rate (2018-2029) & (US$ Million)
    Figure 77. India Reactive Dyes Sales in Value Growth Rate (2018-2029) & (US$ Million)
    Figure 78. Reactive Dyes Value Chain
    Figure 79. Reactive Dyes Production Process
    Figure 80. Channels of Distribution
    Figure 81. Distributors Profiles
    Figure 82. Bottom-up and Top-down Approaches for This Report
    Figure 83. Data Triangulation
    Figure 84. Key Executives Interviewed
SELECT A FORMAT
Added to Cart
Electronic (PDF)

$4350

This license allows only one user to access the PDF.
Electronic (PDF)

$6525

This license allows 1 - 5 user to access the PDF, license is suitable for small groups of 5 users working together
Electronic (PDF)

$8700

This license allows users/teams in a same Enterprise to use this report, various departments within an enterpise can use this report
Add to Cart
Buy Now (15% Discount)

OUR CUSTOMER

SecuX Technology Inc

SIMILAR REPORTS


RELATED REPORTS

Global Resorcinol Formaldehyde Adhesive Resin Market Research Report 2025

120 Pages
Type: Report
Code: QYRE-Auto-19T20220
Wed Dec 03 00:00:00 UTC 2025

Add to Cart

Global Low-Sludge Phosphating Solution Market Research Report 2025

120 Pages
Type: Report
Code: QYRE-Auto-33H20007
Wed Dec 03 00:00:00 UTC 2025

Add to Cart

Global Linear Alpha-Olefin Market Research Report 2025

120 Pages
Type: Report
Code: QYRE-Auto-5Y6896
Wed Dec 03 00:00:00 UTC 2025

Add to Cart

Global Nodulizer Cored Wire Market Research Report 2025

120 Pages
Type: Report
Code: QYRE-Auto-10G20315
Wed Dec 03 00:00:00 UTC 2025

Add to Cart