0
U.S. (TOLL FREE)
+1 (315) 215-3225
Automative

0
U.S. (TOLL FREE)
+1 (315) 215-3225
Global Sodium Phosphite Market Research Report 2026
Published Date: 2026-01-28
|
Report Code: QYRE-Auto-12O20267
Home | Market Reports | Business & Industrial| Chemicals Industry
Global Sodium Phosphite Market Research Report 2026
BUY CHAPTERS

Global Sodium Phosphite Market Research Report 2026

Code: QYRE-Auto-12O20267
Report
2026-01-28
Pages:126
QYResearch
Buy Now with 15% Discount
DESCRIPTION
TABLE OF CONTENT
TABLES & FIGURES

Sodium Phosphite Market Size

The global Sodium Phosphite market was valued at US$ 413 million in 2025 and is anticipated to reach US$ 616 million by 2032, at a CAGR of 5.9% from 2026 to 2032.

Sodium Phosphite Market

Sodium Phosphite Market

The 2025 U.S. tariff policies introduce profound uncertainty into the global economic landscape. This report critically examines the implications of recent tariff adjustments and international strategic countermeasures on Sodium Phosphite competitive dynamics, regional economic interdependencies, and supply chain reconfigurations.
Sodium phosphite is an inorganic phosphorus salt (typically Na₂HPO₃ or NaH₂PO₃, depending on hydration and formulation) used primarily as a reducing agent, buffering component, corrosion inhibitor, and as an intermediate or formulated ingredient in agrochemicals (fungicides and plant health products), water treatment chemicals, metal surface treatment, and specialty chemical formulations. Its supply chain begins upstream with elemental phosphorus or phosphorus trichloride derived from phosphate rock, which is reacted to produce phosphorous acid (H₃PO₃); this intermediate is then neutralized with sodium hydroxide or sodium carbonate to form sodium phosphite, followed by concentration, crystallization, drying, and quality grading. Midstream producers are integrated inorganic and specialty chemical manufacturers that control phosphorous acid synthesis and salt conversion, ensuring purity and consistency for technical, industrial, or agrochemical grades. Downstream, sodium phosphite is sold either as a raw material to formulators (crop protection, water treatment, and industrial chemical blenders) or directly to end users in agriculture, cooling water systems, metal finishing, and specialty manufacturing, with distribution handled through regional chemical distributors and direct contracts, and logistics typically involving bulk bags, drums, or solution form depending on application requirements. In 2025, global sodium phosphite production reached approximately 380,000 tons against an estimated installed global production capacity of about 460,000 tons per year, with products sold at an average unit price of roughly USD 820–1,450 per ton, while leading manufacturers typically achieved gross margins of around 32%.
The North American market for Sodium Phosphite is projected to increase from US$ million in 2025 to US$ million by 2032, at a CAGR of % over 2026–2032.
The Asia-Pacific market for Sodium Phosphite is projected to rise from US$ million in 2025 to US$ million by 2032, at a CAGR of % over 2026–2032.
Major global manufacturers of Sodium Phosphite include Arkema (France), Solvay (Belgium), Nippon Chemical (Japan), Xingfa Chemicals (China), Kangxiang Industrial (China), Lianxing Chemical (China), Jiangxi Fuerxin Chemical (China), Hubei Sky Lake Chemical (China), Hubei Yihua Chemical (China), Jiangsu Danai Chemical (China), etc. In 2025, the world's top three vendors accounted for approximately % of revenue.
This report delivers a comprehensive overview of the global Sodium Phosphite market, with both quantitative and qualitative analyses, to help readers develop growth strategies, assess the competitive landscape, evaluate their position in the current market, and make informed business decisions regarding Sodium Phosphite. The Sodium Phosphite market size, estimates, and forecasts are provided in terms of output/shipments (Tons) and revenue (US$ millions), with 2025 as the base year and historical and forecast data for 2021–2032.
The report segments the global Sodium Phosphite market comprehensively. Regional market sizes by Type, by Application, by Physical Form, and by company are also provided. For deeper insight, the report profiles the competitive landscape, key competitors, and their respective market rankings, and discusses technological trends and new product developments.
This report will assist Sodium Phosphite manufacturers, new entrants, and companies across the industry value chain with information on revenues, production, and average prices for the overall market and its sub-segments, by company, by Type, by Application, and by region.
Market Segmentation

Scope of Sodium Phosphite Market Report

Report Metric Details
Report Name Sodium Phosphite Market
Accounted market size in 2025 US$ 413 million
Forecasted market size in 2032 US$ 616 million
CAGR 5.9%
Base Year 2025
Forecasted years 2026 - 2032
Segment by Type
  • Monosodium Phosphite (NaH₂PO₃)
  • Disodium Phosphite (Na₂HPO₃)
Segment by Physical Form
  • Crystalline Powder
  • Granular Solid
  • Flake
  • Aqueous Solution
by Application
  • Agrochemical
  • Pulp & Paper
  • Water Treatment
  • Metal Surface Finishing
  • Electronic Manufacturing
  • Industrial Processing
  • Others
Production by Region
  • North America
  • Europe
  • China
  • Japan
  • India
  • Southeast Asia
Consumption by Region
  • North America (United States, Canada)
  • Europe (Germany, France, UK, Italy, Russia)
  • Asia-Pacific (China, Japan, South Korea, Taiwan)
  • Southeast Asia (India)
  • Latin America (Mexico, Brazil)
By Company Arkema (France), Solvay (Belgium), Nippon Chemical (Japan), Xingfa Chemicals (China), Kangxiang Industrial (China), Lianxing Chemical (China), Jiangxi Fuerxin Chemical (China), Hubei Sky Lake Chemical (China), Hubei Yihua Chemical (China), Jiangsu Danai Chemical (China)
Forecast units USD million in value
Report coverage Revenue and volume forecast, company share, competitive landscape, growth factors and trends

Chapter Outline

  • Chapter 1: Defines the scope of the report and presents an executive summary of market segments (by Type, by Application, by Physical Form, etc.), including the size of each segment and its future growth potential. It offers a high-level view of the current market and its likely evolution in the short, medium, and long term.
  • Chapter 2: Provides a detailed analysis of the competitive landscape for Sodium Phosphite manufacturers, including prices, production, value-based market shares, latest development plans, and information on mergers and acquisitions.
  • Chapter 3: Examines Sodium Phosphite production/output and value by region and country, providing a quantitative assessment of market size and growth potential for each region over the next six years.
  • Chapter 4: Analyzes Sodium Phosphite consumption at the regional and country levels. It quantifies market size and growth potential for each region and its key countries, and outlines market development, outlook, addressable space, and national production.
  • Chapter 5: Analyzes market segments by Type, covering the size and growth potential of each segment to help readers identify “blue ocean” opportunities.
  • Chapter 6: Analyzes market segments by Application, covering the size and growth potential of each segment to help readers identify “blue ocean” opportunities in downstream markets.
  • Chapter 7: Profiles key players, detailing the fundamentals of major companies, including product production/output, value, price, gross margin, product portfolio/introductions, and recent developments.
  • Chapter 8: Reviews the industry value chain, including upstream and downstream segments.
  • Chapter 9: Discusses market dynamics and recent developments, including drivers, restraints, challenges and risks for manufacturers, U.S. Tariffs and relevant policy analysis.
  • Chapter 10: Summarizes the key findings and conclusions of the report.

FAQ for this report

How fast is Sodium Phosphite Market growing?

Ans: The Sodium Phosphite Market witnessing a CAGR of 5.9% during the forecast period 2026-2032.

What is the Sodium Phosphite Market size in 2032?

Ans: The Sodium Phosphite Market size in 2032 will be US$ 616 million.

Who are the main players in the Sodium Phosphite Market report?

Ans: The main players in the Sodium Phosphite Market are Arkema (France), Solvay (Belgium), Nippon Chemical (Japan), Xingfa Chemicals (China), Kangxiang Industrial (China), Lianxing Chemical (China), Jiangxi Fuerxin Chemical (China), Hubei Sky Lake Chemical (China), Hubei Yihua Chemical (China), Jiangsu Danai Chemical (China)

What are the Application segmentation covered in the Sodium Phosphite Market report?

Ans: The Applications covered in the Sodium Phosphite Market report are Agrochemical, Pulp & Paper, Water Treatment, Metal Surface Finishing, Electronic Manufacturing, Industrial Processing, Others

What are the Type segmentation covered in the Sodium Phosphite Market report?

Ans: The Types covered in the Sodium Phosphite Market report are Monosodium Phosphite (NaH₂PO₃), Disodium Phosphite (Na₂HPO₃)

1 Sodium Phosphite Market Overview
1.1 Product Definition
1.2 Sodium Phosphite by Type
1.2.1 Global Sodium Phosphite Market Value Growth Rate Analysis by Type: 2025 vs 2032
1.2.2 Monosodium Phosphite (NaH₂PO₃)
1.2.3 Disodium Phosphite (Na₂HPO₃)
1.3 Sodium Phosphite by Physical Form
1.3.1 Global Sodium Phosphite Market Value Growth Rate Analysis by Physical Form: 2025 vs 2032
1.3.2 Crystalline Powder
1.3.3 Granular Solid
1.3.4 Flake
1.3.5 Aqueous Solution
1.4 Sodium Phosphite by Application
1.4.1 Global Sodium Phosphite Market Value Growth Rate Analysis by Application: 2025 vs 2032
1.4.2 Agrochemical
1.4.3 Pulp & Paper
1.4.4 Water Treatment
1.4.5 Metal Surface Finishing
1.4.6 Electronic Manufacturing
1.4.7 Industrial Processing
1.4.8 Others
1.5 Global Market Growth Prospects
1.5.1 Global Sodium Phosphite Production Value Estimates and Forecasts (2021–2032)
1.5.2 Global Sodium Phosphite Production Capacity Estimates and Forecasts (2021–2032)
1.5.3 Global Sodium Phosphite Production Estimates and Forecasts (2021–2032)
1.5.4 Global Sodium Phosphite Market Average Price Estimates and Forecasts (2021–2032)
1.6 Assumptions and Limitations
2 Market Competition by Manufacturers
2.1 Global Sodium Phosphite Production Market Share by Manufacturers (2021–2026)
2.2 Global Sodium Phosphite Production Value Market Share by Manufacturers (2021–2026)
2.3 Global Key Players of Sodium Phosphite, Industry Ranking, 2024 vs 2025
2.4 Global Sodium Phosphite Market Share by Company Tier (Tier 1, Tier 2, Tier 3)
2.5 Global Sodium Phosphite Average Price by Manufacturers (2021–2026)
2.6 Global Key Manufacturers of Sodium Phosphite, Manufacturing Footprints and Headquarters
2.7 Global Key Manufacturers of Sodium Phosphite, Product Offerings and Applications
2.8 Global Key Manufacturers of Sodium Phosphite, Date of Entry into the Industry
2.9 Sodium Phosphite Market Competitive Situation and Trends
2.9.1 Sodium Phosphite Market Concentration Rate
2.9.2 Top 5 and Top 10 Global Sodium Phosphite Players Market Share by Revenue
2.10 Mergers & Acquisitions and Expansion
3 Sodium Phosphite Production by Region
3.1 Global Sodium Phosphite Production Value Estimates and Forecasts by Region: 2021 vs 2025 vs 2032
3.2 Global Sodium Phosphite Production Value by Region (2021–2032)
3.2.1 Global Sodium Phosphite Production Value by Region (2021–2026)
3.2.2 Global Forecasted Production Value of Sodium Phosphite by Region (2027–2032)
3.3 Global Sodium Phosphite Production Estimates and Forecasts by Region: 2021 vs 2025 vs 2032
3.4 Global Sodium Phosphite Production Volume by Region (2021–2032)
3.4.1 Global Sodium Phosphite Production by Region (2021–2026)
3.4.2 Global Forecasted Production of Sodium Phosphite by Region (2027–2032)
3.5 Global Sodium Phosphite Market Price Analysis by Region (2021–2032)
3.6 Global Sodium Phosphite Production, Value, and Year-over-Year Growth
3.6.1 North America Sodium Phosphite Production Value Estimates and Forecasts (2021–2032)
3.6.2 Europe Sodium Phosphite Production Value Estimates and Forecasts (2021–2032)
3.6.3 China Sodium Phosphite Production Value Estimates and Forecasts (2021–2032)
3.6.4 Japan Sodium Phosphite Production Value Estimates and Forecasts (2021–2032)
3.6.5 India Sodium Phosphite Production Value Estimates and Forecasts (2021–2032)
3.6.6 Southeast Asia Sodium Phosphite Production Value Estimates and Forecasts (2021–2032)
4 Sodium Phosphite Consumption by Region
4.1 Global Sodium Phosphite Consumption Estimates and Forecasts by Region: 2021 vs 2025 vs 2032
4.2 Global Sodium Phosphite Consumption by Region (2021–2032)
4.2.1 Global Sodium Phosphite Consumption by Region (2021–2026)
4.2.2 Global Sodium Phosphite Forecasted Consumption by Region (2027–2032)
4.3 North America
4.3.1 North America Sodium Phosphite Consumption Growth Rate by Country: 2021 vs 2025 vs 2032
4.3.2 North America Sodium Phosphite Consumption by Country (2021–2032)
4.3.3 U.S.
4.3.4 Canada
4.4 Europe
4.4.1 Europe Sodium Phosphite Consumption Growth Rate by Country: 2021 vs 2025 vs 2032
4.4.2 Europe Sodium Phosphite Consumption by Country (2021–2032)
4.4.3 Germany
4.4.4 France
4.4.5 U.K.
4.4.6 Italy
4.4.7 Russia
4.5 Asia Pacific
4.5.1 Asia Pacific Sodium Phosphite Consumption Growth Rate by Region: 2021 vs 2025 vs 2032
4.5.2 Asia Pacific Sodium Phosphite Consumption by Region (2021–2032)
4.5.3 China
4.5.4 Japan
4.5.5 South Korea
4.5.6 China Taiwan
4.5.7 Southeast Asia
4.5.8 India
4.6 Latin America, Middle East & Africa
4.6.1 Latin America, Middle East & Africa Sodium Phosphite Consumption Growth Rate by Country: 2021 vs 2025 vs 2032
4.6.2 Latin America, Middle East & Africa Sodium Phosphite Consumption by Country (2021–2032)
4.6.3 Mexico
4.6.4 Brazil
4.6.5 Turkey
4.6.6 GCC Countries
5 Segment by Type
5.1 Global Sodium Phosphite Production by Type (2021–2032)
5.1.1 Global Sodium Phosphite Production by Type (2021–2026)
5.1.2 Global Sodium Phosphite Production by Type (2027–2032)
5.1.3 Global Sodium Phosphite Production Market Share by Type (2021–2032)
5.2 Global Sodium Phosphite Production Value by Type (2021–2032)
5.2.1 Global Sodium Phosphite Production Value by Type (2021–2026)
5.2.2 Global Sodium Phosphite Production Value by Type (2027–2032)
5.2.3 Global Sodium Phosphite Production Value Market Share by Type (2021–2032)
5.3 Global Sodium Phosphite Price by Type (2021–2032)
6 Segment by Application
6.1 Global Sodium Phosphite Production by Application (2021–2032)
6.1.1 Global Sodium Phosphite Production by Application (2021–2026)
6.1.2 Global Sodium Phosphite Production by Application (2027–2032)
6.1.3 Global Sodium Phosphite Production Market Share by Application (2021–2032)
6.2 Global Sodium Phosphite Production Value by Application (2021–2032)
6.2.1 Global Sodium Phosphite Production Value by Application (2021–2026)
6.2.2 Global Sodium Phosphite Production Value by Application (2027–2032)
6.2.3 Global Sodium Phosphite Production Value Market Share by Application (2021–2032)
6.3 Global Sodium Phosphite Price by Application (2021–2032)
7 Key Companies Profiled
7.1 Arkema (France)
7.1.1 Arkema (France) Sodium Phosphite Company Information
7.1.2 Arkema (France) Sodium Phosphite Product Portfolio
7.1.3 Arkema (France) Sodium Phosphite Production, Value, Price, and Gross Margin (2021–2026)
7.1.4 Arkema (France) Main Business and Markets Served
7.1.5 Arkema (France) Recent Developments/Updates
7.2 Solvay (Belgium)
7.2.1 Solvay (Belgium) Sodium Phosphite Company Information
7.2.2 Solvay (Belgium) Sodium Phosphite Product Portfolio
7.2.3 Solvay (Belgium) Sodium Phosphite Production, Value, Price, and Gross Margin (2021–2026)
7.2.4 Solvay (Belgium) Main Business and Markets Served
7.2.5 Solvay (Belgium) Recent Developments/Updates
7.3 Nippon Chemical (Japan)
7.3.1 Nippon Chemical (Japan) Sodium Phosphite Company Information
7.3.2 Nippon Chemical (Japan) Sodium Phosphite Product Portfolio
7.3.3 Nippon Chemical (Japan) Sodium Phosphite Production, Value, Price, and Gross Margin (2021–2026)
7.3.4 Nippon Chemical (Japan) Main Business and Markets Served
7.3.5 Nippon Chemical (Japan) Recent Developments/Updates
7.4 Xingfa Chemicals (China)
7.4.1 Xingfa Chemicals (China) Sodium Phosphite Company Information
7.4.2 Xingfa Chemicals (China) Sodium Phosphite Product Portfolio
7.4.3 Xingfa Chemicals (China) Sodium Phosphite Production, Value, Price, and Gross Margin (2021–2026)
7.4.4 Xingfa Chemicals (China) Main Business and Markets Served
7.4.5 Xingfa Chemicals (China) Recent Developments/Updates
7.5 Kangxiang Industrial (China)
7.5.1 Kangxiang Industrial (China) Sodium Phosphite Company Information
7.5.2 Kangxiang Industrial (China) Sodium Phosphite Product Portfolio
7.5.3 Kangxiang Industrial (China) Sodium Phosphite Production, Value, Price, and Gross Margin (2021–2026)
7.5.4 Kangxiang Industrial (China) Main Business and Markets Served
7.5.5 Kangxiang Industrial (China) Recent Developments/Updates
7.6 Lianxing Chemical (China)
7.6.1 Lianxing Chemical (China) Sodium Phosphite Company Information
7.6.2 Lianxing Chemical (China) Sodium Phosphite Product Portfolio
7.6.3 Lianxing Chemical (China) Sodium Phosphite Production, Value, Price, and Gross Margin (2021–2026)
7.6.4 Lianxing Chemical (China) Main Business and Markets Served
7.6.5 Lianxing Chemical (China) Recent Developments/Updates
7.7 Jiangxi Fuerxin Chemical (China)
7.7.1 Jiangxi Fuerxin Chemical (China) Sodium Phosphite Company Information
7.7.2 Jiangxi Fuerxin Chemical (China) Sodium Phosphite Product Portfolio
7.7.3 Jiangxi Fuerxin Chemical (China) Sodium Phosphite Production, Value, Price, and Gross Margin (2021–2026)
7.7.4 Jiangxi Fuerxin Chemical (China) Main Business and Markets Served
7.7.5 Jiangxi Fuerxin Chemical (China) Recent Developments/Updates
7.8 Hubei Sky Lake Chemical (China)
7.8.1 Hubei Sky Lake Chemical (China) Sodium Phosphite Company Information
7.8.2 Hubei Sky Lake Chemical (China) Sodium Phosphite Product Portfolio
7.8.3 Hubei Sky Lake Chemical (China) Sodium Phosphite Production, Value, Price, and Gross Margin (2021–2026)
7.8.4 Hubei Sky Lake Chemical (China) Main Business and Markets Served
7.8.5 Hubei Sky Lake Chemical (China) Recent Developments/Updates
7.9 Hubei Yihua Chemical (China)
7.9.1 Hubei Yihua Chemical (China) Sodium Phosphite Company Information
7.9.2 Hubei Yihua Chemical (China) Sodium Phosphite Product Portfolio
7.9.3 Hubei Yihua Chemical (China) Sodium Phosphite Production, Value, Price, and Gross Margin (2021–2026)
7.9.4 Hubei Yihua Chemical (China) Main Business and Markets Served
7.9.5 Hubei Yihua Chemical (China) Recent Developments/Updates
7.10 Jiangsu Danai Chemical (China)
7.10.1 Jiangsu Danai Chemical (China) Sodium Phosphite Company Information
7.10.2 Jiangsu Danai Chemical (China) Sodium Phosphite Product Portfolio
7.10.3 Jiangsu Danai Chemical (China) Sodium Phosphite Production, Value, Price, and Gross Margin (2021–2026)
7.10.4 Jiangsu Danai Chemical (China) Main Business and Markets Served
7.10.5 Jiangsu Danai Chemical (China) Recent Developments/Updates
8 Industry Chain and Sales Channels Analysis
8.1 Sodium Phosphite Industry Chain Analysis
8.2 Sodium Phosphite Raw Material Supply Analysis
8.2.1 Key Raw Materials
8.2.2 Raw Materials Key Suppliers
8.3 Sodium Phosphite Production Modes and Processes
8.4 Sodium Phosphite Sales and Marketing
8.4.1 Sodium Phosphite Sales Channels
8.4.2 Sodium Phosphite Distributors
8.5 Sodium Phosphite Customer Analysis
9 Sodium Phosphite Market Dynamics
9.1 Sodium Phosphite Industry Trends
9.2 Sodium Phosphite Market Drivers
9.3 Sodium Phosphite Market Challenges
9.4 Sodium Phosphite Market Restraints
9.5 Impact of U.S. Tariffs
10 Research Findings and Conclusion
11 Methodology and Data Source
11.1 Methodology/Research Approach
11.1.1 Research Programs/Design
11.1.2 Market Size Estimation
11.1.3 Market Breakdown and Data Triangulation
11.2 Data Source
11.2.1 Secondary Sources
11.2.2 Primary Sources
11.3 Author List
11.4 Disclaimer
List of Tables
 Table 1. Global Sodium Phosphite Market Value by Type (US$ Million), 2025 vs 2032
 Table 2. Global Sodium Phosphite Market Value by Physical Form (US$ Million), 2025 vs 2032
 Table 3. Global Sodium Phosphite Market Value by Application (US$ Million), 2025 vs 2032
 Table 4. Global Sodium Phosphite Production Capacity (Tons) by Manufacturers in 2025
 Table 5. Global Sodium Phosphite Production by Manufacturers (Tons), 2021–2026
 Table 6. Global Sodium Phosphite Production Market Share by Manufacturers (2021–2026)
 Table 7. Global Sodium Phosphite Production Value by Manufacturers (US$ Million), 2021–2026
 Table 8. Global Sodium Phosphite Production Value Share by Manufacturers (2021–2026)
 Table 9. Global Key Players of Sodium Phosphite, Industry Ranking, 2024 vs 2025
 Table 10. Classification of Companies by Tier (Tier 1, Tier 2, Tier 3), based on Sodium Phosphite Production Value, 2025
 Table 11. Global Market Sodium Phosphite Average Price by Manufacturers (US$/Ton), 2021–2026
 Table 12. Global Key Manufacturers of Sodium Phosphite, Manufacturing Footprints and Headquarters
 Table 13. Global Key Manufacturers of Sodium Phosphite, Product Offerings and Applications
 Table 14. Global Key Manufacturers of Sodium Phosphite, Date of Entry into the Industry
 Table 15. Global Sodium Phosphite Manufacturers Market Concentration Ratio (CR5 and HHI)
 Table 16. Mergers & Acquisitions and Expansion Plans
 Table 17. Global Sodium Phosphite Production Value by Region: 2021 vs 2025 vs 2032 (US$ Million)
 Table 18. Global Sodium Phosphite Production Value (US$ Million) by Region (2021–2026)
 Table 19. Global Sodium Phosphite Production Value Market Share by Region (2021–2026)
 Table 20. Global Sodium Phosphite Production Value (US$ Million) Forecast by Region (2027–2032)
 Table 21. Global Sodium Phosphite Production Value Market Share Forecast by Region (2027–2032)
 Table 22. Global Sodium Phosphite Production Comparison by Region: 2021 vs 2025 vs 2032 (Tons)
 Table 23. Global Sodium Phosphite Production (Tons) by Region (2021–2026)
 Table 24. Global Sodium Phosphite Production Market Share by Region (2021–2026)
 Table 25. Global Sodium Phosphite Production (Tons) Forecast by Region (2027–2032)
 Table 26. Global Sodium Phosphite Production Market Share Forecast by Region (2027–2032)
 Table 27. Global Sodium Phosphite Market Average Price (US$/Ton) by Region (2021–2026)
 Table 28. Global Sodium Phosphite Market Average Price (US$/Ton) by Region (2027–2032)
 Table 29. Global Sodium Phosphite Consumption Growth Rate by Region: 2021 vs 2025 vs 2032 (Tons)
 Table 30. Global Sodium Phosphite Consumption by Region (Tons), 2021–2026
 Table 31. Global Sodium Phosphite Consumption Market Share by Region (2021–2026)
 Table 32. Global Sodium Phosphite Forecasted Consumption by Region (Tons), 2027–2032
 Table 33. Global Sodium Phosphite Forecasted Consumption Market Share by Region (2027–2032)
 Table 34. North America Sodium Phosphite Consumption Growth Rate by Country: 2021 vs 2025 vs 2032 (Tons)
 Table 35. North America Sodium Phosphite Consumption by Country (Tons), 2021–2026
 Table 36. North America Sodium Phosphite Consumption by Country (Tons), 2027–2032
 Table 37. Europe Sodium Phosphite Consumption Growth Rate by Country: 2021 vs 2025 vs 2032 (Tons)
 Table 38. Europe Sodium Phosphite Consumption by Country (Tons), 2021–2026
 Table 39. Europe Sodium Phosphite Consumption by Country (Tons), 2027–2032
 Table 40. Asia Pacific Sodium Phosphite Consumption Growth Rate by Region: 2021 vs 2025 vs 2032 (Tons)
 Table 41. Asia Pacific Sodium Phosphite Consumption by Region (Tons), 2021–2026
 Table 42. Asia Pacific Sodium Phosphite Consumption by Region (Tons), 2027–2032
 Table 43. Latin America, Middle East & Africa Sodium Phosphite Consumption Growth Rate by Country: 2021 vs 2025 vs 2032 (Tons)
 Table 44. Latin America, Middle East & Africa Sodium Phosphite Consumption by Country (Tons), 2021–2026
 Table 45. Latin America, Middle East & Africa Sodium Phosphite Consumption by Country (Tons), 2027–2032
 Table 46. Global Sodium Phosphite Production (Tons) by Type (2021–2026)
 Table 47. Global Sodium Phosphite Production (Tons) by Type (2027–2032)
 Table 48. Global Sodium Phosphite Production Market Share by Type (2021–2026)
 Table 49. Global Sodium Phosphite Production Market Share by Type (2027–2032)
 Table 50. Global Sodium Phosphite Production Value (US$ Million) by Type (2021–2026)
 Table 51. Global Sodium Phosphite Production Value (US$ Million) by Type (2027–2032)
 Table 52. Global Sodium Phosphite Production Value Market Share by Type (2021–2026)
 Table 53. Global Sodium Phosphite Production Value Market Share by Type (2027–2032)
 Table 54. Global Sodium Phosphite Price (US$/Ton) by Type (2021–2026)
 Table 55. Global Sodium Phosphite Price (US$/Ton) by Type (2027–2032)
 Table 56. Global Sodium Phosphite Production (Tons) by Application (2021–2026)
 Table 57. Global Sodium Phosphite Production (Tons) by Application (2027–2032)
 Table 58. Global Sodium Phosphite Production Market Share by Application (2021–2026)
 Table 59. Global Sodium Phosphite Production Market Share by Application (2027–2032)
 Table 60. Global Sodium Phosphite Production Value (US$ Million) by Application (2021–2026)
 Table 61. Global Sodium Phosphite Production Value (US$ Million) by Application (2027–2032)
 Table 62. Global Sodium Phosphite Production Value Market Share by Application (2021–2026)
 Table 63. Global Sodium Phosphite Production Value Market Share by Application (2027–2032)
 Table 64. Global Sodium Phosphite Price (US$/Ton) by Application (2021–2026)
 Table 65. Global Sodium Phosphite Price (US$/Ton) by Application (2027–2032)
 Table 66. Arkema (France) Sodium Phosphite Company Information
 Table 67. Arkema (France) Sodium Phosphite Specification and Application
 Table 68. Arkema (France) Sodium Phosphite Production (Tons), Value (US$ Million), Price (US$/Ton) and Gross Margin (2021–2026)
 Table 69. Arkema (France) Main Business and Markets Served
 Table 70. Arkema (France) Recent Developments/Updates
 Table 71. Solvay (Belgium) Sodium Phosphite Company Information
 Table 72. Solvay (Belgium) Sodium Phosphite Specification and Application
 Table 73. Solvay (Belgium) Sodium Phosphite Production (Tons), Value (US$ Million), Price (US$/Ton) and Gross Margin (2021–2026)
 Table 74. Solvay (Belgium) Main Business and Markets Served
 Table 75. Solvay (Belgium) Recent Developments/Updates
 Table 76. Nippon Chemical (Japan) Sodium Phosphite Company Information
 Table 77. Nippon Chemical (Japan) Sodium Phosphite Specification and Application
 Table 78. Nippon Chemical (Japan) Sodium Phosphite Production (Tons), Value (US$ Million), Price (US$/Ton) and Gross Margin (2021–2026)
 Table 79. Nippon Chemical (Japan) Main Business and Markets Served
 Table 80. Nippon Chemical (Japan) Recent Developments/Updates
 Table 81. Xingfa Chemicals (China) Sodium Phosphite Company Information
 Table 82. Xingfa Chemicals (China) Sodium Phosphite Specification and Application
 Table 83. Xingfa Chemicals (China) Sodium Phosphite Production (Tons), Value (US$ Million), Price (US$/Ton) and Gross Margin (2021–2026)
 Table 84. Xingfa Chemicals (China) Main Business and Markets Served
 Table 85. Xingfa Chemicals (China) Recent Developments/Updates
 Table 86. Kangxiang Industrial (China) Sodium Phosphite Company Information
 Table 87. Kangxiang Industrial (China) Sodium Phosphite Specification and Application
 Table 88. Kangxiang Industrial (China) Sodium Phosphite Production (Tons), Value (US$ Million), Price (US$/Ton) and Gross Margin (2021–2026)
 Table 89. Kangxiang Industrial (China) Main Business and Markets Served
 Table 90. Kangxiang Industrial (China) Recent Developments/Updates
 Table 91. Lianxing Chemical (China) Sodium Phosphite Company Information
 Table 92. Lianxing Chemical (China) Sodium Phosphite Specification and Application
 Table 93. Lianxing Chemical (China) Sodium Phosphite Production (Tons), Value (US$ Million), Price (US$/Ton) and Gross Margin (2021–2026)
 Table 94. Lianxing Chemical (China) Main Business and Markets Served
 Table 95. Lianxing Chemical (China) Recent Developments/Updates
 Table 96. Jiangxi Fuerxin Chemical (China) Sodium Phosphite Company Information
 Table 97. Jiangxi Fuerxin Chemical (China) Sodium Phosphite Specification and Application
 Table 98. Jiangxi Fuerxin Chemical (China) Sodium Phosphite Production (Tons), Value (US$ Million), Price (US$/Ton) and Gross Margin (2021–2026)
 Table 99. Jiangxi Fuerxin Chemical (China) Main Business and Markets Served
 Table 100. Jiangxi Fuerxin Chemical (China) Recent Developments/Updates
 Table 101. Hubei Sky Lake Chemical (China) Sodium Phosphite Company Information
 Table 102. Hubei Sky Lake Chemical (China) Sodium Phosphite Specification and Application
 Table 103. Hubei Sky Lake Chemical (China) Sodium Phosphite Production (Tons), Value (US$ Million), Price (US$/Ton) and Gross Margin (2021–2026)
 Table 104. Hubei Sky Lake Chemical (China) Main Business and Markets Served
 Table 105. Hubei Sky Lake Chemical (China) Recent Developments/Updates
 Table 106. Hubei Yihua Chemical (China) Sodium Phosphite Company Information
 Table 107. Hubei Yihua Chemical (China) Sodium Phosphite Specification and Application
 Table 108. Hubei Yihua Chemical (China) Sodium Phosphite Production (Tons), Value (US$ Million), Price (US$/Ton) and Gross Margin (2021–2026)
 Table 109. Hubei Yihua Chemical (China) Main Business and Markets Served
 Table 110. Hubei Yihua Chemical (China) Recent Developments/Updates
 Table 111. Jiangsu Danai Chemical (China) Sodium Phosphite Company Information
 Table 112. Jiangsu Danai Chemical (China) Sodium Phosphite Specification and Application
 Table 113. Jiangsu Danai Chemical (China) Sodium Phosphite Production (Tons), Value (US$ Million), Price (US$/Ton) and Gross Margin (2021–2026)
 Table 114. Jiangsu Danai Chemical (China) Main Business and Markets Served
 Table 115. Jiangsu Danai Chemical (China) Recent Developments/Updates
 Table 116. Key Raw Materials Lists
 Table 117. Raw Materials Key Suppliers Lists
 Table 118. Sodium Phosphite Distributors List
 Table 119. Sodium Phosphite Customers List
 Table 120. Sodium Phosphite Market Trends
 Table 121. Sodium Phosphite Market Drivers
 Table 122. Sodium Phosphite Market Challenges
 Table 123. Sodium Phosphite Market Restraints
 Table 124. Research Programs/Design for This Report
 Table 125. Key Data Information from Secondary Sources
 Table 126. Key Data Information from Primary Sources
 Table 127. Authors List of This Report


List of Figures
 Figure 1. Product Picture of Sodium Phosphite
 Figure 2. Global Sodium Phosphite Market Value by Type (US$ Million), 2021–2032
 Figure 3. Global Sodium Phosphite Market Share by Type: 2025 vs 2032
 Figure 4. Monosodium Phosphite (NaH₂PO₃) Product Picture
 Figure 5. Disodium Phosphite (Na₂HPO₃) Product Picture
 Figure 6. Global Sodium Phosphite Market Value by Physical Form (US$ Million), 2021–2032
 Figure 7. Global Sodium Phosphite Market Share by Physical Form: 2025 vs 2032
 Figure 8. Crystalline Powder Product Picture
 Figure 9. Granular Solid Product Picture
 Figure 10. Flake Product Picture
 Figure 11. Aqueous Solution Product Picture
 Figure 12. Global Sodium Phosphite Market Value by Application (US$ Million), 2021–2032
 Figure 13. Global Sodium Phosphite Market Share by Application: 2025 vs 2032
 Figure 14. Agrochemical
 Figure 15. Pulp & Paper
 Figure 16. Water Treatment
 Figure 17. Metal Surface Finishing
 Figure 18. Electronic Manufacturing
 Figure 19. Industrial Processing
 Figure 20. Others
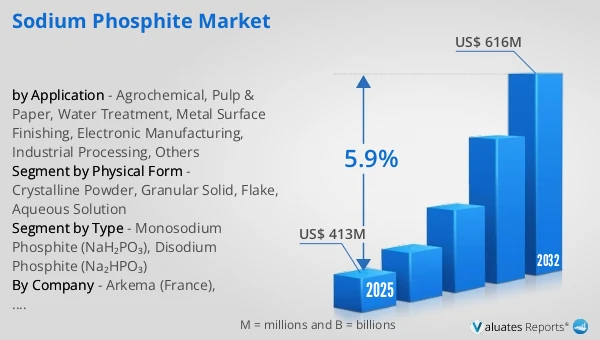
 Figure 21. Global Sodium Phosphite Production Value (US$ Million), 2021 vs 2025 vs 2032
 Figure 22. Global Sodium Phosphite Production Value (US$ Million), 2021–2032
 Figure 23. Global Sodium Phosphite Production Capacity (Tons), 2021–2032
 Figure 24. Global Sodium Phosphite Production (Tons), 2021–2032
 Figure 25. Global Sodium Phosphite Average Price (US$/Ton), 2021–2032
 Figure 26. Sodium Phosphite Report Years Considered
 Figure 27. Sodium Phosphite Production Share by Manufacturers in 2025
 Figure 28. Global Sodium Phosphite Production Value Share by Manufacturers (2025)
 Figure 29. Sodium Phosphite Market Share by Company Type (Tier 1, Tier 2, and Tier 3): 2021 vs 2025
 Figure 30. Top 5 and Top 10 Global Players: Market Share by Sodium Phosphite Revenue in 2025
 Figure 31. Global Sodium Phosphite Production Value by Region: 2021 vs 2025 vs 2032 (US$ Million)
 Figure 32. Global Sodium Phosphite Production Value Market Share by Region: 2021 vs 2025 vs 2032
 Figure 33. Global Sodium Phosphite Production Comparison by Region: 2021 vs 2025 vs 2032 (Tons)
 Figure 34. Global Sodium Phosphite Production Market Share by Region: 2021 vs 2025 vs 2032
 Figure 35. North America Sodium Phosphite Production Value (US$ Million) Growth Rate (2021–2032)
 Figure 36. Europe Sodium Phosphite Production Value (US$ Million) Growth Rate (2021–2032)
 Figure 37. China Sodium Phosphite Production Value (US$ Million) Growth Rate (2021–2032)
 Figure 38. Japan Sodium Phosphite Production Value (US$ Million) Growth Rate (2021–2032)
 Figure 39. India Sodium Phosphite Production Value (US$ Million) Growth Rate (2021–2032)
 Figure 40. Southeast Asia Sodium Phosphite Production Value (US$ Million) Growth Rate (2021–2032)
 Figure 41. Global Sodium Phosphite Consumption by Region: 2021 vs 2025 vs 2032 (Tons)
 Figure 42. Global Sodium Phosphite Consumption Market Share by Region: 2021 vs 2025 vs 2032
 Figure 43. North America Sodium Phosphite Consumption and Growth Rate (Tons), 2021–2032
 Figure 44. North America Sodium Phosphite Consumption Market Share by Country (2021–2032)
 Figure 45. U.S. Sodium Phosphite Consumption and Growth Rate (Tons), 2021–2032
 Figure 46. Canada Sodium Phosphite Consumption and Growth Rate (Tons), 2021–2032
 Figure 47. Europe Sodium Phosphite Consumption and Growth Rate (Tons), 2021–2032
 Figure 48. Europe Sodium Phosphite Consumption Market Share by Country (2021–2032)
 Figure 49. Germany Sodium Phosphite Consumption and Growth Rate (Tons), 2021–2032
 Figure 50. France Sodium Phosphite Consumption and Growth Rate (Tons), 2021–2032
 Figure 51. U.K. Sodium Phosphite Consumption and Growth Rate (Tons), 2021–2032
 Figure 52. Italy Sodium Phosphite Consumption and Growth Rate (Tons), 2021–2032
 Figure 53. Russia Sodium Phosphite Consumption and Growth Rate (Tons), 2021–2032
 Figure 54. Asia Pacific Sodium Phosphite Consumption and Growth Rate (Tons), 2021–2032
 Figure 55. Asia Pacific Sodium Phosphite Consumption Market Share by Region (2021–2032)
 Figure 56. China Sodium Phosphite Consumption and Growth Rate (Tons), 2021–2032
 Figure 57. Japan Sodium Phosphite Consumption and Growth Rate (Tons), 2021–2032
 Figure 58. South Korea Sodium Phosphite Consumption and Growth Rate (Tons), 2021–2032
 Figure 59. China Taiwan Sodium Phosphite Consumption and Growth Rate (Tons), 2021–2032
 Figure 60. Southeast Asia Sodium Phosphite Consumption and Growth Rate (Tons), 2021–2032
 Figure 61. India Sodium Phosphite Consumption and Growth Rate (Tons), 2021–2032
 Figure 62. Latin America, Middle East & Africa Sodium Phosphite Consumption and Growth Rate (Tons), 2021–2032
 Figure 63. Latin America, Middle East & Africa Sodium Phosphite Consumption Market Share by Country (2021–2032)
 Figure 64. Mexico Sodium Phosphite Consumption and Growth Rate (Tons), 2021–2032
 Figure 65. Brazil Sodium Phosphite Consumption and Growth Rate (Tons), 2021–2032
 Figure 66. Turkey Sodium Phosphite Consumption and Growth Rate (Tons), 2021–2032
 Figure 67. GCC Countries Sodium Phosphite Consumption and Growth Rate (Tons), 2021–2032
 Figure 68. Global Production Market Share of Sodium Phosphite by Type (2021–2032)
 Figure 69. Global Production Value Market Share of Sodium Phosphite by Type (2021–2032)
 Figure 70. Global Sodium Phosphite Price (US$/Ton) by Type (2021–2032)
 Figure 71. Global Production Market Share of Sodium Phosphite by Application (2021–2032)
 Figure 72. Global Production Value Market Share of Sodium Phosphite by Application (2021–2032)
 Figure 73. Global Sodium Phosphite Price (US$/Ton) by Application (2021–2032)
 Figure 74. Sodium Phosphite Value Chain
 Figure 75. Channels of Distribution (Direct Vs Distribution)
 Figure 76. Bottom-up and Top-down Approaches for This Report
 Figure 77. Data Triangulation
SELECT A FORMAT
Added to Cart
Electronic

$2900

Single User License
Electronic

$4350

Multi User License
Electronic

$5800

Enterprise License
Add to Cart
Buy Now (15% Discount)

OUR CUSTOMER

Samsung SD

SIMILAR REPORTS