List of Tables
Table 1. Global Stereo Matching / Depth Map Generation Algorithms Market Size Growth Rate by Type (US$ Million): 2021 vs 2025 vs 2032
Table 2. Key Players of Traditional Stereo Matching Algorithms
Table 3. Key Players of Deep Learning-Based Stereo Matching
Table 4. Key Players of Hybrid Stereo + LiDAR Fusion Methods
Table 5. Key Players of Multi-View Stereo (MVS) Reconstruction
Table 6. Key Players of Real-Time Stereo SLAM Systems
Table 7. Global Stereo Matching / Depth Map Generation Algorithms Market Size Growth Rate by Component (US$ Million): 2021 vs 2025 vs 2032
Table 8. Key Players of Software (SDKs, APIs, Standalone Platforms)
Table 9. Key Players of Hardware-Integrated Systems
Table 10. Key Players of Cloud-Based Processing Platforms
Table 11. Key Players of Edge AI Vision Chips / Embedded Modules
Table 12. Global Stereo Matching / Depth Map Generation Algorithms Market Size Growth Rate by Deployment Mode (US$ Million): 2021 vs 2025 vs 2032
Table 13. Key Players of On-Premise Systems
Table 14. Key Players of Cloud-Based Platforms (SaaS / API Services)
Table 15. Key Players of Edge Deployment (Robotics, Drones, Automotive ECUs)
Table 16. Key Players of Hybrid Deployment
Table 17. Global Stereo Matching / Depth Map Generation Algorithms Market Size Growth by Application (US$ Million): 2021 vs 2025 vs 2032
Table 18. Global Stereo Matching / Depth Map Generation Algorithms Market Size by Region (US$ Million): 2021 vs 2025 vs 2032
Table 19. Global Stereo Matching / Depth Map Generation Algorithms Market Size by Region (US$ Million), 2021–2026
Table 20. Global Stereo Matching / Depth Map Generation Algorithms Market Share by Region (2021–2026)
Table 21. Global Stereo Matching / Depth Map Generation Algorithms Forecasted Market Size by Region (US$ Million), 2027–2032
Table 22. Global Stereo Matching / Depth Map Generation Algorithms Market Share by Region (2027–2032)
Table 23. Stereo Matching / Depth Map Generation Algorithms Market Trends
Table 24. Stereo Matching / Depth Map Generation Algorithms Market Drivers
Table 25. Stereo Matching / Depth Map Generation Algorithms Market Challenges
Table 26. Stereo Matching / Depth Map Generation Algorithms Market Restraints
Table 27. Global Stereo Matching / Depth Map Generation Algorithms Revenue by Players (US$ Million), 2021–2026
Table 28. Global Stereo Matching / Depth Map Generation Algorithms Market Share by Players (2021–2026)
Table 29. Global Top Stereo Matching / Depth Map Generation Algorithms Players by Tier (Tier 1, Tier 2, and Tier 3), based on Stereo Matching / Depth Map Generation Algorithms Revenue, 2025
Table 30. Ranking of Global Top Stereo Matching / Depth Map Generation Algorithms Companies by Revenue (US$ Million) in 2025
Table 31. Global 5 Largest Players Market Share by Stereo Matching / Depth Map Generation Algorithms Revenue (CR5 and HHI), 2021–2026
Table 32. Global Key Players of Stereo Matching / Depth Map Generation Algorithms, Headquarters and Area Served
Table 33. Global Key Players of Stereo Matching / Depth Map Generation Algorithms, Products and Applications
Table 34. Global Key Players of Stereo Matching / Depth Map Generation Algorithms, Date of General Availability (GA)
Table 35. Mergers and Acquisitions, Expansion Plans
Table 36. Global Stereo Matching / Depth Map Generation Algorithms Market Size by Type (US$ Million), 2021–2026
Table 37. Global Stereo Matching / Depth Map Generation Algorithms Revenue Market Share by Type (2021–2026)
Table 38. Global Stereo Matching / Depth Map Generation Algorithms Forecasted Market Size by Type (US$ Million), 2027–2032
Table 39. Global Stereo Matching / Depth Map Generation Algorithms Revenue Market Share by Type (2027–2032)
Table 40. Global Stereo Matching / Depth Map Generation Algorithms Market Size by Application (US$ Million), 2021–2026
Table 41. Global Stereo Matching / Depth Map Generation Algorithms Revenue Market Share by Application (2021–2026)
Table 42. Global Stereo Matching / Depth Map Generation Algorithms Forecasted Market Size by Application (US$ Million), 2027–2032
Table 43. Global Stereo Matching / Depth Map Generation Algorithms Revenue Market Share by Application (2027–2032)
Table 44. North America Stereo Matching / Depth Map Generation Algorithms Market Size Growth Rate by Country (US$ Million): 2021 vs 2025 vs 2032
Table 45. North America Stereo Matching / Depth Map Generation Algorithms Market Size by Country (US$ Million), 2021–2026
Table 46. North America Stereo Matching / Depth Map Generation Algorithms Market Size by Country (US$ Million), 2027–2032
Table 47. Europe Stereo Matching / Depth Map Generation Algorithms Market Size Growth Rate by Country (US$ Million): 2021 vs 2025 vs 2032
Table 48. Europe Stereo Matching / Depth Map Generation Algorithms Market Size by Country (US$ Million), 2021–2026
Table 49. Europe Stereo Matching / Depth Map Generation Algorithms Market Size by Country (US$ Million), 2027–2032
Table 50. Asia-Pacific Stereo Matching / Depth Map Generation Algorithms Market Size Growth Rate by Region (US$ Million): 2021 vs 2025 vs 2032
Table 51. Asia-Pacific Stereo Matching / Depth Map Generation Algorithms Market Size by Region (US$ Million), 2021–2026
Table 52. Asia-Pacific Stereo Matching / Depth Map Generation Algorithms Market Size by Region (US$ Million), 2027–2032
Table 53. Latin America Stereo Matching / Depth Map Generation Algorithms Market Size Growth Rate by Country (US$ Million): 2021 vs 2025 vs 2032
Table 54. Latin America Stereo Matching / Depth Map Generation Algorithms Market Size by Country (US$ Million), 2021–2026
Table 55. Latin America Stereo Matching / Depth Map Generation Algorithms Market Size by Country (US$ Million), 2027–2032
Table 56. Middle East & Africa Stereo Matching / Depth Map Generation Algorithms Market Size Growth Rate by Country (US$ Million): 2021 vs 2025 vs 2032
Table 57. Middle East & Africa Stereo Matching / Depth Map Generation Algorithms Market Size by Country (US$ Million), 2021–2026
Table 58. Middle East & Africa Stereo Matching / Depth Map Generation Algorithms Market Size by Country (US$ Million), 2027–2032
Table 59. NVIDIA Company Details
Table 60. NVIDIA Business Overview
Table 61. NVIDIA Stereo Matching / Depth Map Generation Algorithms Product
Table 62. NVIDIA Revenue in Stereo Matching / Depth Map Generation Algorithms Business (US$ Million), 2021–2026
Table 63. NVIDIA Recent Development
Table 64. Intel Corporation (RealSense) Company Details
Table 65. Intel Corporation (RealSense) Business Overview
Table 66. Intel Corporation (RealSense) Stereo Matching / Depth Map Generation Algorithms Product
Table 67. Intel Corporation (RealSense) Revenue in Stereo Matching / Depth Map Generation Algorithms Business (US$ Million), 2021–2026
Table 68. Intel Corporation (RealSense) Recent Development
Table 69. Mobileye Company Details
Table 70. Mobileye Business Overview
Table 71. Mobileye Stereo Matching / Depth Map Generation Algorithms Product
Table 72. Mobileye Revenue in Stereo Matching / Depth Map Generation Algorithms Business (US$ Million), 2021–2026
Table 73. Mobileye Recent Development
Table 74. Qualcomm Technologies, Inc. Company Details
Table 75. Qualcomm Technologies, Inc. Business Overview
Table 76. Qualcomm Technologies, Inc. Stereo Matching / Depth Map Generation Algorithms Product
Table 77. Qualcomm Technologies, Inc. Revenue in Stereo Matching / Depth Map Generation Algorithms Business (US$ Million), 2021–2026
Table 78. Qualcomm Technologies, Inc. Recent Development
Table 79. Sony Group Corporation Company Details
Table 80. Sony Group Corporation Business Overview
Table 81. Sony Group Corporation Stereo Matching / Depth Map Generation Algorithms Product
Table 82. Sony Group Corporation Revenue in Stereo Matching / Depth Map Generation Algorithms Business (US$ Million), 2021–2026
Table 83. Sony Group Corporation Recent Development
Table 84. Canon Inc. Company Details
Table 85. Canon Inc. Business Overview
Table 86. Canon Inc. Stereo Matching / Depth Map Generation Algorithms Product
Table 87. Canon Inc. Revenue in Stereo Matching / Depth Map Generation Algorithms Business (US$ Million), 2021–2026
Table 88. Canon Inc. Recent Development
Table 89. Samsung Electronics Company Details
Table 90. Samsung Electronics Business Overview
Table 91. Samsung Electronics Stereo Matching / Depth Map Generation Algorithms Product
Table 92. Samsung Electronics Revenue in Stereo Matching / Depth Map Generation Algorithms Business (US$ Million), 2021–2026
Table 93. Samsung Electronics Recent Development
Table 94. Bosch Mobility Solutions Company Details
Table 95. Bosch Mobility Solutions Business Overview
Table 96. Bosch Mobility Solutions Stereo Matching / Depth Map Generation Algorithms Product
Table 97. Bosch Mobility Solutions Revenue in Stereo Matching / Depth Map Generation Algorithms Business (US$ Million), 2021–2026
Table 98. Bosch Mobility Solutions Recent Development
Table 99. Continental AG Company Details
Table 100. Continental AG Business Overview
Table 101. Continental AG Stereo Matching / Depth Map Generation Algorithms Product
Table 102. Continental AG Revenue in Stereo Matching / Depth Map Generation Algorithms Business (US$ Million), 2021–2026
Table 103. Continental AG Recent Development
Table 104. Valeo Company Details
Table 105. Valeo Business Overview
Table 106. Valeo Stereo Matching / Depth Map Generation Algorithms Product
Table 107. Valeo Revenue in Stereo Matching / Depth Map Generation Algorithms Business (US$ Million), 2021–2026
Table 108. Valeo Recent Development
Table 109. Teledyne Technologies (FLIR) Company Details
Table 110. Teledyne Technologies (FLIR) Business Overview
Table 111. Teledyne Technologies (FLIR) Stereo Matching / Depth Map Generation Algorithms Product
Table 112. Teledyne Technologies (FLIR) Revenue in Stereo Matching / Depth Map Generation Algorithms Business (US$ Million), 2021–2026
Table 113. Teledyne Technologies (FLIR) Recent Development
Table 114. Cognex Corporation Company Details
Table 115. Cognex Corporation Business Overview
Table 116. Cognex Corporation Stereo Matching / Depth Map Generation Algorithms Product
Table 117. Cognex Corporation Revenue in Stereo Matching / Depth Map Generation Algorithms Business (US$ Million), 2021–2026
Table 118. Cognex Corporation Recent Development
Table 119. Basler AG Company Details
Table 120. Basler AG Business Overview
Table 121. Basler AG Stereo Matching / Depth Map Generation Algorithms Product
Table 122. Basler AG Revenue in Stereo Matching / Depth Map Generation Algorithms Business (US$ Million), 2021–2026
Table 123. Basler AG Recent Development
Table 124. Orbbec Technology Co., Ltd. Company Details
Table 125. Orbbec Technology Co., Ltd. Business Overview
Table 126. Orbbec Technology Co., Ltd. Stereo Matching / Depth Map Generation Algorithms Product
Table 127. Orbbec Technology Co., Ltd. Revenue in Stereo Matching / Depth Map Generation Algorithms Business (US$ Million), 2021–2026
Table 128. Orbbec Technology Co., Ltd. Recent Development
Table 129. DJI (Dajiang Innovation Technology Co., Ltd.) Company Details
Table 130. DJI (Dajiang Innovation Technology Co., Ltd.) Business Overview
Table 131. DJI (Dajiang Innovation Technology Co., Ltd.) Stereo Matching / Depth Map Generation Algorithms Product
Table 132. DJI (Dajiang Innovation Technology Co., Ltd.) Revenue in Stereo Matching / Depth Map Generation Algorithms Business (US$ Million), 2021–2026
Table 133. DJI (Dajiang Innovation Technology Co., Ltd.) Recent Development
Table 134. XGRIDS Technology Co., Ltd. Company Details
Table 135. XGRIDS Technology Co., Ltd. Business Overview
Table 136. XGRIDS Technology Co., Ltd. Stereo Matching / Depth Map Generation Algorithms Product
Table 137. XGRIDS Technology Co., Ltd. Revenue in Stereo Matching / Depth Map Generation Algorithms Business (US$ Million), 2021–2026
Table 138. XGRIDS Technology Co., Ltd. Recent Development
Table 139. Mech-Mind Robotics Technologies Ltd. Company Details
Table 140. Mech-Mind Robotics Technologies Ltd. Business Overview
Table 141. Mech-Mind Robotics Technologies Ltd. Stereo Matching / Depth Map Generation Algorithms Product
Table 142. Mech-Mind Robotics Technologies Ltd. Revenue in Stereo Matching / Depth Map Generation Algorithms Business (US$ Million), 2021–2026
Table 143. Mech-Mind Robotics Technologies Ltd. Recent Development
Table 144. Research Programs/Design for This Report
Table 145. Key Data Information from Secondary Sources
Table 146. Key Data Information from Primary Sources
Table 147. Authors List of This Report
List of Figures
Figure 1. Stereo Matching / Depth Map Generation Algorithms Picture
Figure 2. Global Stereo Matching / Depth Map Generation Algorithms Market Size Comparison by Type (US$ Million), 2021–2032
Figure 3. Global Stereo Matching / Depth Map Generation Algorithms Market Share by Type: 2025 vs 2032
Figure 4. Traditional Stereo Matching Algorithms Features
Figure 5. Deep Learning-Based Stereo Matching Features
Figure 6. Hybrid Stereo + LiDAR Fusion Methods Features
Figure 7. Multi-View Stereo (MVS) Reconstruction Features
Figure 8. Real-Time Stereo SLAM Systems Features
Figure 9. Global Stereo Matching / Depth Map Generation Algorithms Market Size Comparison by Component (US$ Million), 2021–2032
Figure 10. Software (SDKs, APIs, Standalone Platforms) Features
Figure 11. Hardware-Integrated Systems Features
Figure 12. Cloud-Based Processing Platforms Features
Figure 13. Edge AI Vision Chips / Embedded Modules Features
Figure 14. Global Stereo Matching / Depth Map Generation Algorithms Market Size Comparison by Deployment Mode (US$ Million), 2021–2032
Figure 15. On-Premise Systems Features
Figure 16. Cloud-Based Platforms (SaaS / API Services) Features
Figure 17. Edge Deployment (Robotics, Drones, Automotive ECUs) Features
Figure 18. Hybrid Deployment Features
Figure 19. Global Stereo Matching / Depth Map Generation Algorithms Market Size by Application (US$ Million), 2021–2032
Figure 20. Global Stereo Matching / Depth Map Generation Algorithms Market Share by Application: 2025 vs 2032
Figure 21. Automotive Case Studies
Figure 22. Robotics & Manufacturing Case Studies
Figure 23. Construction & Infrastructure Case Studies
Figure 24. Consumer Electronics Case Studies
Figure 25. Defense & Aerospace Case Studies
Figure 26. Healthcare Case Studies
Figure 27. Stereo Matching / Depth Map Generation Algorithms Report Years Considered
Figure 28. Global Stereo Matching / Depth Map Generation Algorithms Market Size (US$ Million), Year-over-Year: 2021–2032
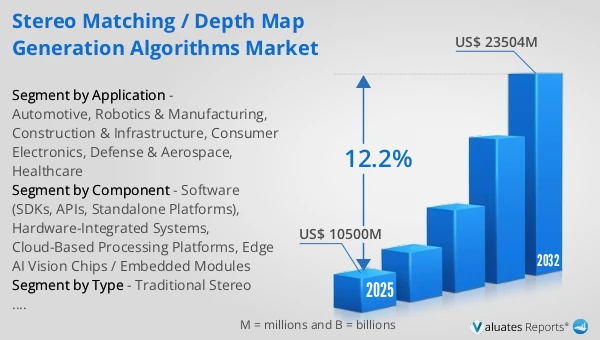
Figure 29. Global Stereo Matching / Depth Map Generation Algorithms Market Size, (US$ Million), 2021 vs 2025 vs 2032
Figure 30. Global Stereo Matching / Depth Map Generation Algorithms Market Share by Region: 2025 vs 2032
Figure 31. Global Stereo Matching / Depth Map Generation Algorithms Market Share by Players in 2025
Figure 32. Global Stereo Matching / Depth Map Generation Algorithms Market Share by Company Type (Tier 1, Tier 2, and Tier 3)
Figure 33. The Top 10 and 5 Players Market Share by Stereo Matching / Depth Map Generation Algorithms Revenue in 2025
Figure 34. North America Stereo Matching / Depth Map Generation Algorithms Market Size YoY Growth (US$ Million), 2021–2032
Figure 35. North America Stereo Matching / Depth Map Generation Algorithms Market Share by Country (2021–2032)
Figure 36. United States Stereo Matching / Depth Map Generation Algorithms Market Size YoY Growth (US$ Million), 2021–2032
Figure 37. Canada Stereo Matching / Depth Map Generation Algorithms Market Size YoY Growth (US$ Million), 2021–2032
Figure 38. Europe Stereo Matching / Depth Map Generation Algorithms Market Size YoY Growth (US$ Million), 2021–2032
Figure 39. Europe Stereo Matching / Depth Map Generation Algorithms Market Share by Country (2021–2032)
Figure 40. Germany Stereo Matching / Depth Map Generation Algorithms Market Size YoY Growth (US$ Million), 2021–2032
Figure 41. France Stereo Matching / Depth Map Generation Algorithms Market Size YoY Growth (US$ Million), 2021–2032
Figure 42. U.K. Stereo Matching / Depth Map Generation Algorithms Market Size YoY Growth (US$ Million), 2021–2032
Figure 43. Italy Stereo Matching / Depth Map Generation Algorithms Market Size YoY Growth (US$ Million), 2021–2032
Figure 44. Russia Stereo Matching / Depth Map Generation Algorithms Market Size YoY Growth (US$ Million), 2021–2032
Figure 45. Ireland Stereo Matching / Depth Map Generation Algorithms Market Size YoY Growth (US$ Million), 2021–2032
Figure 46. Asia-Pacific Stereo Matching / Depth Map Generation Algorithms Market Size YoY Growth (US$ Million), 2021–2032
Figure 47. Asia-Pacific Stereo Matching / Depth Map Generation Algorithms Market Share by Region (2021–2032)
Figure 48. China Stereo Matching / Depth Map Generation Algorithms Market Size YoY Growth (US$ Million), 2021–2032
Figure 49. Japan Stereo Matching / Depth Map Generation Algorithms Market Size YoY Growth (US$ Million), 2021–2032
Figure 50. South Korea Stereo Matching / Depth Map Generation Algorithms Market Size YoY Growth (US$ Million), 2021–2032
Figure 51. Southeast Asia Stereo Matching / Depth Map Generation Algorithms Market Size YoY Growth (US$ Million), 2021–2032
Figure 52. India Stereo Matching / Depth Map Generation Algorithms Market Size YoY Growth (US$ Million), 2021–2032
Figure 53. Australia & New Zealand Stereo Matching / Depth Map Generation Algorithms Market Size YoY Growth (US$ Million), 2021–2032
Figure 54. Latin America Stereo Matching / Depth Map Generation Algorithms Market Size YoY Growth (US$ Million), 2021–2032
Figure 55. Latin America Stereo Matching / Depth Map Generation Algorithms Market Share by Country (2021–2032)
Figure 56. Mexico Stereo Matching / Depth Map Generation Algorithms Market Size YoY Growth (US$ Million), 2021–2032
Figure 57. Brazil Stereo Matching / Depth Map Generation Algorithms Market Size YoY Growth (US$ Million), 2021–2032
Figure 58. Middle East & Africa Stereo Matching / Depth Map Generation Algorithms Market Size YoY Growth (US$ Million), 2021–2032
Figure 59. Middle East & Africa Stereo Matching / Depth Map Generation Algorithms Market Share by Country (2021–2032)
Figure 60. Israel Stereo Matching / Depth Map Generation Algorithms Market Size YoY Growth (US$ Million), 2021–2032
Figure 61. Saudi Arabia Stereo Matching / Depth Map Generation Algorithms Market Size YoY Growth (US$ Million), 2021–2032
Figure 62. UAE Stereo Matching / Depth Map Generation Algorithms Market Size YoY Growth (US$ Million), 2021–2032
Figure 63. NVIDIA Revenue Growth Rate in Stereo Matching / Depth Map Generation Algorithms Business (2021–2026)
Figure 64. Intel Corporation (RealSense) Revenue Growth Rate in Stereo Matching / Depth Map Generation Algorithms Business (2021–2026)
Figure 65. Mobileye Revenue Growth Rate in Stereo Matching / Depth Map Generation Algorithms Business (2021–2026)
Figure 66. Qualcomm Technologies, Inc. Revenue Growth Rate in Stereo Matching / Depth Map Generation Algorithms Business (2021–2026)
Figure 67. Sony Group Corporation Revenue Growth Rate in Stereo Matching / Depth Map Generation Algorithms Business (2021–2026)
Figure 68. Canon Inc. Revenue Growth Rate in Stereo Matching / Depth Map Generation Algorithms Business (2021–2026)
Figure 69. Samsung Electronics Revenue Growth Rate in Stereo Matching / Depth Map Generation Algorithms Business (2021–2026)
Figure 70. Bosch Mobility Solutions Revenue Growth Rate in Stereo Matching / Depth Map Generation Algorithms Business (2021–2026)
Figure 71. Continental AG Revenue Growth Rate in Stereo Matching / Depth Map Generation Algorithms Business (2021–2026)
Figure 72. Valeo Revenue Growth Rate in Stereo Matching / Depth Map Generation Algorithms Business (2021–2026)
Figure 73. Teledyne Technologies (FLIR) Revenue Growth Rate in Stereo Matching / Depth Map Generation Algorithms Business (2021–2026)
Figure 74. Cognex Corporation Revenue Growth Rate in Stereo Matching / Depth Map Generation Algorithms Business (2021–2026)
Figure 75. Basler AG Revenue Growth Rate in Stereo Matching / Depth Map Generation Algorithms Business (2021–2026)
Figure 76. Orbbec Technology Co., Ltd. Revenue Growth Rate in Stereo Matching / Depth Map Generation Algorithms Business (2021–2026)
Figure 77. DJI (Dajiang Innovation Technology Co., Ltd.) Revenue Growth Rate in Stereo Matching / Depth Map Generation Algorithms Business (2021–2026)
Figure 78. XGRIDS Technology Co., Ltd. Revenue Growth Rate in Stereo Matching / Depth Map Generation Algorithms Business (2021–2026)
Figure 79. Mech-Mind Robotics Technologies Ltd. Revenue Growth Rate in Stereo Matching / Depth Map Generation Algorithms Business (2021–2026)
Figure 80. Bottom-up and Top-down Approaches for This Report
Figure 81. Data Triangulation
Figure 82. Key Executives Interviewed