FEATURED COMPANIES
IMA
Uhlmann
Körber AG
Multivac
Marchesini Group
Optima
Bausch & Strobel
Mutual
Truking
Romaco
Chinasun
CKD Corporation
Hoong-A Corporation
MG2
SHINVA
ACG
Heino Ilsemann
Automatic Pharmaceutical Packaging Machine Market Size
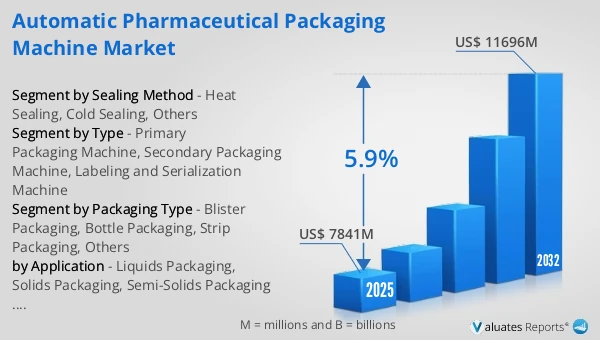
The global Automatic Pharmaceutical Packaging Machine market was valued at US$ 7841 million in 2025 and is anticipated to reach US$ 11696 million by 2032, at a CAGR of 5.9% from 2026 to 2032.
Automatic Pharmaceutical Packaging Machine Market
The 2025 U.S. tariff policies introduce profound uncertainty into the global economic landscape. This report critically examines the implications of recent tariff adjustments and international strategic countermeasures on Automatic Pharmaceutical Packaging Machine competitive dynamics, regional economic interdependencies, and supply chain reconfigurations.
An Automatic Pharmaceutical Packaging Machine is an integrated system designed to package solid, liquid, or semi-solid pharmaceutical products with high accuracy, speed, and compliance. It covers functions such as dosing, filling, blistering, bottling, labeling, sealing, and serialization to ensure product integrity and traceability. These machines are engineered to meet stringent regulatory requirements, including GMP and data integrity standards, while minimizing contamination risks and human intervention. As pharmaceutical manufacturing scales and diversifies, automatic packaging machines play a crucial role in improving efficiency, ensuring quality consistency, and supporting high-mix, high-volume production across global drug markets.
In 2025, global Automatic Pharmaceutical Packaging Machine production reached approximately 103.98 k units, with an average global market price of around US$ 75412 per unit. And global Automatic Pharmaceutical Packaging Machine production capacity reached approximately 140 k units. The average gross margin in this industry reached 26.74%.
In the upstream supply chain, automatic pharmaceutical packaging machines rely on precision mechanical components, industrial automation systems, sensors, and pharmaceutical-grade materials. Representative upstream suppliers include Siemens for PLCs and motion control, Bosch Rexroth for servo drives and actuators, and Rockwell Automation for control platforms and safety systems. The reliability and precision of these components directly affect packaging accuracy, uptime, and compliance. Midstream equipment manufacturers focus on machine design, system integration, validation support, and regulatory documentation. Downstream, automatic pharmaceutical packaging machines are widely adopted by pharmaceutical producers such as Pfizer, Novartis, and Sanofi, where they are used in primary and secondary packaging lines. Ongoing growth in global pharmaceutical production and stricter compliance requirements continue to drive steady downstream demand.
This report delivers a comprehensive overview of the global Automatic Pharmaceutical Packaging Machine market, with both quantitative and qualitative analyses, to help readers develop growth strategies, assess the competitive landscape, evaluate their position in the current market, and make informed business decisions regarding Automatic Pharmaceutical Packaging Machine. The Automatic Pharmaceutical Packaging Machine market size, estimates, and forecasts are provided in terms of output/shipments (K Units) and revenue (US$ millions), with 2025 as the base year and historical and forecast data for 2021–2032.
The report segments the global Automatic Pharmaceutical Packaging Machine market comprehensively. Regional market sizes by Type, by Application, by Packaging Type, and by company are also provided. For deeper insight, the report profiles the competitive landscape, key competitors, and their respective market rankings, and discusses technological trends and new product developments.
This report will assist Automatic Pharmaceutical Packaging Machine manufacturers, new entrants, and companies across the industry value chain with information on revenues, production, and average prices for the overall market and its sub-segments, by company, by Type, by Application, and by region.
Market Segmentation
Scope of Automatic Pharmaceutical Packaging Machine Market Report
| Report Metric |
Details |
| Report Name |
Automatic Pharmaceutical Packaging Machine Market |
| Accounted market size in 2025 |
US$ 7841 million |
| Forecasted market size in 2032 |
US$ 11696 million |
| CAGR |
5.9% |
| Base Year |
2025 |
| Forecasted years |
2026 - 2032 |
| Segment by Type |
- Primary Packaging Machine
- Secondary Packaging Machine
- Labeling and Serialization Machine
|
| Segment by Packaging Type |
- Blister Packaging
- Bottle Packaging
- Strip Packaging
- Others
|
| Segment by Sealing Method |
- Heat Sealing
- Cold Sealing
- Others
|
| by Application |
- Liquids Packaging
- Solids Packaging
- Semi-Solids Packaging
|
| Production by Region |
- North America
- Europe
- China
- Japan
|
| Consumption by Region |
- North America (United States, Canada)
- Europe (Germany, France, UK, Italy, Russia)
- Asia-Pacific (China, Japan, South Korea, Taiwan)
- Southeast Asia (India)
- Latin America (Mexico, Brazil)
|
| By Company |
IMA, Syntegon, Uhlmann, Körber, Multivac, Marchesini Group, Coesia, Optima, Bausch & Strobel, Mutual, Truking, Schubert, Romaco, CHINASUN, CKD Corporation, Hoong-A Corporation, MG2, SHINVA, ACG, Heino Ilsemann |
| Forecast units |
USD million in value |
| Report coverage |
Revenue and volume forecast, company share, competitive landscape, growth factors and trends |
Chapter Outline
- Chapter 1: Defines the scope of the report and presents an executive summary of market segments (by Type, by Application, by Packaging Type, etc.), including the size of each segment and its future growth potential. It offers a high-level view of the current market and its likely evolution in the short, medium, and long term.
- Chapter 2: Provides a detailed analysis of the competitive landscape for Automatic Pharmaceutical Packaging Machine manufacturers, including prices, production, value-based market shares, latest development plans, and information on mergers and acquisitions.
- Chapter 3: Examines Automatic Pharmaceutical Packaging Machine production/output and value by region and country, providing a quantitative assessment of market size and growth potential for each region over the next six years.
- Chapter 4: Analyzes Automatic Pharmaceutical Packaging Machine consumption at the regional and country levels. It quantifies market size and growth potential for each region and its key countries, and outlines market development, outlook, addressable space, and national production.
- Chapter 5: Analyzes market segments by Type, covering the size and growth potential of each segment to help readers identify “blue ocean” opportunities.
- Chapter 6: Analyzes market segments by Application, covering the size and growth potential of each segment to help readers identify “blue ocean” opportunities in downstream markets.
- Chapter 7: Profiles key players, detailing the fundamentals of major companies, including product production/output, value, price, gross margin, product portfolio/introductions, and recent developments.
- Chapter 8: Reviews the industry value chain, including upstream and downstream segments.
- Chapter 9: Discusses market dynamics and recent developments, including drivers, restraints, challenges and risks for manufacturers, U.S. Tariffs and relevant policy analysis.
- Chapter 10: Summarizes the key findings and conclusions of the report.
FAQ for this report
How fast is Automatic Pharmaceutical Packaging Machine Market growing?
Ans: The Automatic Pharmaceutical Packaging Machine Market witnessing a CAGR of 5.9% during the forecast period 2026-2032.
What is the Automatic Pharmaceutical Packaging Machine Market size in 2032?
Ans: The Automatic Pharmaceutical Packaging Machine Market size in 2032 will be US$ 11696 million.
Who are the main players in the Automatic Pharmaceutical Packaging Machine Market report?
Ans: The main players in the Automatic Pharmaceutical Packaging Machine Market are IMA, Syntegon, Uhlmann, Körber, Multivac, Marchesini Group, Coesia, Optima, Bausch & Strobel, Mutual, Truking, Schubert, Romaco, CHINASUN, CKD Corporation, Hoong-A Corporation, MG2, SHINVA, ACG, Heino Ilsemann
What are the Application segmentation covered in the Automatic Pharmaceutical Packaging Machine Market report?
Ans: The Applications covered in the Automatic Pharmaceutical Packaging Machine Market report are Liquids Packaging, Solids Packaging, Semi-Solids Packaging
What are the Type segmentation covered in the Automatic Pharmaceutical Packaging Machine Market report?
Ans: The Types covered in the Automatic Pharmaceutical Packaging Machine Market report are Blister Packaging, Bottle Packaging, Strip Packaging, Others

