Compound Semiconductor Market 2028
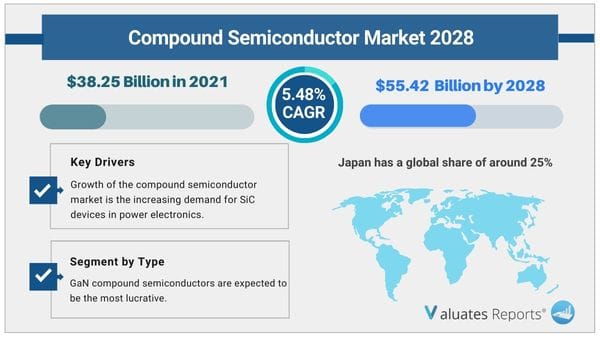
The global Compound Semiconductor market size was valued at US$ 38.25 billion in 2021 and is forecast to be a readjusted size of US$ 55.42 billion by 2028 with a CAGR of 5.48% during the forecast period 2022-2028. The rising demand for SiC devices in power electronics and the continued development of technologies in the GaN ecosystem are two reasons for boosting the compound semiconductor market's growth.
Data centers and Light Emitting Diodes increasingly use compound semiconductors (LEDs). This element will fuel the Compound Semiconductor market even more.
Compound Semiconductor Market Trends
Compound semiconductors are increasingly being used in light-emitting diodes, which is one of the primary factors driving the compound semiconductor market's rise (LEDs). LEDs are taking the place of halogen bulbs and other conventional illumination sources. Both domestic and commercial settings have a great need for fluorescent and incandescent lighting. Additionally, because they offer brighter illumination than conventional lighting, LEDs are frequently used in the automotive industry. The market for compound semiconductors is anticipated to benefit from the rising popularity of LED lighting.
In order to deliver and receive communications, transceivers are widely employed in data centers. Transceivers use compound semiconductors to boost their speed. Rising demand for high-speed transceivers is anticipated to fuel compound semiconductor market expansion in the ensuing years. The smartphone is also the main user of compound semiconductors. The smartphone market has experienced fierce rivalry in recent years. Additionally, it is anticipated that the growing use of mobile phones will drive the global Compound Semiconductor market for compound semiconductors.
SiC devices outperform silicon-based ones in terms of breakdown electric field strength and thermal conductivity by a factor of three and ten, respectively. This property reduces the device's complexity and cost, improves dependability, and makes it possible to employ it in a range of high-voltage applications, such as solar inverters, power supply, and wind turbines. Because of the growing demand for power electronics, the market for SiC power devices is growing. Power electronics allow for the effective and efficient conversion and control of electrical power. Because of the increasing need for power electronics in industries including aircraft, medical, and defense, SiC power devices are being employed more frequently. This element is anticipated to fuel the demand for compound semiconductors.
5G wireless base station technology must be effective, performant, and cost-effective. GaN solutions are essential in delivering these attributes. GaN-on-SiC outperforms Laterally Diffused Metal-Oxide Semiconductors in terms of performance and efficiency for 5G base stations. Additional benefits of GaN-on-SiC include increased thermal conductivity, strong robustness and reliability, improved efficiency at higher frequencies, and comparable performance in a smaller MIMO array. GaN is expected to enhance the network's power amplifiers for every transmission cell, which could have a significant impact on the rollout of fifth-generation (5G) networks.
A number of emerging technologies, including the Internet of Things, artificial intelligence, and machine learning are also being adopted, which is boosting the demand for high-speed semiconductor devices and favorably affecting the growth of the compound semiconductor market.
Compound Semiconductor Market Share Analysis
Japan is the main producer of compound semiconductors, with a roughly 25% global market share. With 20%, North America came in second.
With a combined market share of almost 40%, the top five producers in the industry are Sumitomo Electric Industries, SCIOCS, Mitsubishi Chemical, Dow Corning, and Shin-Etsu Chemical.
GaN compound semiconductors are anticipated to be the most profitable variety. GaN's high breakdown voltage and low conduction resistance features enable high-speed switching and device downsizing. GaN devices can be easily shrunk and are small (low parasitic capacitance), enabling high-speed switching, high electron mobility, and both. GaN devices can be easily downsized in comparison to traditional silicon devices, which require a larger chip area to reduce on-resistance.
Optoelectronics will experience a large increase during the forecast period. Recent advancements in the field, such as plasmonic nanostructures, perovskite transistors, optically active quantum dots, microscopic light bulbs, low-cost 3D imaging, laser-powered 3D display technology, and Laser Li-Fi, are predicted to cause a quantum shift in the dynamic applicability areas of optoelectronic apparatus.
Segment by Company
- IQE PLC
- Sumitomo Electric Industries
- SCIOCS
- Mitsubishi Chemical
- San’an Optoelectronics
- DuPont
- Shin-Etsu Chemical
- DOWA
- Freiberger
- JX Nippon Mining & Metals
Product Type Insights
Global markets are presented by Compound Semiconductor type, along with growth forecasts through 2028. Estimates on sales and revenue are based on the price in the supply chain at which the Compound Semiconductor are procured by the manufacturers.
This report has studied every segment and provided the market size using historical data. They have also talked about the growth opportunities that the segment may pose in the future. This study bestows sales and revenue data by type, and during the historical period (2017-2022) and forecast period (2023-2028).
Segment by Type
- Gallium Arsenide (GaAs)
- Gallium Nitride (GaN)
- Silicon Carbide (SiC)
- Others
Application Insights
This report has provided the market size (sales and revenue data) by application, during the historical period (2017-2022) and forecast period (2023-2028).
This report also outlines the market trends of each segment and consumer behaviors impacting the Compound Semiconductor market and what implications these may have on the industry's future. This report can help to understand the relevant market and consumer trends that are driving the Compound Semiconductor market.
Segment by Application
Insights Regional Outlook
This section of the report provides key insights regarding various regions and the key players operating in each region. Economic, social, environmental, technological, and political factors have been taken into consideration while assessing the growth of the particular region/country. The readers will also get their hands on the revenue and sales data of each region and country for the period 2017-2028.
The market has been segmented into various major geographies, including North America, Europe, Asia-Pacific, South America, Middle East & Africa. Detailed analysis of major countries such as the USA, Germany, the U.K., Italy, France, China, Japan, South Korea, Southeast Asia, and India will be covered within the regional segment. For market estimates, data are going to be provided for 2021 because of the base year, with estimates for 2022 and forecast revenue for 2028.
Segment by Region
- North America
- United States
- Canada
- Europe
- Germany
- France
- U.K.
- Italy
- Russia
- Nordic Countries
- Benelux
- Rest of Europe
- Asia-Pacific
- China
- Japan
- South Korea
- India
- Southeast Asia
- Australia
- Rest of Asia-Pacific
- Latin America
- Mexico
- Brazil
- Argentina
- Rest of Latin America
- Middle East & Africa
- Turkey
- Saudi Arabia
- UAE
- Rest of Middle East & Africa
Compound Semiconductor Market Scope
| Report Metric |
Details |
| Report Name |
Compound Semiconductor Market |
| The market size in 20221 |
USD 38.25 Billion |
| The revenue forecast in 2028 |
USD 55.42 Billion |
| Growth Rate |
Compound Annual Growth Rate (CAGR) of 5.48% from 2022 to 2028 |
| Market size available for years |
2022-2028 |
| Forecast units |
Value (USD) |
| Segments covered |
By Type, Application & Regions |
| Report coverage |
Revenue & volume forecast, company share, competitive landscape, growth factors, and trends |
| Geographic regions covered |
North America, Europe, Asia Pacific, Latin America, Middle East & Africa |
Frequently Asked Questions About This Report
1. How Big is the Compound Semiconductor Market?
Ans. The global Compound Semiconductor market size was value at US$ 38.25 billion in 2021 and is forecast to be a readjusted size of US$ 55.42 billion by 2028 with a CAGR of 5.48% during the forecast period 2022-2028.
2. What is the Compound Semiconductor Market Growth?
Ans. The global Compound Semiconductor market is expected to grow at a compound annual growth rate of 5.48% from 2022 to 2028.
3. Who are the major key players of the Compound Semiconductor Market?
Ans. Sumitomo Electric Industries, SCIOCS, Mitsubishi Chemical, Dow Corning and Shin-Etsu Chemical are the top 5 manufacturers of industry, and they had about 40% combined market share.
4. Is chapterwise Report available for the Compound Semoconductor Market?
Ans. Yes, ChapterWise report available for the Compound Semiconductor market.
Recommended Reports
Semiconductor Materials
Power Semiconductor Devices
LEDs and Chips
07/22/25
1 Study Coverage
1.1 Compound Semiconductor Product Introduction
1.2 Market by Type
1.2.1 Global Compound Semiconductor Market Size Growth Rate by Type (2017 VS 2021 VS 2028)
1.2.2 Gallium Arsenide (GaAs)
1.2.3 Gallium Nitride (GaN)
1.2.4 Silicon Carbide (SiC)
1.2.5 Others
1.3 Market by Application
1.3.1 Global Compound Semiconductor Market Size Growth Rate by Application (2017 VS 2021 VS 2028)
1.3.2 Electronic Components
1.3.3 Photonic Device
1.3.4 Optoelectronic Devices
1.3.5 Integrated Circuit
1.4 Study Objectives
1.5 Years Considered
2 Executive Summary
2.1 Global Compound Semiconductor Market Size Estimates and Forecasts
2.1.1 Global Compound Semiconductor Revenue 2017-2028
2.1.2 Global Compound Semiconductor Sales 2017-2028
2.2 Compound Semiconductor Market Size by Region: 2022 Versus 2028
2.3 Compound Semiconductor Sales by Region (2017-2028)
2.3.1 Global Compound Semiconductor Sales by Region: 2017-2022
2.3.2 Global Compound Semiconductor Sales Forecast by Region (2023-2028)
2.3.3 Global Compound Semiconductor Sales Market Share by Region (2017-2028)
2.4 Compound Semiconductor Market Estimates and Projections by Region (2023-2028)
2.4.1 Global Compound Semiconductor Revenue by Region: 2017-2022
2.4.2 Global Compound Semiconductor Revenue Forecast by Region (2023-2028)
2.4.3 Global Compound Semiconductor Revenue Market Share by Region (2017-2028)
3 Global Compound Semiconductor by Manufacturers
3.1 Global Top Compound Semiconductor Manufacturers by Sales
3.1.1 Global Compound Semiconductor Sales by Manufacturer (2017-2022)
3.1.2 Global Compound Semiconductor Sales Market Share by Manufacturer (2017-2022)
3.2 Global Top Compound Semiconductor Manufacturers by Revenue
3.2.1 Global Compound Semiconductor Revenue by Manufacturer (2017-2022)
3.2.2 Global Compound Semiconductor Revenue Share by Manufacturer (2017-2022)
3.3 Global Compound Semiconductor Price by Manufacturer (2017-2022)
3.4 Competitive Landscape
3.4.1 Key Compound Semiconductor Manufacturers Covered: Ranking by Revenue
3.4.2 Global Compound Semiconductor Market Concentration Ratio (CR5 and HHI) & (2017-2022)
3.4.3 Global Compound Semiconductor Market Share by Company Type (Tier 1, Tier 2 and Tier 3)
3.5 Global Compound Semiconductor Manufacturing Base Distribution, Product Type
3.5.1 Compound Semiconductor Manufacturers Manufacturing Base Distribution, Headquarters
3.5.2 Manufacturers Compound Semiconductor Product Type
3.5.3 Date of International Manufacturers Enter into Compound Semiconductor Market
3.6 Manufacturers Mergers & Acquisitions, Expansion Plans
4 Company Profiles
4.1 IQE PLC
4.1.1 IQE PLC Corporation Information
4.1.2 IQE PLC Description, Business Overview
4.1.3 IQE PLC Compound Semiconductor Products Offered
4.1.4 IQE PLC Compound Semiconductor Sales, Revenue and Gross Margin (2017-2022)
4.1.5 IQE PLC Compound Semiconductor Sales by Product in 2021
4.1.6 IQE PLC Compound Semiconductor Sales by Application in 2021
4.1.7 IQE PLC Compound Semiconductor Sales by Geographic Area in 2021
4.1.8 IQE PLC Recent Developments
4.2 Sumitomo Electric Industries
4.2.1 Sumitomo Electric Industries Corporation Information
4.2.2 Sumitomo Electric Industries Description, Business Overview
4.2.3 Sumitomo Electric Industries Compound Semiconductor Products Offered
4.2.4 Sumitomo Electric Industries Compound Semiconductor Sales, Revenue and Gross Margin (2017-2022)
4.2.5 Sumitomo Electric Industries Compound Semiconductor Sales by Product in 2021
4.2.6 Sumitomo Electric Industries Compound Semiconductor Sales by Application in 2021
4.2.7 Sumitomo Electric Industries Compound Semiconductor Sales by Geographic Area in 2021
4.2.8 Sumitomo Electric Industries Recent Developments
4.3 SCIOCS
4.3.1 SCIOCS Corporation Information
4.3.2 SCIOCS Description, Business Overview
4.3.3 SCIOCS Compound Semiconductor Products Offered
4.3.4 SCIOCS Compound Semiconductor Sales, Revenue and Gross Margin (2017-2022)
4.3.5 SCIOCS Compound Semiconductor Sales by Product in 2021
4.3.6 SCIOCS Compound Semiconductor Sales by Application in 2021
4.3.7 SCIOCS Compound Semiconductor Sales by Geographic Area in 2021
4.3.8 SCIOCS Recent Developments
4.4 Mitsubishi Chemical
4.4.1 Mitsubishi Chemical Corporation Information
4.4.2 Mitsubishi Chemical Description, Business Overview
4.4.3 Mitsubishi Chemical Compound Semiconductor Products Offered
4.4.4 Mitsubishi Chemical Compound Semiconductor Sales, Revenue and Gross Margin (2017-2022)
4.4.5 Mitsubishi Chemical Compound Semiconductor Sales by Product in 2021
4.4.6 Mitsubishi Chemical Compound Semiconductor Sales by Application in 2021
4.4.7 Mitsubishi Chemical Compound Semiconductor Sales by Geographic Area in 2021
4.4.8 Mitsubishi Chemical Recent Developments
4.5 San’an Optoelectronics
4.5.1 San’an Optoelectronics Corporation Information
4.5.2 San’an Optoelectronics Description, Business Overview
4.5.3 San’an Optoelectronics Compound Semiconductor Products Offered
4.5.4 San’an Optoelectronics Compound Semiconductor Sales, Revenue and Gross Margin (2017-2022)
4.5.5 San’an Optoelectronics Compound Semiconductor Sales by Product in 2021
4.5.6 San’an Optoelectronics Compound Semiconductor Sales by Application in 2021
4.5.7 San’an Optoelectronics Compound Semiconductor Sales by Geographic Area in 2021
4.5.8 San’an Optoelectronics Recent Developments
4.6 DuPont
4.6.1 DuPont Corporation Information
4.6.2 DuPont Description, Business Overview
4.6.3 DuPont Compound Semiconductor Products Offered
4.6.4 DuPont Compound Semiconductor Sales, Revenue and Gross Margin (2017-2022)
4.6.5 DuPont Compound Semiconductor Sales by Product in 2021
4.6.6 DuPont Compound Semiconductor Sales by Application in 2021
4.6.7 DuPont Compound Semiconductor Sales by Geographic Area in 2021
4.6.8 DuPont Recent Development
4.7 Shin-Etsu Chemical
4.7.1 Shin-Etsu Chemical Corporation Information
4.7.2 Shin-Etsu Chemical Description, Business Overview
4.7.3 Shin-Etsu Chemical Compound Semiconductor Products Offered
4.7.4 Shin-Etsu Chemical Compound Semiconductor Sales, Revenue and Gross Margin (2017-2022)
4.7.5 Shin-Etsu Chemical Compound Semiconductor Sales by Product in 2021
4.7.6 Shin-Etsu Chemical Compound Semiconductor Sales by Application in 2021
4.7.7 Shin-Etsu Chemical Compound Semiconductor Sales by Geographic Area in 2021
4.7.8 Shin-Etsu Chemical Recent Development
4.8 DOWA
4.8.1 DOWA Corporation Information
4.8.2 DOWA Description, Business Overview
4.8.3 DOWA Compound Semiconductor Products Offered
4.8.4 DOWA Compound Semiconductor Sales, Revenue and Gross Margin (2017-2022)
4.8.5 DOWA Compound Semiconductor Sales by Product in 2021
4.8.6 DOWA Compound Semiconductor Sales by Application in 2021
4.8.7 DOWA Compound Semiconductor Sales by Geographic Area in 2021
4.8.8 DOWA Recent Development
4.9 Freiberger
4.9.1 Freiberger Corporation Information
4.9.2 Freiberger Description, Business Overview
4.9.3 Freiberger Compound Semiconductor Products Offered
4.9.4 Freiberger Compound Semiconductor Sales, Revenue and Gross Margin (2017-2022)
4.9.5 Freiberger Compound Semiconductor Sales by Product in 2021
4.9.6 Freiberger Compound Semiconductor Sales by Application in 2021
4.9.7 Freiberger Compound Semiconductor Sales by Geographic Area in 2021
4.9.8 Freiberger Recent Development
4.10 JX Nippon Mining & Metals
4.10.1 JX Nippon Mining & Metals Corporation Information
4.10.2 JX Nippon Mining & Metals Description, Business Overview
4.10.3 JX Nippon Mining & Metals Compound Semiconductor Products Offered
4.10.4 JX Nippon Mining & Metals Compound Semiconductor Sales, Revenue and Gross Margin (2017-2022)
4.10.5 JX Nippon Mining & Metals Compound Semiconductor Sales by Product in 2021
4.10.6 JX Nippon Mining & Metals Compound Semiconductor Sales by Application in 2021
4.10.7 JX Nippon Mining & Metals Compound Semiconductor Sales by Geographic Area in 2021
4.10.8 JX Nippon Mining & Metals Recent Development
5 Breakdown Data by Type
5.1 Global Compound Semiconductor Sales by Type (2017-2028)
5.1.1 Global Compound Semiconductor Sales by Type (2017-2022)
5.1.2 Global Compound Semiconductor Sales Forecast by Type (2023-2028)
5.1.3 Global Compound Semiconductor Sales Market Share by Type (2017-2028)
5.2 Global Compound Semiconductor Revenue Forecast by Type (2017-2028)
5.2.1 Global Compound Semiconductor Revenue by Type (2017-2022)
5.2.2 Global Compound Semiconductor Revenue Forecast by Type (2023-2028)
5.2.3 Global Compound Semiconductor Revenue Market Share by Type (2017-2028)
5.3 Compound Semiconductor Average Selling Price (ASP) by Type (2017-2028)
6 Breakdown Data by Application
6.1 Global Compound Semiconductor Sales by Application (2017-2028)
6.1.1 Global Compound Semiconductor Sales by Application (2017-2022)
6.1.2 Global Compound Semiconductor Sales Forecast by Application (2023-2028)
6.1.3 Global Compound Semiconductor Sales Market Share by Application (2017-2028)
6.2 Global Compound Semiconductor Revenue Forecast by Application (2017-2028)
6.2.1 Global Compound Semiconductor Revenue by Application (2017-2022)
6.2.2 Global Compound Semiconductor Revenue Forecast by Application (2023-2028)
6.2.3 Global Compound Semiconductor Revenue Market Share by Application (2017-2028)
6.3 Compound Semiconductor Average Selling Price (ASP) by Application (2017-2028)
7 North America
7.1 North America Compound Semiconductor Market Size YoY Growth 2017-2028
7.2 North America Compound Semiconductor Market Facts & Figures by Country
7.2.1 North America Compound Semiconductor Sales by Country (2017-2028)
7.2.2 North America Compound Semiconductor Revenue by Country (2017-2028)
7.3 North America Compound Semiconductor Sales by Type
7.4 North America Compound Semiconductor Sales by Application
8 Asia-Pacific
8.1 Asia-Pacific Compound Semiconductor Market Size YoY Growth 2017-2028
8.2 Asia-Pacific Compound Semiconductor Market Facts & Figures by Region
8.2.1 Asia-Pacific Compound Semiconductor Sales by Region (2017-2028)
8.2.2 Asia-Pacific Compound Semiconductor Revenue by Region (2017-2028)
8.3 Asia-Pacific Compound Semiconductor Sales by Type
8.4 Asia-Pacific Compound Semiconductor Sales by Application
9 Europe
9.1 Europe Compound Semiconductor Market Size YoY Growth 2017-2028
9.2 Europe Compound Semiconductor Market Facts & Figures by Country
9.2.1 Europe Compound Semiconductor Sales by Country (2017-2028)
9.2.2 Europe Compound Semiconductor Revenue by Country (2017-2028)
9.3 Europe Compound Semiconductor Sales by Type
9.4 Europe Compound Semiconductor Sales by Application
10 Latin America
10.1 Latin America Compound Semiconductor Market Size YoY Growth 2017-2028
10.2 Latin America Compound Semiconductor Market Facts & Figures by Country
10.2.1 Latin America Compound Semiconductor Sales by Country (2017-2028)
10.2.2 Latin America Compound Semiconductor Revenue by Country (2017-2028)
10.3 Latin America Compound Semiconductor Sales by Type
10.4 Latin America Compound Semiconductor Sales by Application
11 Middle East and Africa
11.1 Middle East and Africa Compound Semiconductor Market Size YoY Growth 2017-2028
11.2 Middle East and Africa Compound Semiconductor Market Facts & Figures by Country
11.2.1 Middle East and Africa Compound Semiconductor Sales by Country (2017-2028)
11.2.2 Middle East and Africa Compound Semiconductor Revenue by Country (2017-2028)
11.3 Middle East and Africa Compound Semiconductor Sales by Type
11.4 Middle East and Africa Compound Semiconductor Sales by Application
12 Supply Chain and Sales Channel Analysis
12.1 Compound Semiconductor Supply Chain Analysis
12.2 Compound Semiconductor Key Raw Materials and Upstream Suppliers
12.3 Compound Semiconductor Clients Analysis
12.4 Compound Semiconductor Sales Channel and Sales Model Analysis
12.4.1 Compound Semiconductor Distribution Channel Analysis: Indirect Sales VS Direct Sales
12.4.2 Compound Semiconductor Distribution Channel Analysis: Online Sales VS Offline Sales
12.4.3 Compound Semiconductor Distributors
13 Market Dynamics
13.1 Compound Semiconductor Industry Trends
13.2 Compound Semiconductor Market Drivers
13.3 Compound Semiconductor Market Challenges
13.4 Compound Semiconductor Market Restraints
13.5 Porter’s Five Forces Analysis
14 Research Findings and Conclusion
15 Appendix
15.1 Research Methodology
15.1.1 Methodology/Research Approach
15.1.2 Data Source
15.2 Author Details
15.3 Disclaimer
List of Tables
Table 1. Global Compound Semiconductor Market Size Growth Rate by Type (US$ Million): 2017 VS 2021 VS 2028
Table 2. Major Manufacturers of Gallium Arsenide (GaAs)
Table 3. Major Manufacturers of Gallium Nitride (GaN)
Table 4. Major Manufacturers of Silicon Carbide (SiC)
Table 5. Major Manufacturers of Others
Table 6. Global Compound Semiconductor Market Size Growth by Application (US$ Million): 2017 VS 2021 VS 2028
Table 7. Global Compound Semiconductor Market Size by Region (US$ Million): 2021 VS 2022 VS 2028
Table 8. Global Compound Semiconductor Sales by Region (2017-2022) & (K Units)
Table 9. Global Compound Semiconductor Sales Forecast by Region (2023-2028) & (K Units)
Table 10. Global Compound Semiconductor Revenue by Region (2017-2022) & (US$ Million)
Table 11. Global Compound Semiconductor Revenue Forecast by Region (2023-2028) & (US$ Million)
Table 12. Global Compound Semiconductor Sales by Manufacturer (2017-2022) & (K Units)
Table 13. Global Compound Semiconductor Sales Share by Manufacturer (2017-2022)
Table 14. Compound Semiconductor Revenue by Manufacturer (2017-2022) & (US$ Million)
Table 15. Compound Semiconductor Revenue Share by Manufacturer (2017-2022)
Table 16. Key Manufacturers Compound Semiconductor Price (2017-2022) & (USD/Unit)
Table 17. Ranking of Global Top Compound Semiconductor Manufacturers by Revenue (US$ Million) in 2021
Table 18. Global Compound Semiconductor Manufacturers Market Concentration Ratio (CR5 and HHI) & (2017-2022)
Table 19. Global Compound Semiconductor by Company Type (Tier 1, Tier 2 and Tier 3) & (based on the Revenue in Compound Semiconductor as of 2021)
Table 20. Compound Semiconductor Manufacturers Manufacturing Base Distribution and Headquarters
Table 21. Manufacturers Compound Semiconductor Product Type
Table 22. Date of International Manufacturers Enter into Compound Semiconductor Market
Table 23. Manufacturers Mergers & Acquisitions, Expansion Plans
Table 24. IQE PLC Corporation Information
Table 25. IQE PLC Description and Business Overview
Table 26. IQE PLC Compound Semiconductor Sales (K Units), Revenue (US$ Million), Price (USD/Unit) and Gross Margin (2017-2022)
Table 27. IQE PLC Compound Semiconductor Product
Table 28. IQE PLC Compound Semiconductor Sales Proportion of Compound Semiconductor by Product in 2021
Table 29. IQE PLC Compound Semiconductor Sales Proportion of Compound Semiconductor by Application in 2021
Table 30. IQE PLC Compound Semiconductor Sales Proportion of Compound Semiconductor by Geographic Area in 2021
Table 31. IQE PLC Recent Development
Table 32. Sumitomo Electric Industries Corporation Information
Table 33. Sumitomo Electric Industries Description and Business Overview
Table 34. Sumitomo Electric Industries Compound Semiconductor Sales (K Units), Revenue (US$ Million), Price (USD/Unit) and Gross Margin (2017-2022)
Table 35. Sumitomo Electric Industries Compound Semiconductor Product
Table 36. Sumitomo Electric Industries Compound Semiconductor Sales Proportion of Compound Semiconductor by Product in 2021
Table 37. Sumitomo Electric Industries Compound Semiconductor Sales Proportion of Compound Semiconductor by Application in 2021
Table 38. Sumitomo Electric Industries Compound Semiconductor Sales Proportion of Compound Semiconductor by Geographic Area in 2021
Table 39. Sumitomo Electric Industries Recent Development
Table 40. SCIOCS Corporation Information
Table 41. SCIOCS Description and Business Overview
Table 42. SCIOCS Compound Semiconductor Sales (K Units), Revenue (US$ Million), Price (USD/Unit) and Gross Margin (2017-2022)
Table 43. SCIOCS Compound Semiconductor Product
Table 44. SCIOCS Compound Semiconductor Sales Proportion of Compound Semiconductor by Product in 2021
Table 45. SCIOCS Compound Semiconductor Sales Proportion of Compound Semiconductor by Application in 2021
Table 46. SCIOCS Compound Semiconductor Sales Proportion of Compound Semiconductor by Geographic Area in 2021
Table 47. SCIOCS Recent Development
Table 48. Mitsubishi Chemical Corporation Information
Table 49. Mitsubishi Chemical Description and Business Overview
Table 50. Mitsubishi Chemical Compound Semiconductor Sales (K Units), Revenue (US$ Million), Price (USD/Unit) and Gross Margin (2017-2022)
Table 51. Mitsubishi Chemical Compound Semiconductor Product
Table 52. Mitsubishi Chemical Compound Semiconductor Sales Proportion of Compound Semiconductor by Product in 2021
Table 53. Mitsubishi Chemical Compound Semiconductor Sales Proportion of Compound Semiconductor by Application in 2021
Table 54. Mitsubishi Chemical Compound Semiconductor Sales Proportion of Compound Semiconductor by Geographic Area in 2021
Table 55. Mitsubishi Chemical Recent Development
Table 56. San’an Optoelectronics Corporation Information
Table 57. San’an Optoelectronics Description and Business Overview
Table 58. San’an Optoelectronics Compound Semiconductor Sales (K Units), Revenue (US$ Million), Price (USD/Unit) and Gross Margin (2017-2022)
Table 59. San’an Optoelectronics Compound Semiconductor Product
Table 60. San’an Optoelectronics Compound Semiconductor Sales Proportion of Compound Semiconductor by Product in 2021
Table 61. San’an Optoelectronics Compound Semiconductor Sales Proportion of Compound Semiconductor by Application in 2021
Table 62. San’an Optoelectronics Compound Semiconductor Sales Proportion of Compound Semiconductor by Geographic Area in 2021
Table 63. San’an Optoelectronics Recent Development
Table 64. DuPont Corporation Information
Table 65. DuPont Description and Business Overview
Table 66. DuPont Compound Semiconductor Sales (K Units), Revenue (US$ Million), Price (USD/Unit) and Gross Margin (2017-2022)
Table 67. DuPont Compound Semiconductor Product
Table 68. DuPont Compound Semiconductor Sales Proportion of Compound Semiconductor by Product in 2021
Table 69. DuPont Compound Semiconductor Sales Proportion of Compound Semiconductor by Application in 2021
Table 70. DuPont Compound Semiconductor Sales Proportion of Compound Semiconductor by Geographic Area in 2021
Table 71. Shin-Etsu Chemical Corporation Information
Table 72. Shin-Etsu Chemical Description and Business Overview
Table 73. Shin-Etsu Chemical Compound Semiconductor Sales (K Units), Revenue (US$ Million), Price (USD/Unit) and Gross Margin (2017-2022)
Table 74. Shin-Etsu Chemical Compound Semiconductor Product
Table 75. Shin-Etsu Chemical Compound Semiconductor Sales Proportion of Compound Semiconductor by Product in 2021
Table 76. Shin-Etsu Chemical Compound Semiconductor Sales Proportion of Compound Semiconductor by Application in 2021
Table 77. Shin-Etsu Chemical Compound Semiconductor Sales Proportion of Compound Semiconductor by Geographic Area in 2021
Table 78. DOWA Corporation Information
Table 79. DOWA Description and Business Overview
Table 80. DOWA Compound Semiconductor Sales (K Units), Revenue (US$ Million), Price (USD/Unit) and Gross Margin (2017-2022)
Table 81. DOWA Compound Semiconductor Product
Table 82. DOWA Compound Semiconductor Sales Proportion of Compound Semiconductor by Product in 2021
Table 83. DOWA Compound Semiconductor Sales Proportion of Compound Semiconductor by Application in 2021
Table 84. DOWA Compound Semiconductor Sales Proportion of Compound Semiconductor by Geographic Area in 2021
Table 85. Freiberger Corporation Information
Table 86. Freiberger Description and Business Overview
Table 87. Freiberger Compound Semiconductor Sales (K Units), Revenue (US$ Million), Price (USD/Unit) and Gross Margin (2017-2022)
Table 88. Freiberger Compound Semiconductor Product
Table 89. Freiberger Compound Semiconductor Sales Proportion of Compound Semiconductor by Product in 2021
Table 90. Freiberger Compound Semiconductor Sales Proportion of Compound Semiconductor by Application in 2021
Table 91. Freiberger Compound Semiconductor Sales Proportion of Compound Semiconductor by Geographic Area in 2021
Table 92. JX Nippon Mining & Metals Corporation Information
Table 93. JX Nippon Mining & Metals Description and Business Overview
Table 94. JX Nippon Mining & Metals Compound Semiconductor Sales (K Units), Revenue (US$ Million), Price (USD/Unit) and Gross Margin (2017-2022)
Table 95. JX Nippon Mining & Metals Compound Semiconductor Product
Table 96. JX Nippon Mining & Metals Compound Semiconductor Sales Proportion of Compound Semiconductor by Product in 2021
Table 97. JX Nippon Mining & Metals Compound Semiconductor Sales Proportion of Compound Semiconductor by Application in 2021
Table 98. JX Nippon Mining & Metals Compound Semiconductor Sales Proportion of Compound Semiconductor by Geographic Area in 2021
Table 99. Global Compound Semiconductor Sales by Type (2017-2022) & (K Units)
Table 100. Global Compound Semiconductor Sales Forecast by Type (2023-2028) & (K Units)
Table 101. Global Compound Semiconductor Revenue by Type (2017-2022) & (US$ Million)
Table 102. Global Compound Semiconductor Revenue Forecast by Type (2023-2028) & (US$ Million)
Table 103. Global Compound Semiconductor Sales by Application (2017-2022) & (K Units)
Table 104. Global Compound Semiconductor Sales Forecast by Application (2023-2028) & (K Units)
Table 105. Global Compound Semiconductor Revenue by Application (2017-2022) & (US$ Million)
Table 106. Global Compound Semiconductor Revenue Forecast by Application (2023-2028) & (US$ Million)
Table 107. North America Compound Semiconductor Sales by Country (2017-2022) & (K Units)
Table 108. North America Compound Semiconductor Sales by Country (2023-2028) & (K Units)
Table 109. North America Compound Semiconductor Revenue by Country (2017-2022) & (US$ Million)
Table 110. North America Compound Semiconductor Revenue by Country (2023-2028) & (US$ Million)
Table 111. North America Compound Semiconductor Sales by Type (2017-2022) & (K Units)
Table 112. North America Compound Semiconductor Sales by Application (2017-2022) & (K Units)
Table 113. Asia-Pacific Compound Semiconductor Sales by Region (2017-2022) & (K Units)
Table 114. Asia-Pacific Compound Semiconductor Sales by Region (2023-2028) & (K Units)
Table 115. Asia-Pacific Compound Semiconductor Revenue by Region (2017-2028) & (US$ Million)
Table 116. Asia-Pacific Compound Semiconductor Revenue by Region (2023-2028) & (US$ Million)
Table 117. Asia-Pacific Compound Semiconductor Sales by Type (2017-2022) & (K Units)
Table 118. Asia-Pacific Compound Semiconductor Sales by Application (2017-2022) & (K Units)
Table 119. Europe Compound Semiconductor Sales by Country (2017-2022) & (K Units)
Table 120. Europe Compound Semiconductor Sales by Country (2023-2028) & (K Units)
Table 121. Europe Compound Semiconductor Revenue by Country (2017-2022) & (US$ Million)
Table 122. Europe Compound Semiconductor Revenue by Country (2023-2028) & (US$ Million)
Table 123. Europe Compound Semiconductor Sales by Type (2017-2022) & (K Units)
Table 124. Europe Compound Semiconductor Sales by Application (2017-2022) & (K Units)
Table 125. Latin America Compound Semiconductor Sales by Country (2017-2022) & (K Units)
Table 126. Latin America Compound Semiconductor Sales by Country (2023-2028) & (K Units)
Table 127. Latin America Compound Semiconductor Revenue by Country (2017-2022) & (US$ Million)
Table 128. Latin America Compound Semiconductor Revenue by Country (2023-2028) & (US$ Million)
Table 129. Latin America Compound Semiconductor Sales by Type (2017-2022) & (K Units)
Table 130. Latin America Compound Semiconductor Sales by Application (2017-2022) & (K Units)
Table 131. Middle East and Africa Compound Semiconductor Sales by Country (2017-2022) & (K Units)
Table 132. Middle East and Africa Compound Semiconductor Sales by Country (2023-2028) & (K Units)
Table 133. Middle East and Africa Compound Semiconductor Revenue by Country (2017-2022) & (US$ Million)
Table 134. Middle East and Africa Compound Semiconductor Revenue by Country (2023-2028) & (US$ Million)
Table 135. Middle East and Africa Compound Semiconductor Sales by Type (2017-2022) & (K Units)
Table 136. Middle East and Africa Compound Semiconductor Sales by Application (2017-2022) & (K Units)
Table 137. Compound Semiconductor Key Raw Materials, Industry Status and Trend
Table 138. Compound Semiconductor Key Raw Materials and Upstream Suppliers
Table 139. Compound Semiconductor Clients Status and Trend
Table 140. Compound Semiconductor Typical Clients
Table 141. Compound Semiconductor Distributors
Table 142. Compound Semiconductor Market Trends
Table 143. Compound Semiconductor Market Drivers
Table 144. Compound Semiconductor Market Challenges
Table 145. Compound Semiconductor Market Restraints
Table 146. Research Programs/Design for This Report
Table 147. Key Data Information from Secondary Sources
Table 148. Key Data Information from Primary Sources
List of Figures
Figure 1. Compound Semiconductor Product Picture
Figure 2. Global Compound Semiconductor Sales Market Share by Type in 2021 & 2028
Figure 3. Gallium Arsenide (GaAs) Product Picture
Figure 4. Gallium Nitride (GaN) Product Picture
Figure 5. Silicon Carbide (SiC) Product Picture
Figure 6. Others Product Picture
Figure 7. Global Compound Semiconductor Sales Market Share by Application in 2021 & 2028
Figure 8. Electronic Components Examples
Figure 9. Photonic Device Examples
Figure 10. Optoelectronic Devices Examples
Figure 11. Integrated Circuit Examples
Figure 12. Compound Semiconductor Report Years Considered
Figure 13. Global Compound Semiconductor Market Size, (US$ Million), 2017 VS 2021 VS 2028
Figure 14. Global Compound Semiconductor Market Size 2017-2028 (US$ Million)
Figure 15. Global Compound Semiconductor Sales 2017-2028 (K Units)
Figure 16. Global Compound Semiconductor Market Size Market Share by Region: 2022 Versus 2028
Figure 17. Global Compound Semiconductor Sales Market Share Forecast by Region (2017-2028)
Figure 18. Global Compound Semiconductor Revenue Market Share by Region (2017-2028)
Figure 19. Global Compound Semiconductor Sales Share by Manufacturer in 2021
Figure 20. Compound Semiconductor Market Share by Company Type (Tier 1, Tier 2 and Tier 3): 2017 VS 2021
Figure 21. Global Compound Semiconductor Sales Market Share Forecast by Type (2017-2028)
Figure 22. Global Compound Semiconductor Revenue Market Share Forecast by Type (2017-2028)
Figure 23. Compound Semiconductor Average Selling Price (ASP) by Type (2017-2022) & (USD/Unit)
Figure 24. Global Compound Semiconductor Sales Market Share Forecast by Application (2017-2028)
Figure 25. Global Compound Semiconductor Revenue Market Share Forecast by Application (2017-2028)
Figure 26. Compound Semiconductor Average Selling Price (ASP) by Application (2017-2022) & (USD/Unit)
Figure 27. North America Compound Semiconductor Revenue 2017-2028 (US$ Million)
Figure 28. North America Compound Semiconductor Sales Market Share by Type (2017-2022)
Figure 29. North America Compound Semiconductor Sales Market Share by Application (2017-2022)
Figure 30. Asia-Pacific Compound Semiconductor Revenue 2017-2028 (US$ Million)
Figure 31. Asia-Pacific Compound Semiconductor Sales Market Share by Region (2017-2028)
Figure 32. Asia-Pacific Compound Semiconductor Revenue Market Share by Region (2017-2028)
Figure 33. Asia-Pacific Compound Semiconductor Sales Market Share by Type (2017-2022)
Figure 34. Asia-Pacific Compound Semiconductor Sales Market Share by Application (2017-2022)
Figure 35. Europe Compound Semiconductor Revenue Growth Rate 2017-2028 (US$ Million)
Figure 36. Europe Compound Semiconductor Sales Market Share by Country (2017-2028)
Figure 37. Europe Compound Semiconductor Revenue Market Share by Country (2017-2028)
Figure 38. Europe Compound Semiconductor Sales Market Share by Type (2017-2022)
Figure 39. Europe Compound Semiconductor Sales Market Share by Application (2017-2022)
Figure 40. Latin America Compound Semiconductor Revenue Growth Rate 2017-2028 (US$ Million)
Figure 41. Latin America Compound Semiconductor Sales Market Share by Country (2017-2028)
Figure 42. Latin America Compound Semiconductor Revenue Market Share by Country (2017-2022)
Figure 43. Latin America Compound Semiconductor Sales Market Share by Type (2017-2022)
Figure 44. Latin America Compound Semiconductor Sales Market Share by Application (2017-2022)
Figure 45. Middle East and Africa Compound Semiconductor Revenue Growth Rate 2017-2028 (US$ Million)
Figure 46. Middle East and Africa Compound Semiconductor Sales Market Share by Country (2017-2028)
Figure 47. Middle East and Africa Compound Semiconductor Revenue Market Share by Country (2017-2028)
Figure 48. Middle East and Africa Compound Semiconductor Sales Market Share by Type (2017-2022)
Figure 49. Middle East and Africa Compound Semiconductor Sales Market Share by Application (2017-2022)
Figure 50. Compound Semiconductor Supply Chain (Upstream and Downstream Market)
Figure 51. Global Production Market Share of Compound Semiconductor Raw Materials by Region in 2021
Figure 52. Compound Semiconductor Distribution Channels
Figure 53. Global Compound Semiconductor Percentage 2017-2028: Indirect Sales VS Direct Sales
Figure 54. Global Compound Semiconductor Percentage 2017-2028: Online Sales VS Offline Sales
Figure 55. Bottom-up and Top-down Approaches for This Report
Figure 56. Data Triangulation

