List of Tables
Table 1. Trampoline CAGR in Value, India VS Global, 2018 VS 2022 VS 2029
Table 2. Trampoline Market Trends
Table 3. Trampoline Market Drivers
Table 4. Trampoline Market Challenges
Table 5. Trampoline Market Restraints
Table 6. Global Trampoline Sales Growth Rate (CAGR) by Type: 2018 VS 2022 VS 2029 (US$ Million)
Table 7. India Trampoline Sales Growth Rate (CAGR) by Type: 2018 VS 2022 VS 2029 (US$ Million)
Table 8. Global Trampoline Sales Growth Rate (CAGR) by Application: 2018 VS 2022 VS 2029 (US$ Million)
Table 9. India Trampoline Sales Growth Rate (CAGR) by Application: 2018 VS 2022 VS 2029 (US$ Million)
Table 10. Global Key Manufacturers of Trampoline, Ranked by Revenue (2022) & (US$ Million)
Table 11. Global Trampoline Revenue by Manufacturer, (US$ Million), 2018-2023
Table 12. Global Trampoline Revenue Share by Manufacturer, 2018-2023
Table 13. Global Trampoline Sales by Manufacturer, (K Units), 2018-2023
Table 14. Global Trampoline Sales Share by Manufacturer, 2018-2023
Table 15. Global Trampoline Price by Manufacturer (2018-2023) & (US$/Unit)
Table 16. Global Trampoline Manufacturers Market Concentration Ratio (CR5 and HHI)
Table 17. Global Trampoline by Company Type (Tier 1, Tier 2, and Tier 3) & (based on the Revenue in Trampoline as of 2022)
Table 18. Global Key Manufacturers of Trampoline, Manufacturing Base Distribution and Headquarters
Table 19. Global Key Manufacturers of Trampoline, Product Offered and Application
Table 20. Global Key Manufacturers of Trampoline, Date of Enter into This Industry
Table 21. Manufacturers Mergers & Acquisitions, Expansion Plans
Table 22. Key Players of Trampoline in India, Ranked by Revenue (2022) & (US$ million)
Table 23. India Trampoline Revenue by Players, (US$ Million), (2018-2023)
Table 24. India Trampoline Revenue Share by Players, (2018-2023)
Table 25. India Trampoline Sales by Players, (K Units), (2018-2023)
Table 26. India Trampoline Sales Share by Players, (2018-2023)
Table 27. Global Trampoline Market Size Growth Rate (CAGR) by Region (US$ Million): 2018 VS 2022 VS 2029
Table 28. Global Trampoline Sales in Volume by Region (2018-2023) & (K Units)
Table 29. Global Trampoline Sales in Volume Forecast by Region (2024-2029) & (K Units)
Table 30. Global Trampoline Sales in Value by Region (2018-2023) & (US$ Million)
Table 31. Global Trampoline Sales in Value Forecast by Region (2024-2029) & (US$ Million)
Table 32. Americas Trampoline Market Size Growth Rate (CAGR) by Country (US$ Million): 2018 VS 2022 VS 2029
Table 33. Americas Trampoline Sales in Value by Country (2018-2023) & (US$ Million)
Table 34. Americas Trampoline Sales in Value by Country (2024-2029) & (US$ Million)
Table 35. Americas Trampoline Sales in Volume by Country (2018-2023) & (K Units)
Table 36. Americas Trampoline Sales in Volume by Country (2024-2029) & (K Units)
Table 37. EMEA Trampoline Market Size Growth Rate (CAGR) by Country (US$ Million): 2018 VS 2022 VS 2029
Table 38. EMEA Trampoline Sales in Value by Country (2018-2023) & (US$ Million)
Table 39. EMEA Trampoline Sales in Value by Country (2024-2029) & (US$ Million)
Table 40. EMEA Trampoline Sales in Volume by Country (2018-2023) & (K Units)
Table 41. EMEA Trampoline Sales in Volume by Country (2024-2029) & (K Units)
Table 42. APAC Trampoline Market Size Growth Rate (CAGR) by Country (US$ Million): 2018 VS 2022 VS 2029
Table 43. APAC Trampoline Sales in Value by Country (2018-2023) & (US$ Million)
Table 44. APAC Trampoline Sales in Value by Country (2024-2029) & (US$ Million)
Table 45. APAC Trampoline Sales in Volume by Country (2018-2023) & (K Units)
Table 46. APAC Trampoline Sales in Volume by Country (2024-2029) & (K Units)
Table 47. JumpSport Company Information
Table 48. JumpSport Description and Business Overview
Table 49. JumpSport Trampoline Sales (K Units), Revenue (US$ Million), Price (US$/Unit) and Gross Margin (2018-2023)
Table 50. JumpSport Trampoline Product
Table 51. JumpSport Recent Development
Table 52. Skywalker Company Information
Table 53. Skywalker Description and Business Overview
Table 54. Skywalker Trampoline Sales (K Units), Revenue (US$ Million), Price (US$/Unit) and Gross Margin (2018-2023)
Table 55. Skywalker Trampoline Product
Table 56. Skywalker Recent Development
Table 57. Vuly Company Information
Table 58. Vuly Description and Business Overview
Table 59. Vuly Trampoline Sales (K Units), Revenue (US$ Million), Price (US$/Unit) and Gross Margin (2018-2023)
Table 60. Vuly Trampoline Product
Table 61. Vuly Recent Development
Table 62. Domijump Company Information
Table 63. Domijump Description and Business Overview
Table 64. Domijump Trampoline Sales (K Units), Revenue (US$ Million), Price (US$/Unit) and Gross Margin (2018-2023)
Table 65. Domijump Trampoline Product
Table 66. Domijump Recent Development
Table 67. Stamina Company Information
Table 68. Stamina Description and Business Overview
Table 69. Stamina Trampoline Sales (K Units), Revenue (US$ Million), Price (US$/Unit) and Gross Margin (2018-2023)
Table 70. Stamina Trampoline Product
Table 71. Stamina Recent Development
Table 72. Upper Bounce Company Information
Table 73. Upper Bounce Description and Business Overview
Table 74. Upper Bounce Trampoline Sales (K Units), Revenue (US$ Million), Price (US$/Unit) and Gross Margin (2018-2023)
Table 75. Upper Bounce Trampoline Product
Table 76. Upper Bounce Recent Development
Table 77. Springfree Company Information
Table 78. Springfree Description and Business Overview
Table 79. Springfree Trampoline Sales (K Units), Revenue (US$ Million), Price (US$/Unit) and Gross Margin (2018-2023)
Table 80. Springfree Trampoline Product
Table 81. Springfree Recent Development
Table 82. Jump King Company Information
Table 83. Jump King Description and Business Overview
Table 84. Jump King Trampoline Sales (K Units), Revenue (US$ Million), Price (US$/Unit) and Gross Margin (2018-2023)
Table 85. Jump King Trampoline Product
Table 86. Jump King Recent Development
Table 87. Sportspower Company Information
Table 88. Sportspower Description and Business Overview
Table 89. Sportspower Trampoline Sales (K Units), Revenue (US$ Million), Price (US$/Unit) and Gross Margin (2018-2023)
Table 90. Sportspower Trampoline Product
Table 91. Sportspower Recent Development
Table 92. Plum Products Company Information
Table 93. Plum Products Description and Business Overview
Table 94. Plum Products Trampoline Sales (K Units), Revenue (US$ Million), Price (US$/Unit) and Gross Margin (2018-2023)
Table 95. Plum Products Trampoline Product
Table 96. Plum Products Recent Development
Table 97. Jumpflex Company Information
Table 98. Jumpflex Description and Business Overview
Table 99. Jumpflex Trampoline Sales (K Units), Revenue (US$ Million), Price (US$/Unit) and Gross Margin (2018-2023)
Table 100. Jumpflex Trampoline Product
Table 101. Jumpflex Recent Development
Table 102. Jumpstar Company Information
Table 103. Jumpstar Description and Business Overview
Table 104. Jumpstar Trampoline Sales (K Units), Revenue (US$ Million), Price (US$/Unit) and Gross Margin (2018-2023)
Table 105. Jumpstar Trampoline Product
Table 106. Jumpstar Recent Development
Table 107. Longtai Sporting Goods Company Information
Table 108. Longtai Sporting Goods Description and Business Overview
Table 109. Longtai Sporting Goods Trampoline Sales (K Units), Revenue (US$ Million), Price (US$/Unit) and Gross Margin (2018-2023)
Table 110. Longtai Sporting Goods Trampoline Product
Table 111. Longtai Sporting Goods Recent Development
Table 112. Zhejiang Tianxin Sports Equipment Company Information
Table 113. Zhejiang Tianxin Sports Equipment Description and Business Overview
Table 114. Zhejiang Tianxin Sports Equipment Trampoline Sales (K Units), Revenue (US$ Million), Price (US$/Unit) and Gross Margin (2018-2023)
Table 115. Zhejiang Tianxin Sports Equipment Trampoline Product
Table 116. Zhejiang Tianxin Sports Equipment Recent Development
Table 117. Sportsoul Company Information
Table 118. Sportsoul Description and Business Overview
Table 119. Sportsoul Trampoline Sales (K Units), Revenue (US$ Million), Price (US$/Unit) and Gross Margin (2018-2023)
Table 120. Sportsoul Trampoline Product
Table 121. Sportsoul Recent Development
Table 122. Sino Fourstar Group Company Information
Table 123. Sino Fourstar Group Description and Business Overview
Table 124. Sino Fourstar Group Trampoline Sales (K Units), Revenue (US$ Million), Price (US$/Unit) and Gross Margin (2018-2023)
Table 125. Sino Fourstar Group Trampoline Product
Table 126. Sino Fourstar Group Recent Development
Table 127. Jiangsu Baoxiang Sports Company Information
Table 128. Jiangsu Baoxiang Sports Description and Business Overview
Table 129. Jiangsu Baoxiang Sports Trampoline Sales (K Units), Revenue (US$ Million), Price (US$/Unit) and Gross Margin (2018-2023)
Table 130. Jiangsu Baoxiang Sports Trampoline Product
Table 131. Jiangsu Baoxiang Sports Recent Development
Table 132. Jiantuo Hardware Machinery Company Information
Table 133. Jiantuo Hardware Machinery Description and Business Overview
Table 134. Jiantuo Hardware Machinery Trampoline Sales (K Units), Revenue (US$ Million), Price (US$/Unit) and Gross Margin (2018-2023)
Table 135. Jiantuo Hardware Machinery Trampoline Product
Table 136. Jiantuo Hardware Machinery Recent Development
Table 137. J.H.X. Company Information
Table 138. J.H.X. Description and Business Overview
Table 139. J.H.X. Trampoline Sales (K Units), Revenue (US$ Million), Price (US$/Unit) and Gross Margin (2018-2023)
Table 140. J.H.X. Trampoline Product
Table 141. J.H.X. Recent Development
Table 142. FSD Company Information
Table 143. FSD Description and Business Overview
Table 144. FSD Trampoline Sales (K Units), Revenue (US$ Million), Price (US$/Unit) and Gross Margin (2018-2023)
Table 145. FSD Trampoline Product
Table 146. FSD Recent Development
Table 147. Jinkaili Company Information
Table 148. Jinkaili Description and Business Overview
Table 149. Jinkaili Trampoline Sales (K Units), Revenue (US$ Million), Price (US$/Unit) and Gross Margin (2018-2023)
Table 150. Jinkaili Trampoline Product
Table 151. Jinkaili Recent Development
Table 152. Taizhou Yuanda Sporting Goods Company Information
Table 153. Taizhou Yuanda Sporting Goods Description and Business Overview
Table 154. Taizhou Yuanda Sporting Goods Trampoline Sales (K Units), Revenue (US$ Million), Price (US$/Unit) and Gross Margin (2018-2023)
Table 155. Taizhou Yuanda Sporting Goods Trampoline Product
Table 156. Taizhou Yuanda Sporting Goods Recent Development
Table 157. Zhejiang GSD Leisure Products Company Information
Table 158. Zhejiang GSD Leisure Products Description and Business Overview
Table 159. Zhejiang GSD Leisure Products Trampoline Sales (K Units), Revenue (US$ Million), Price (US$/Unit) and Gross Margin (2018-2023)
Table 160. Zhejiang GSD Leisure Products Trampoline Product
Table 161. Zhejiang GSD Leisure Products Recent Development
Table 162. Hangzhou Transasia Company Company Information
Table 163. Hangzhou Transasia Company Description and Business Overview
Table 164. Hangzhou Transasia Company Trampoline Sales (K Units), Revenue (US$ Million), Price (US$/Unit) and Gross Margin (2018-2023)
Table 165. Hangzhou Transasia Company Trampoline Product
Table 166. Hangzhou Transasia Company Recent Development
Table 167. Dongguan Sheng Hui Fitness Equipmen Company Information
Table 168. Dongguan Sheng Hui Fitness Equipmen Description and Business Overview
Table 169. Dongguan Sheng Hui Fitness Equipmen Trampoline Sales (K Units), Revenue (US$ Million), Price (US$/Unit) and Gross Margin (2018-2023)
Table 170. Dongguan Sheng Hui Fitness Equipmen Trampoline Product
Table 171. Dongguan Sheng Hui Fitness Equipmen Recent Development
Table 172. Key Raw Materials Lists
Table 173. Raw Materials Key Suppliers Lists
Table 174. Trampoline Customers List
Table 175. Trampoline Distributors List
Table 176. Research Programs/Design for This Report
Table 177. Key Data Information from Secondary Sources
Table 178. Key Data Information from Primary Sources
List of Figures
Figure 1. Trampoline Product Picture
Figure 2. Global Trampoline Revenue, (US$ Million), 2018 VS 2022 VS 2029
Figure 3. Global Trampoline Market Size 2018-2029 (US$ Million)
Figure 4. Global Trampoline Sales 2018-2029 (K Units)
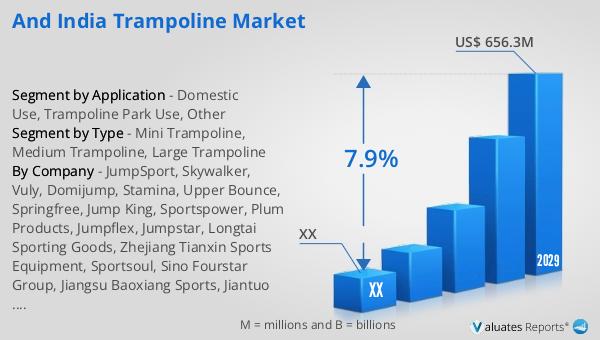
Figure 5. India Trampoline Revenue, (US$ Million), 2018 VS 2022 VS 2029
Figure 6. India Trampoline Market Size 2018-2029 (US$ Million)
Figure 7. India Trampoline Sales 2018-2029 (K Units)
Figure 8. India Trampoline Market Share in Global, in Value (US$ Million) 2018-2029
Figure 9. India Trampoline Market Share in Global, in Volume (K Units) 2018-2029
Figure 10. Trampoline Report Years Considered
Figure 11. Product Picture of Mini Trampoline
Figure 12. Product Picture of Medium Trampoline
Figure 13. Product Picture of Large Trampoline
Figure 14. Global Trampoline Market Share by Type in 2022 & 2029
Figure 15. Global Trampoline Sales in Value by Type (2018-2029) & (US$ Million)
Figure 16. Global Trampoline Sales Market Share in Value by Type (2018-2029)
Figure 17. Global Trampoline Sales by Type (2018-2029) & (K Units)
Figure 18. Global Trampoline Sales Market Share in Volume by Type (2018-2029)
Figure 19. Global Trampoline Price by Type (2018-2029) & (US$/Unit)
Figure 20. India Trampoline Market Share by Type in 2022 & 2029
Figure 21. India Trampoline Sales in Value by Type (2018-2029) & (US$ Million)
Figure 22. India Trampoline Sales Market Share in Value by Type (2018-2029)
Figure 23. India Trampoline Sales by Type (2018-2029) & (K Units)
Figure 24. India Trampoline Sales Market Share in Volume by Type (2018-2029)
Figure 25. India Trampoline Price by Type (2018-2029) & (US$/Unit)
Figure 26. Product Picture of Domestic Use
Figure 27. Product Picture of Trampoline Park Use
Figure 28. Product Picture of Other
Figure 29. Global Trampoline Market Share by Application in 2022 & 2029
Figure 30. Global Trampoline Sales in Value by Application (2018-2029) & (US$ Million)
Figure 31. Global Trampoline Sales Market Share in Value by Application (2018-2029)
Figure 32. Global Trampoline Sales by Application (2018-2029) & (K Units)
Figure 33. Global Trampoline Sales Market Share in Volume by Application (2018-2029)
Figure 34. Global Trampoline Price by Application (2018-2029) & (US$/Unit)
Figure 35. India Trampoline Market Share by Application in 2022 & 2029
Figure 36. India Trampoline Sales in Value by Application (2018-2029) & (US$ Million)
Figure 37. India Trampoline Sales Market Share in Value by Application (2018-2029)
Figure 38. India Trampoline Sales by Application (2018-2029) & (K Units)
Figure 39. India Trampoline Sales Market Share in Volume by Application (2018-2029)
Figure 40. India Trampoline Price by Application (2018-2029) & (US$/Unit)
Figure 41. Americas Trampoline Sales in Volume Growth Rate 2018-2029 (K Units)
Figure 42. Americas Trampoline Sales in Value Growth Rate 2018-2029 (US$ Million)
Figure 43. Americas Trampoline Sales by Type (2018-2029) & (K Units)
Figure 44. Americas Trampoline Sales Market Share in Volume by Type (2018-2029)
Figure 45. Americas Trampoline Sales by Application (2018-2029) & (K Units)
Figure 46. Americas Trampoline Sales Market Share in Volume by Application (2018-2029)
Figure 47. United States Trampoline Sales in Value Growth Rate (2018-2029) & (US$ Million)
Figure 48. Canada Trampoline Sales in Value Growth Rate (2018-2029) & (US$ Million)
Figure 49. Mexico Trampoline Sales in Value Growth Rate (2018-2029) & (US$ Million)
Figure 50. Brazil Trampoline Sales in Value Growth Rate (2018-2029) & (US$ Million)
Figure 51. EMEA Trampoline Sales in Volume Growth Rate 2018-2029 (K Units)
Figure 52. EMEA Trampoline Sales in Value Growth Rate 2018-2029 (US$ Million)
Figure 53. EMEA Trampoline Sales by Type (2018-2029) & (K Units)
Figure 54. EMEA Trampoline Sales Market Share in Volume by Type (2018-2029)
Figure 55. EMEA Trampoline Sales by Application (2018-2029) & (K Units)
Figure 56. EMEA Trampoline Sales Market Share in Volume by Application (2018-2029)
Figure 57. Europe Trampoline Sales in Value Growth Rate (2018-2029) & (US$ Million)
Figure 58. Middle East Trampoline Sales in Value Growth Rate (2018-2029) & (US$ Million)
Figure 59. Africa Trampoline Sales in Value Growth Rate (2018-2029) & (US$ Million)
Figure 60. China Trampoline Sales in Volume Growth Rate 2018-2029 (K Units)
Figure 61. China Trampoline Sales in Value Growth Rate 2018-2029 (US$ Million)
Figure 62. China Trampoline Sales by Type (2018-2029) & (K Units)
Figure 63. China Trampoline Sales Market Share in Volume by Type (2018-2029)
Figure 64. China Trampoline Sales by Application (2018-2029) & (K Units)
Figure 65. China Trampoline Sales Market Share in Volume by Application (2018-2029)
Figure 66. APAC Trampoline Sales in Volume Growth Rate 2018-2029 (K Units)
Figure 67. APAC Trampoline Sales in Value Growth Rate 2018-2029 (US$ Million)
Figure 68. APAC Trampoline Sales by Type (2018-2029) & (K Units)
Figure 69. APAC Trampoline Sales Market Share in Volume by Type (2018-2029)
Figure 70. APAC Trampoline Sales by Application (2018-2029) & (K Units)
Figure 71. APAC Trampoline Sales Market Share in Volume by Application (2018-2029)
Figure 72. Japan Trampoline Sales in Value Growth Rate (2018-2029) & (US$ Million)
Figure 73. South Korea Trampoline Sales in Value Growth Rate (2018-2029) & (US$ Million)
Figure 74. China Taiwan Trampoline Sales in Value Growth Rate (2018-2029) & (US$ Million)
Figure 75. Southeast Asia Trampoline Sales in Value Growth Rate (2018-2029) & (US$ Million)
Figure 76. India Trampoline Sales in Value Growth Rate (2018-2029) & (US$ Million)
Figure 77. Trampoline Value Chain
Figure 78. Trampoline Production Process
Figure 79. Channels of Distribution
Figure 80. Distributors Profiles
Figure 81. Bottom-up and Top-down Approaches for This Report
Figure 82. Data Triangulation
Figure 83. Key Executives Interviewed