List of Tables
Table 1. Global In-store Music Service Market Size Growth Rate by Type (US$ Million): 2021 vs 2025 vs 2032
Table 2. Key Players of Streaming Media Service
Table 3. Key Players of Audio Equipment
Table 4. Global In-store Music Service Market Size Growth by Application (US$ Million): 2021 vs 2025 vs 2032
Table 5. Global In-store Music Service Market Size by Region (US$ Million): 2021 vs 2025 vs 2032
Table 6. Global In-store Music Service Market Size by Region (US$ Million), 2021–2026
Table 7. Global In-store Music Service Market Share by Region (2021–2026)
Table 8. Global In-store Music Service Forecasted Market Size by Region (US$ Million), 2027–2032
Table 9. Global In-store Music Service Market Share by Region (2027–2032)
Table 10. In-store Music Service Market Trends
Table 11. In-store Music Service Market Drivers
Table 12. In-store Music Service Market Challenges
Table 13. In-store Music Service Market Restraints
Table 14. Global In-store Music Service Revenue by Players (US$ Million), 2021–2026
Table 15. Global In-store Music Service Market Share by Players (2021–2026)
Table 16. Global Top In-store Music Service Players by Tier (Tier 1, Tier 2, and Tier 3), based on In-store Music Service Revenue, 2025
Table 17. Ranking of Global Top In-store Music Service Companies by Revenue (US$ Million) in 2025
Table 18. Global 5 Largest Players Market Share by In-store Music Service Revenue (CR5 and HHI), 2021–2026
Table 19. Global Key Players of In-store Music Service, Headquarters and Area Served
Table 20. Global Key Players of In-store Music Service, Products and Applications
Table 21. Global Key Players of In-store Music Service, Date of General Availability (GA)
Table 22. Mergers and Acquisitions, Expansion Plans
Table 23. Global In-store Music Service Market Size by Type (US$ Million), 2021–2026
Table 24. Global In-store Music Service Revenue Market Share by Type (2021–2026)
Table 25. Global In-store Music Service Forecasted Market Size by Type (US$ Million), 2027–2032
Table 26. Global In-store Music Service Revenue Market Share by Type (2027–2032)
Table 27. Global In-store Music Service Market Size by Application (US$ Million), 2021–2026
Table 28. Global In-store Music Service Revenue Market Share by Application (2021–2026)
Table 29. Global In-store Music Service Forecasted Market Size by Application (US$ Million), 2027–2032
Table 30. Global In-store Music Service Revenue Market Share by Application (2027–2032)
Table 31. North America In-store Music Service Market Size Growth Rate by Country (US$ Million): 2021 vs 2025 vs 2032
Table 32. North America In-store Music Service Market Size by Country (US$ Million), 2021–2026
Table 33. North America In-store Music Service Market Size by Country (US$ Million), 2027–2032
Table 34. Europe In-store Music Service Market Size Growth Rate by Country (US$ Million): 2021 vs 2025 vs 2032
Table 35. Europe In-store Music Service Market Size by Country (US$ Million), 2021–2026
Table 36. Europe In-store Music Service Market Size by Country (US$ Million), 2027–2032
Table 37. Asia-Pacific In-store Music Service Market Size Growth Rate by Region (US$ Million): 2021 vs 2025 vs 2032
Table 38. Asia-Pacific In-store Music Service Market Size by Region (US$ Million), 2021–2026
Table 39. Asia-Pacific In-store Music Service Market Size by Region (US$ Million), 2027–2032
Table 40. Latin America In-store Music Service Market Size Growth Rate by Country (US$ Million): 2021 vs 2025 vs 2032
Table 41. Latin America In-store Music Service Market Size by Country (US$ Million), 2021–2026
Table 42. Latin America In-store Music Service Market Size by Country (US$ Million), 2027–2032
Table 43. Middle East & Africa In-store Music Service Market Size Growth Rate by Country (US$ Million): 2021 vs 2025 vs 2032
Table 44. Middle East & Africa In-store Music Service Market Size by Country (US$ Million), 2021–2026
Table 45. Middle East & Africa In-store Music Service Market Size by Country (US$ Million), 2027–2032
Table 46. Mood Media Company Details
Table 47. Mood Media Business Overview
Table 48. Mood Media In-store Music Service Product
Table 49. Mood Media Revenue in In-store Music Service Business (US$ Million), 2021–2026
Table 50. Mood Media Recent Development
Table 51. PlayNetwork Company Details
Table 52. PlayNetwork Business Overview
Table 53. PlayNetwork In-store Music Service Product
Table 54. PlayNetwork Revenue in In-store Music Service Business (US$ Million), 2021–2026
Table 55. PlayNetwork Recent Development
Table 56. TouchTunes Company Details
Table 57. TouchTunes Business Overview
Table 58. TouchTunes In-store Music Service Product
Table 59. TouchTunes Revenue in In-store Music Service Business (US$ Million), 2021–2026
Table 60. TouchTunes Recent Development
Table 61. Usen Corporation Company Details
Table 62. Usen Corporation Business Overview
Table 63. Usen Corporation In-store Music Service Product
Table 64. Usen Corporation Revenue in In-store Music Service Business (US$ Million), 2021–2026
Table 65. Usen Corporation Recent Development
Table 66. SiriusXM for Business Company Details
Table 67. SiriusXM for Business Business Overview
Table 68. SiriusXM for Business In-store Music Service Product
Table 69. SiriusXM for Business Revenue in In-store Music Service Business (US$ Million), 2021–2026
Table 70. SiriusXM for Business Recent Development
Table 71. Pandora for Business Company Details
Table 72. Pandora for Business Business Overview
Table 73. Pandora for Business In-store Music Service Product
Table 74. Pandora for Business Revenue in In-store Music Service Business (US$ Million), 2021–2026
Table 75. Pandora for Business Recent Development
Table 76. Almotech Company Details
Table 77. Almotech Business Overview
Table 78. Almotech In-store Music Service Product
Table 79. Almotech Revenue in In-store Music Service Business (US$ Million), 2021–2026
Table 80. Almotech Recent Development
Table 81. Imagesound Company Details
Table 82. Imagesound Business Overview
Table 83. Imagesound In-store Music Service Product
Table 84. Imagesound Revenue in In-store Music Service Business (US$ Million), 2021–2026
Table 85. Imagesound Recent Development
Table 86. NSM Music. Company Details
Table 87. NSM Music. Business Overview
Table 88. NSM Music. In-store Music Service Product
Table 89. NSM Music. Revenue in In-store Music Service Business (US$ Million), 2021–2026
Table 90. NSM Music. Recent Development
Table 91. CSI Music Company Details
Table 92. CSI Music Business Overview
Table 93. CSI Music In-store Music Service Product
Table 94. CSI Music Revenue in In-store Music Service Business (US$ Million), 2021–2026
Table 95. CSI Music Recent Development
Table 96. Easy on Hold Company Details
Table 97. Easy on Hold Business Overview
Table 98. Easy on Hold In-store Music Service Product
Table 99. Easy on Hold Revenue in In-store Music Service Business (US$ Million), 2021–2026
Table 100. Easy on Hold Recent Development
Table 101. Sunflower Music Company Details
Table 102. Sunflower Music Business Overview
Table 103. Sunflower Music In-store Music Service Product
Table 104. Sunflower Music Revenue in In-store Music Service Business (US$ Million), 2021–2026
Table 105. Sunflower Music Recent Development
Table 106. Soundjack Company Details
Table 107. Soundjack Business Overview
Table 108. Soundjack In-store Music Service Product
Table 109. Soundjack Revenue in In-store Music Service Business (US$ Million), 2021–2026
Table 110. Soundjack Recent Development
Table 111. Xenon Music Media Company Details
Table 112. Xenon Music Media Business Overview
Table 113. Xenon Music Media In-store Music Service Product
Table 114. Xenon Music Media Revenue in In-store Music Service Business (US$ Million), 2021–2026
Table 115. Xenon Music Media Recent Development
Table 116. Soundtrack Your Brand Company Details
Table 117. Soundtrack Your Brand Business Overview
Table 118. Soundtrack Your Brand In-store Music Service Product
Table 119. Soundtrack Your Brand Revenue in In-store Music Service Business (US$ Million), 2021–2026
Table 120. Soundtrack Your Brand Recent Development
Table 121. Jamendo Listening Company Details
Table 122. Jamendo Listening Business Overview
Table 123. Jamendo Listening In-store Music Service Product
Table 124. Jamendo Listening Revenue in In-store Music Service Business (US$ Million), 2021–2026
Table 125. Jamendo Listening Recent Development
Table 126. Heartbeats International Company Details
Table 127. Heartbeats International Business Overview
Table 128. Heartbeats International In-store Music Service Product
Table 129. Heartbeats International Revenue in In-store Music Service Business (US$ Million), 2021–2026
Table 130. Heartbeats International Recent Development
Table 131. SoundMachine Company Details
Table 132. SoundMachine Business Overview
Table 133. SoundMachine In-store Music Service Product
Table 134. SoundMachine Revenue in In-store Music Service Business (US$ Million), 2021–2026
Table 135. SoundMachine Recent Development
Table 136. Rockbot Company Details
Table 137. Rockbot Business Overview
Table 138. Rockbot In-store Music Service Product
Table 139. Rockbot Revenue in In-store Music Service Business (US$ Million), 2021–2026
Table 140. Rockbot Recent Development
Table 141. Jukeboxy Company Details
Table 142. Jukeboxy Business Overview
Table 143. Jukeboxy In-store Music Service Product
Table 144. Jukeboxy Revenue in In-store Music Service Business (US$ Million), 2021–2026
Table 145. Jukeboxy Recent Development
Table 146. Cloud Cover Music Company Details
Table 147. Cloud Cover Music Business Overview
Table 148. Cloud Cover Music In-store Music Service Product
Table 149. Cloud Cover Music Revenue in In-store Music Service Business (US$ Million), 2021–2026
Table 150. Cloud Cover Music Recent Development
Table 151. Custom Channels Company Details
Table 152. Custom Channels Business Overview
Table 153. Custom Channels In-store Music Service Product
Table 154. Custom Channels Revenue in In-store Music Service Business (US$ Million), 2021–2026
Table 155. Custom Channels Recent Development
Table 156. Auracle Sound Company Details
Table 157. Auracle Sound Business Overview
Table 158. Auracle Sound In-store Music Service Product
Table 159. Auracle Sound Revenue in In-store Music Service Business (US$ Million), 2021–2026
Table 160. Auracle Sound Recent Development
Table 161. Brandtrack Company Details
Table 162. Brandtrack Business Overview
Table 163. Brandtrack In-store Music Service Product
Table 164. Brandtrack Revenue in In-store Music Service Business (US$ Million), 2021–2026
Table 165. Brandtrack Recent Development
Table 166. Kasimu Company Details
Table 167. Kasimu Business Overview
Table 168. Kasimu In-store Music Service Product
Table 169. Kasimu Revenue in In-store Music Service Business (US$ Million), 2021–2026
Table 170. Kasimu Recent Development
Table 171. Soundreef Company Details
Table 172. Soundreef Business Overview
Table 173. Soundreef In-store Music Service Product
Table 174. Soundreef Revenue in In-store Music Service Business (US$ Million), 2021–2026
Table 175. Soundreef Recent Development
Table 176. Express Melody Company Details
Table 177. Express Melody Business Overview
Table 178. Express Melody In-store Music Service Product
Table 179. Express Melody Revenue in In-store Music Service Business (US$ Million), 2021–2026
Table 180. Express Melody Recent Development
Table 181. Qsic Company Details
Table 182. Qsic Business Overview
Table 183. Qsic In-store Music Service Product
Table 184. Qsic Revenue in In-store Music Service Business (US$ Million), 2021–2026
Table 185. Qsic Recent Development
Table 186. StorePlay Company Details
Table 187. StorePlay Business Overview
Table 188. StorePlay In-store Music Service Product
Table 189. StorePlay Revenue in In-store Music Service Business (US$ Million), 2021–2026
Table 190. StorePlay Recent Development
Table 191. Open Ear Music Company Details
Table 192. Open Ear Music Business Overview
Table 193. Open Ear Music In-store Music Service Product
Table 194. Open Ear Music Revenue in In-store Music Service Business (US$ Million), 2021–2026
Table 195. Open Ear Music Recent Development
Table 196. Research Programs/Design for This Report
Table 197. Key Data Information from Secondary Sources
Table 198. Key Data Information from Primary Sources
Table 199. Authors List of This Report
List of Figures
Figure 1. In-store Music Service Picture
Figure 2. Global In-store Music Service Market Size Comparison by Type (US$ Million), 2021–2032
Figure 3. Global In-store Music Service Market Share by Type: 2025 vs 2032
Figure 4. Streaming Media Service Features
Figure 5. Audio Equipment Features
Figure 6. Global In-store Music Service Market Size by Application (US$ Million), 2021–2032
Figure 7. Global In-store Music Service Market Share by Application: 2025 vs 2032
Figure 8. Retail Stores Case Studies
Figure 9. Cafes and Restaurants Case Studies
Figure 10. Leisure Places and Hotels Case Studies
Figure 11. Public Institutions Case Studies
Figure 12. Others Case Studies
Figure 13. In-store Music Service Report Years Considered
Figure 14. Global In-store Music Service Market Size (US$ Million), Year-over-Year: 2021–2032
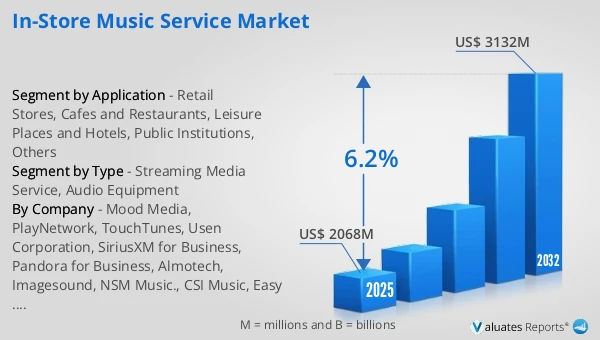
Figure 15. Global In-store Music Service Market Size, (US$ Million), 2021 vs 2025 vs 2032
Figure 16. Global In-store Music Service Market Share by Region: 2025 vs 2032
Figure 17. Global In-store Music Service Market Share by Players in 2025
Figure 18. Global In-store Music Service Market Share by Company Type (Tier 1, Tier 2, and Tier 3)
Figure 19. The Top 10 and 5 Players Market Share by In-store Music Service Revenue in 2025
Figure 20. North America In-store Music Service Market Size YoY Growth (US$ Million), 2021–2032
Figure 21. North America In-store Music Service Market Share by Country (2021–2032)
Figure 22. United States In-store Music Service Market Size YoY Growth (US$ Million), 2021–2032
Figure 23. Canada In-store Music Service Market Size YoY Growth (US$ Million), 2021–2032
Figure 24. Europe In-store Music Service Market Size YoY Growth (US$ Million), 2021–2032
Figure 25. Europe In-store Music Service Market Share by Country (2021–2032)
Figure 26. Germany In-store Music Service Market Size YoY Growth (US$ Million), 2021–2032
Figure 27. France In-store Music Service Market Size YoY Growth (US$ Million), 2021–2032
Figure 28. U.K. In-store Music Service Market Size YoY Growth (US$ Million), 2021–2032
Figure 29. Italy In-store Music Service Market Size YoY Growth (US$ Million), 2021–2032
Figure 30. Russia In-store Music Service Market Size YoY Growth (US$ Million), 2021–2032
Figure 31. Ireland In-store Music Service Market Size YoY Growth (US$ Million), 2021–2032
Figure 32. Asia-Pacific In-store Music Service Market Size YoY Growth (US$ Million), 2021–2032
Figure 33. Asia-Pacific In-store Music Service Market Share by Region (2021–2032)
Figure 34. China In-store Music Service Market Size YoY Growth (US$ Million), 2021–2032
Figure 35. Japan In-store Music Service Market Size YoY Growth (US$ Million), 2021–2032
Figure 36. South Korea In-store Music Service Market Size YoY Growth (US$ Million), 2021–2032
Figure 37. Southeast Asia In-store Music Service Market Size YoY Growth (US$ Million), 2021–2032
Figure 38. India In-store Music Service Market Size YoY Growth (US$ Million), 2021–2032
Figure 39. Australia & New Zealand In-store Music Service Market Size YoY Growth (US$ Million), 2021–2032
Figure 40. Latin America In-store Music Service Market Size YoY Growth (US$ Million), 2021–2032
Figure 41. Latin America In-store Music Service Market Share by Country (2021–2032)
Figure 42. Mexico In-store Music Service Market Size YoY Growth (US$ Million), 2021–2032
Figure 43. Brazil In-store Music Service Market Size YoY Growth (US$ Million), 2021–2032
Figure 44. Middle East & Africa In-store Music Service Market Size YoY Growth (US$ Million), 2021–2032
Figure 45. Middle East & Africa In-store Music Service Market Share by Country (2021–2032)
Figure 46. Israel In-store Music Service Market Size YoY Growth (US$ Million), 2021–2032
Figure 47. Saudi Arabia In-store Music Service Market Size YoY Growth (US$ Million), 2021–2032
Figure 48. UAE In-store Music Service Market Size YoY Growth (US$ Million), 2021–2032
Figure 49. Mood Media Revenue Growth Rate in In-store Music Service Business (2021–2026)
Figure 50. PlayNetwork Revenue Growth Rate in In-store Music Service Business (2021–2026)
Figure 51. TouchTunes Revenue Growth Rate in In-store Music Service Business (2021–2026)
Figure 52. Usen Corporation Revenue Growth Rate in In-store Music Service Business (2021–2026)
Figure 53. SiriusXM for Business Revenue Growth Rate in In-store Music Service Business (2021–2026)
Figure 54. Pandora for Business Revenue Growth Rate in In-store Music Service Business (2021–2026)
Figure 55. Almotech Revenue Growth Rate in In-store Music Service Business (2021–2026)
Figure 56. Imagesound Revenue Growth Rate in In-store Music Service Business (2021–2026)
Figure 57. NSM Music. Revenue Growth Rate in In-store Music Service Business (2021–2026)
Figure 58. CSI Music Revenue Growth Rate in In-store Music Service Business (2021–2026)
Figure 59. Easy on Hold Revenue Growth Rate in In-store Music Service Business (2021–2026)
Figure 60. Sunflower Music Revenue Growth Rate in In-store Music Service Business (2021–2026)
Figure 61. Soundjack Revenue Growth Rate in In-store Music Service Business (2021–2026)
Figure 62. Xenon Music Media Revenue Growth Rate in In-store Music Service Business (2021–2026)
Figure 63. Soundtrack Your Brand Revenue Growth Rate in In-store Music Service Business (2021–2026)
Figure 64. Jamendo Listening Revenue Growth Rate in In-store Music Service Business (2021–2026)
Figure 65. Heartbeats International Revenue Growth Rate in In-store Music Service Business (2021–2026)
Figure 66. SoundMachine Revenue Growth Rate in In-store Music Service Business (2021–2026)
Figure 67. Rockbot Revenue Growth Rate in In-store Music Service Business (2021–2026)
Figure 68. Jukeboxy Revenue Growth Rate in In-store Music Service Business (2021–2026)
Figure 69. Cloud Cover Music Revenue Growth Rate in In-store Music Service Business (2021–2026)
Figure 70. Custom Channels Revenue Growth Rate in In-store Music Service Business (2021–2026)
Figure 71. Auracle Sound Revenue Growth Rate in In-store Music Service Business (2021–2026)
Figure 72. Brandtrack Revenue Growth Rate in In-store Music Service Business (2021–2026)
Figure 73. Kasimu Revenue Growth Rate in In-store Music Service Business (2021–2026)
Figure 74. Soundreef Revenue Growth Rate in In-store Music Service Business (2021–2026)
Figure 75. Express Melody Revenue Growth Rate in In-store Music Service Business (2021–2026)
Figure 76. Qsic Revenue Growth Rate in In-store Music Service Business (2021–2026)
Figure 77. StorePlay Revenue Growth Rate in In-store Music Service Business (2021–2026)
Figure 78. Open Ear Music Revenue Growth Rate in In-store Music Service Business (2021–2026)
Figure 79. Bottom-up and Top-down Approaches for This Report
Figure 80. Data Triangulation
Figure 81. Key Executives Interviewed