0
U.S. (TOLL FREE)
+1 (315) 215-3225
Automative

0
U.S. (TOLL FREE)
+1 (315) 215-3225
Electronic Warfare Market Size, Share, Statistics & Trends Analysis Report By Type, By Application, By Region, and Segment Forecasts, 2021-2026
Published Date: March 2020
|
Report Code: QYRE-Auto-12Z1749
Home | Market Reports | Law & Government| Military
Global Electronic Warfare Market Size Status and Forecast 2020 2026
BUY CHAPTERS

Electronic Warfare Market Size, Share, Statistics & Trends Analysis Report By Type, By Application, By Region, and Segment Forecasts, 2021-2026

Code: QYRE-Auto-12Z1749
Report
March 2020
Pages:127
QYResearch
Buy Now with 15% Discount
DESCRIPTION
TABLE OF CONTENT
TABLES & FIGURES

Electronic Warfare Market Statistics

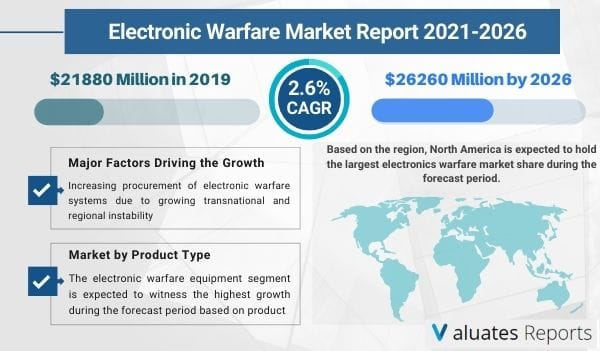
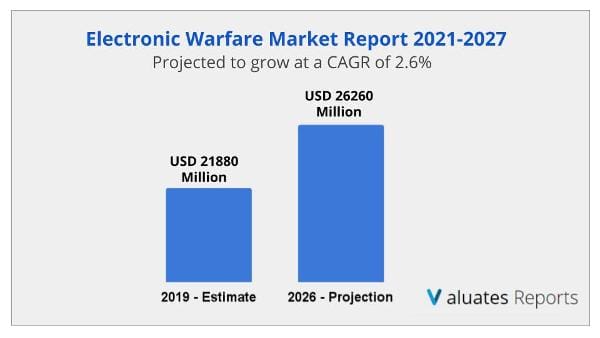
The global Electronic Warfare market size is projected to reach US$ 26260 million by 2026, from US$ 21880 million in 2019, at a CAGR of 2.6% during the forecast period 2021-2026. Increasing procurement of electronic warfare systems due to growing transnational and regional instability is expected to drive electronic warfare market size growth. The growing frequency of bilateral militarized conflicts between countries is increasing rapidly, leading to the need for countries' defense forces to improve their security measures. The introduction of digital battlefields has propelled all defense systems used during combat missions to integrate electronic warfare technology.
 
Electronic Warfare Market
 
This report focuses on the global Electronic Warfare status, future forecast, growth opportunity, key market and key players. The study objectives are to present the Electronic Warfare development in North America, Europe, China, Japan, Southeast Asia, India and Central & South America.

Major factors driving the growth of electronic warfare market size are:

  • Increasing conflicts and disputes among countries to fuel growth
  • Significant technological advancements and integration of electronics in military equipment 
  • Rising adoption of electronic warfare in UAV platforms to boost growth

The development of new-generation air and missile defense systems is expected to fuel the growth of the electronic warfare market size.

The development of new-generation missiles with high-end technologies is a major threat to strategic locations and platforms such as military airbases and ships. Some of these latest technologies include ballistic missiles and high-speed cruise missiles that are nuclear-capable. These advances have contributed to the need for electronic warfare systems for new-generation high-speed air defense. Governments around the world are concentrating on developing stealth aircraft but are also investing extensively in sophisticated surveillance systems to fight stealth technology at the same time.
Electronic Warfare Market size
 
Furthermore, the increase in popularity of small electronic systems that can be integrated into platforms such as patrol vessels and unmanned aerial vehicles (UAVs) is also expected to increase the growth of the electronic warfare market size.

The electronic warfare equipment segment is expected to witness the highest growth during the forecast period based on product.

This rapid growth is attributed to the increasing procurement of electronic warfare equipment in military ships and aircraft due to benefits such as advanced electronic protection and electronic support applications.

Based on the region, North America is expected to hold the largest electronics warfare market share during the forecast period.

This dominance of North America is attributed to the increased investments from various private and government entities. The US is regarded as one of the world's leading manufacturers, exporters, and consumers of EW systems and is considered to have the best EW capabilities.
 
On the other hand, Asia Pacific is expected to exhibit rapid growth backed by the need to enhance the warfighting capabilities of the defense forces in developing countries, such as India and China.

Major Players in the Electronic Warfare Market

  • Elbit Systems
  • Israel Aerospace Industries
  • Lockheed Martin
  • Boeing
  • Saab
  • Thales
  • Textron
  • Bae Systems
  • Raytheon
  • L3 Technologies
  • Rockwell Collins
  • Teledyne Technologies
  • Harris
  • Leonardo
  • General Dynamics

Electronic Warfare Market Segments

Electronic Warfare Market by Type

  • Electronic Warfare Equipment
  • Electronic Warfare Operational Support

Electronic Warfare Market by Application

  • Airborne
  • Ground
  • Naval
  • Space

Electronic Warfare Market by Regions/Countries

  • North America
  • Europe
  • China
  • Japan
  • Southeast Asia
  • India
  • Central & South America

Frequently Asked Questions About This Report

1. Which region is expected to hold the largest electronic warfare market share?

Ans. Based on the region, North America is expected to hold the largest electronic warfare market share during the forecast period.

2. What are the key trends in the electronics warfare market?

Ans. increasing procurement of electronic warfare systems due to growing transnational and regional instability is expected to drive electronic warfare market size growth.

3. Who are the key players in the electronic warfare market?

Ans. The major players operating in the electronic warfare market are Elbit Systems, Israel Aerospace Industries, Lockheed Martin, Boeing, Saab, Thales, Textron, Bae Systems, Raytheon, L3 Technologies, Rockwell Collins, Teledyne Technologies, Harris, Leonardo, General Dynamics

4. What would be the forecast period in the electronic warfare market?

Ans. The forecast period considered for the global electronic warfare market is 2021 to 2026

5. How big is the electronic warfare market?

Ans. The global electronic Warfare Market size is projected to reach USD 26,260 Million by 2026, from USD 21,880 Million in 2019, at a CAGR of 2.6% during the forecast period 2021-2026.

6. Which is the most influencing segment growing in the global electronic warfare market report?

Ans. The electronic warfare equipment segment is expected to witness the highest growth during the forecast period based on product.

Table of Contents
 
1 Report Overview
1.1 Study Scope
1.2 Key Market Segments
1.3 Players Covered: Ranking by Electronic Warfare Revenue
1.4 Market Analysis by Type
1.4.1 Global Electronic Warfare Market Size Growth Rate by Type: 2020 VS 2026
1.4.2 Electronic Warfare Equipment
1.4.3 Electronic Warfare Operational Support
1.5 Market by Application
1.5.1 Global Electronic Warfare Market Share by Application: 2020 VS 2026
1.5.2 Airborne
1.5.3 Ground
1.5.4 Naval
1.5.5 Space
1.6 Study Objectives
1.7 Years Considered
2 Global Growth Trends by Regions
2.1 Electronic Warfare Market Perspective (2015-2026)
2.2 Electronic Warfare Growth Trends by Regions
2.2.1 Electronic Warfare Market Size by Regions: 2015 VS 2020 VS 2026
2.2.2 Electronic Warfare Historic Market Share by Regions (2015-2020)
2.2.3 Electronic Warfare Forecasted Market Size by Regions (2021-2026)
2.3 Industry Trends and Growth Strategy
2.3.1 Market Top Trends
2.3.2 Market Drivers
2.3.3 Market Challenges
2.3.4 Porter’s Five Forces Analysis
2.3.5 Electronic Warfare Market Growth Strategy
2.3.6 Primary Interviews with Key Electronic Warfare Players (Opinion Leaders)
3 Competition Landscape by Key Players
3.1 Global Top Electronic Warfare Players by Market Size
3.1.1 Global Top Electronic Warfare Players by Revenue (2015-2020)
3.1.2 Global Electronic Warfare Revenue Market Share by Players (2015-2020)
3.1.3 Global Electronic Warfare Market Share by Company Type (Tier 1, Tier 2 and Tier 3)
3.2 Global Electronic Warfare Market Concentration Ratio
3.2.1 Global Electronic Warfare Market Concentration Ratio (CR5 and HHI)
3.2.2 Global Top 10 and Top 5 Companies by Electronic Warfare Revenue in 2019
3.3 Electronic Warfare Key Players Head office and Area Served
3.4 Key Players Electronic Warfare Product Solution and Service
3.5 Date of Enter into Electronic Warfare Market
3.6 Mergers & Acquisitions, Expansion Plans
4 Breakdown Data by Type (2015-2026)
4.1 Global Electronic Warfare Historic Market Size by Type (2015-2020)
4.2 Global Electronic Warfare Forecasted Market Size by Type (2021-2026)
5 Electronic Warfare Breakdown Data by Application (2015-2026)
5.1 Global Electronic Warfare Market Size by Application (2015-2020)
5.2 Global Electronic Warfare Forecasted Market Size by Application (2021-2026)
6 North America
6.1 North America Electronic Warfare Market Size (2015-2020)
6.2 Electronic Warfare Key Players in North America (2019-2020)
6.3 North America Electronic Warfare Market Size by Type (2015-2020)
6.4 North America Electronic Warfare Market Size by Application (2015-2020)
7 Europe
7.1 Europe Electronic Warfare Market Size (2015-2020)
7.2 Electronic Warfare Key Players in Europe (2019-2020)
7.3 Europe Electronic Warfare Market Size by Type (2015-2020)
7.4 Europe Electronic Warfare Market Size by Application (2015-2020)
8 China
8.1 China Electronic Warfare Market Size (2015-2020)
8.2 Electronic Warfare Key Players in China (2019-2020)
8.3 China Electronic Warfare Market Size by Type (2015-2020)
8.4 China Electronic Warfare Market Size by Application (2015-2020)
9 Japan
9.1 Japan Electronic Warfare Market Size (2015-2020)
9.2 Electronic Warfare Key Players in Japan (2019-2020)
9.3 Japan Electronic Warfare Market Size by Type (2015-2020)
9.4 Japan Electronic Warfare Market Size by Application (2015-2020)
10 Southeast Asia
10.1 Southeast Asia Electronic Warfare Market Size (2015-2020)
10.2 Electronic Warfare Key Players in Southeast Asia (2019-2020)
10.3 Southeast Asia Electronic Warfare Market Size by Type (2015-2020)
10.4 Southeast Asia Electronic Warfare Market Size by Application (2015-2020)
11 India
11.1 India Electronic Warfare Market Size (2015-2020)
11.2 Electronic Warfare Key Players in India (2019-2020)
11.3 India Electronic Warfare Market Size by Type (2015-2020)
11.4 India Electronic Warfare Market Size by Application (2015-2020)
12 Central & South America
12.1 Central & South America Electronic Warfare Market Size (2015-2020)
12.2 Electronic Warfare Key Players in Central & South America (2019-2020)
12.3 Central & South America Electronic Warfare Market Size by Type (2015-2020)
12.4 Central & South America Electronic Warfare Market Size by Application (2015-2020)
13 Key Players Profiles
13.1 Elbit Systems
13.1.1 Elbit Systems Company Details
13.1.2 Elbit Systems Business Overview and Its Total Revenue
13.1.3 Elbit Systems Electronic Warfare Introduction
13.1.4 Elbit Systems Revenue in Electronic Warfare Business (2015-2020))
13.1.5 Elbit Systems Recent Development
13.2 Israel Aerospace Industries
13.2.1 Israel Aerospace Industries Company Details
13.2.2 Israel Aerospace Industries Business Overview and Its Total Revenue
13.2.3 Israel Aerospace Industries Electronic Warfare Introduction
13.2.4 Israel Aerospace Industries Revenue in Electronic Warfare Business (2015-2020)
13.2.5 Israel Aerospace Industries Recent Development
13.3 Lockheed Martin
13.3.1 Lockheed Martin Company Details
13.3.2 Lockheed Martin Business Overview and Its Total Revenue
13.3.3 Lockheed Martin Electronic Warfare Introduction
13.3.4 Lockheed Martin Revenue in Electronic Warfare Business (2015-2020)
13.3.5 Lockheed Martin Recent Development
13.4 Boeing
13.4.1 Boeing Company Details
13.4.2 Boeing Business Overview and Its Total Revenue
13.4.3 Boeing Electronic Warfare Introduction
13.4.4 Boeing Revenue in Electronic Warfare Business (2015-2020)
13.4.5 Boeing Recent Development
13.5 Saab
13.5.1 Saab Company Details
13.5.2 Saab Business Overview and Its Total Revenue
13.5.3 Saab Electronic Warfare Introduction
13.5.4 Saab Revenue in Electronic Warfare Business (2015-2020)
13.5.5 Saab Recent Development
13.6 Thales
13.6.1 Thales Company Details
13.6.2 Thales Business Overview and Its Total Revenue
13.6.3 Thales Electronic Warfare Introduction
13.6.4 Thales Revenue in Electronic Warfare Business (2015-2020)
13.6.5 Thales Recent Development
13.7 Textron
13.7.1 Textron Company Details
13.7.2 Textron Business Overview and Its Total Revenue
13.7.3 Textron Electronic Warfare Introduction
13.7.4 Textron Revenue in Electronic Warfare Business (2015-2020)
13.7.5 Textron Recent Development
13.8 Bae Systems
13.8.1 Bae Systems Company Details
13.8.2 Bae Systems Business Overview and Its Total Revenue
13.8.3 Bae Systems Electronic Warfare Introduction
13.8.4 Bae Systems Revenue in Electronic Warfare Business (2015-2020)
13.8.5 Bae Systems Recent Development
13.9 Raytheon
13.9.1 Raytheon Company Details
13.9.2 Raytheon Business Overview and Its Total Revenue
13.9.3 Raytheon Electronic Warfare Introduction
13.9.4 Raytheon Revenue in Electronic Warfare Business (2015-2020)
13.9.5 Raytheon Recent Development
13.10 L3 Technologies
13.10.1 L3 Technologies Company Details
13.10.2 L3 Technologies Business Overview and Its Total Revenue
13.10.3 L3 Technologies Electronic Warfare Introduction
13.10.4 L3 Technologies Revenue in Electronic Warfare Business (2015-2020)
13.10.5 L3 Technologies Recent Development
13.11 Rockwell Collins
10.11.1 Rockwell Collins Company Details
10.11.2 Rockwell Collins Business Overview and Its Total Revenue
10.11.3 Rockwell Collins Electronic Warfare Introduction
10.11.4 Rockwell Collins Revenue in Electronic Warfare Business (2015-2020)
10.11.5 Rockwell Collins Recent Development
13.12 Teledyne Technologies
10.12.1 Teledyne Technologies Company Details
10.12.2 Teledyne Technologies Business Overview and Its Total Revenue
10.12.3 Teledyne Technologies Electronic Warfare Introduction
10.12.4 Teledyne Technologies Revenue in Electronic Warfare Business (2015-2020)
10.12.5 Teledyne Technologies Recent Development
13.13 Harris
10.13.1 Harris Company Details
10.13.2 Harris Business Overview and Its Total Revenue
10.13.3 Harris Electronic Warfare Introduction
10.13.4 Harris Revenue in Electronic Warfare Business (2015-2020)
10.13.5 Harris Recent Development
13.14 Leonardo
10.14.1 Leonardo Company Details
10.14.2 Leonardo Business Overview and Its Total Revenue
10.14.3 Leonardo Electronic Warfare Introduction
10.14.4 Leonardo Revenue in Electronic Warfare Business (2015-2020)
10.14.5 Leonardo Recent Development
13.15 General Dynamics
10.15.1 General Dynamics Company Details
10.15.2 General Dynamics Business Overview and Its Total Revenue
10.15.3 General Dynamics Electronic Warfare Introduction
10.15.4 General Dynamics Revenue in Electronic Warfare Business (2015-2020)
10.15.5 General Dynamics Recent Development
14 Analyst's Viewpoints/Conclusions
15 Appendix
15.1 Research Methodology
15.1.1 Methodology/Research Approach
15.1.2 Data Source
15.2 Disclaimer
15.3 Author Details
List of Tables
    Table 1. Electronic Warfare Key Market Segments
    Table 2. Key Players Covered: Ranking by Electronic Warfare Revenue
    Table 3. Ranking of Global Top Electronic Warfare Manufacturers by Revenue (US$ Million) in 2019
    Table 4. Global Electronic Warfare Market Size Growth Rate by Type (US$ Million): 2020 VS 2026
    Table 5. Key Players of Electronic Warfare Equipment
    Table 6. Key Players of Electronic Warfare Operational Support
    Table 7. Global Electronic Warfare Market Size Growth by Application (US$ Million): 2020 VS 2026
    Table 8. Global Electronic Warfare Market Size by Regions (US$ Million): 2020 VS 2026
    Table 9. Global Electronic Warfare Market Size by Regions (2015-2020) (US$ Million)
    Table 10. Global Electronic Warfare Market Share by Regions (2015-2020)
    Table 11. Global Electronic Warfare Forecasted Market Size by Regions (2021-2026) (US$ Million)
    Table 12. Global Electronic Warfare Market Share by Regions (2021-2026)
    Table 13. Market Top Trends
    Table 14. Key Drivers: Impact Analysis
    Table 15. Key Challenges
    Table 16. Electronic Warfare Market Growth Strategy
    Table 17. Main Points Interviewed from Key Electronic Warfare Players
    Table 18. Global Electronic Warfare Revenue by Players (2015-2020) (Million US$)
    Table 19. Global Electronic Warfare Market Share by Players (2015-2020)
    Table 20. Global Top Electronic Warfare Players by Company Type (Tier 1, Tier 2 and Tier 3) (based on the Revenue in Electronic Warfare as of 2019)
    Table 21. Global Electronic Warfare by Players Market Concentration Ratio (CR5 and HHI)
    Table 22. Key Players Headquarters and Area Served
    Table 23. Key Players Electronic Warfare Product Solution and Service
    Table 24. Date of Enter into Electronic Warfare Market
    Table 25. Mergers & Acquisitions, Expansion Plans
    Table 26. Global Electronic Warfare Market Size by Type (2015-2020) (Million US$)
    Table 27. Global Electronic Warfare Market Size Share by Type (2015-2020)
    Table 28. Global Electronic Warfare Revenue Market Share by Type (2021-2026)
    Table 29. Global Electronic Warfare Market Size Share by Application (2015-2020)
    Table 30. Global Electronic Warfare Market Size by Application (2015-2020) (Million US$)
    Table 31. Global Electronic Warfare Market Size Share by Application (2021-2026)
    Table 32. North America Key Players Electronic Warfare Revenue (2019-2020) (Million US$)
    Table 33. North America Key Players Electronic Warfare Market Share (2019-2020)
    Table 34. North America Electronic Warfare Market Size by Type (2015-2020) (Million US$)
    Table 35. North America Electronic Warfare Market Share by Type (2015-2020)
    Table 36. North America Electronic Warfare Market Size by Application (2015-2020) (Million US$)
    Table 37. North America Electronic Warfare Market Share by Application (2015-2020)
    Table 38. Europe Key Players Electronic Warfare Revenue (2019-2020) (Million US$)
    Table 39. Europe Key Players Electronic Warfare Market Share (2019-2020)
    Table 40. Europe Electronic Warfare Market Size by Type (2015-2020) (Million US$)
    Table 41. Europe Electronic Warfare Market Share by Type (2015-2020)
    Table 42. Europe Electronic Warfare Market Size by Application (2015-2020) (Million US$)
    Table 43. Europe Electronic Warfare Market Share by Application (2015-2020)
    Table 44. China Key Players Electronic Warfare Revenue (2019-2020) (Million US$)
    Table 45. China Key Players Electronic Warfare Market Share (2019-2020)
    Table 46. China Electronic Warfare Market Size by Type (2015-2020) (Million US$)
    Table 47. China Electronic Warfare Market Share by Type (2015-2020)
    Table 48. China Electronic Warfare Market Size by Application (2015-2020) (Million US$)
    Table 49. China Electronic Warfare Market Share by Application (2015-2020)
    Table 50. Japan Key Players Electronic Warfare Revenue (2019-2020) (Million US$)
    Table 51. Japan Key Players Electronic Warfare Market Share (2019-2020)
    Table 52. Japan Electronic Warfare Market Size by Type (2015-2020) (Million US$)
    Table 53. Japan Electronic Warfare Market Share by Type (2015-2020)
    Table 54. Japan Electronic Warfare Market Size by Application (2015-2020) (Million US$)
    Table 55. Japan Electronic Warfare Market Share by Application (2015-2020)
    Table 56. Southeast Asia Key Players Electronic Warfare Revenue (2019-2020) (Million US$)
    Table 57. Southeast Asia Key Players Electronic Warfare Market Share (2019-2020)
    Table 58. Southeast Asia Electronic Warfare Market Size by Type (2015-2020) (Million US$)
    Table 59. Southeast Asia Electronic Warfare Market Share by Type (2015-2020)
    Table 60. Southeast Asia Electronic Warfare Market Size by Application (2015-2020) (Million US$)
    Table 61. Southeast Asia Electronic Warfare Market Share by Application (2015-2020)
    Table 62. India Key Players Electronic Warfare Revenue (2019-2020) (Million US$)
    Table 63. India Key Players Electronic Warfare Market Share (2019-2020)
    Table 64. India Electronic Warfare Market Size by Type (2015-2020) (Million US$)
    Table 65. India Electronic Warfare Market Share by Type (2015-2020)
    Table 66. India Electronic Warfare Market Size by Application (2015-2020) (Million US$)
    Table 67. India Electronic Warfare Market Share by Application (2015-2020)
    Table 68. Central & South America Key Players Electronic Warfare Revenue (2019-2020) (Million US$)
    Table 69. Central & South America Key Players Electronic Warfare Market Share (2019-2020)
    Table 70. Central & South America Electronic Warfare Market Size by Type (2015-2020) (Million US$)
    Table 71. Central & South America Electronic Warfare Market Share by Type (2015-2020)
    Table 72. Central & South America Electronic Warfare Market Size by Application (2015-2020) (Million US$)
    Table 73. Central & South America Electronic Warfare Market Share by Application (2015-2020)
    Table 74. Elbit Systems Company Details
    Table 75. Elbit Systems Business Overview
    Table 76. Elbit Systems Product
    Table 77. Elbit Systems Revenue in Electronic Warfare Business (2015-2020) (Million US$)
    Table 78. Elbit Systems Recent Development
    Table 79. Israel Aerospace Industries Company Details
    Table 80. Israel Aerospace Industries Business Overview
    Table 81. Israel Aerospace Industries Product
    Table 82. Israel Aerospace Industries Revenue in Electronic Warfare Business (2015-2020) (Million US$)
    Table 83. Israel Aerospace Industries Recent Development
    Table 84. Lockheed Martin Company Details
    Table 85. Lockheed Martin Business Overview
    Table 86. Lockheed Martin Product
    Table 87. Lockheed Martin Revenue in Electronic Warfare Business (2015-2020) (Million US$)
    Table 88. Lockheed Martin Recent Development
    Table 89. Boeing Company Details
    Table 90. Boeing Business Overview
    Table 91. Boeing Product
    Table 92. Boeing Revenue in Electronic Warfare Business (2015-2020) (Million US$)
    Table 93. Boeing Recent Development
    Table 94. Saab Company Details
    Table 95. Saab Business Overview
    Table 96. Saab Product
    Table 97. Saab Revenue in Electronic Warfare Business (2015-2020) (Million US$)
    Table 98. Saab Recent Development
    Table 99. Thales Company Details
    Table 100. Thales Business Overview
    Table 101. Thales Product
    Table 102. Thales Revenue in Electronic Warfare Business (2015-2020) (Million US$)
    Table 103. Thales Recent Development
    Table 104. Textron Company Details
    Table 105. Textron Business Overview
    Table 106. Textron Product
    Table 107. Textron Revenue in Electronic Warfare Business (2015-2020) (Million US$)
    Table 108. Textron Recent Development
    Table 109. Bae Systems Business Overview
    Table 110. Bae Systems Product
    Table 111. Bae Systems Company Details
    Table 112. Bae Systems Revenue in Electronic Warfare Business (2015-2020) (Million US$)
    Table 113. Bae Systems Recent Development
    Table 114. Raytheon Company Details
    Table 115. Raytheon Business Overview
    Table 116. Raytheon Product
    Table 117. Raytheon Revenue in Electronic Warfare Business (2015-2020) (Million US$)
    Table 118. Raytheon Recent Development
    Table 119. L3 Technologies Company Details
    Table 120. L3 Technologies Business Overview
    Table 121. L3 Technologies Product
    Table 122. L3 Technologies Revenue in Electronic Warfare Business (2015-2020) (Million US$)
    Table 123. L3 Technologies Recent Development
    Table 124. Rockwell Collins Company Details
    Table 125. Rockwell Collins Business Overview
    Table 126. Rockwell Collins Product
    Table 127. Rockwell Collins Revenue in Electronic Warfare Business (2015-2020) (Million US$)
    Table 128. Rockwell Collins Recent Development
    Table 129. Teledyne Technologies Company Details
    Table 130. Teledyne Technologies Business Overview
    Table 131. Teledyne Technologies Product
    Table 132. Teledyne Technologies Revenue in Electronic Warfare Business (2015-2020) (Million US$)
    Table 133. Teledyne Technologies Recent Development
    Table 134. Harris Company Details
    Table 135. Harris Business Overview
    Table 136. Harris Product
    Table 137. Harris Revenue in Electronic Warfare Business (2015-2020) (Million US$)
    Table 138. Harris Recent Development
    Table 139. Leonardo Company Details
    Table 140. Leonardo Business Overview
    Table 141. Leonardo Product
    Table 142. Leonardo Revenue in Electronic Warfare Business (2015-2020) (Million US$)
    Table 143. Leonardo Recent Development
    Table 144. General Dynamics Company Details
    Table 145. General Dynamics Business Overview
    Table 146. General Dynamics Product
    Table 147. General Dynamics Revenue in Electronic Warfare Business (2015-2020) (Million US$)
    Table 148. General Dynamics Recent Development
    Table 149. Research Programs/Design for This Report
    Table 150. Key Data Information from Secondary Sources
    Table 151. Key Data Information from Primary Sources
List of Figures
    Figure 1. Global Electronic Warfare Market Share by Type: 2020 VS 2026
    Figure 2. Electronic Warfare Equipment Features
    Figure 3. Electronic Warfare Operational Support Features
    Figure 4. Global Electronic Warfare Market Share by Application: 2020 VS 2026
    Figure 5. Airborne Case Studies
    Figure 6. Ground Case Studies
    Figure 7. Naval Case Studies
    Figure 8. Space Case Studies
    Figure 9. Electronic Warfare Report Years Considered
    Figure 10. Global Electronic Warfare Market Size YoY Growth 2015-2026 (US$ Million)
    Figure 11. Global Electronic Warfare Market Share by Regions: 2020 VS 2026
    Figure 12. Global Electronic Warfare Market Share by Regions (2021-2026)
    Figure 13. Porter's Five Forces Analysis
    Figure 14. Global Electronic Warfare Market Share by Players in 2019
    Figure 15. Global Top Electronic Warfare Players by Company Type (Tier 1, Tier 2 and Tier 3) (based on the Revenue in Electronic Warfare as of 2019
    Figure 16. The Top 10 and 5 Players Market Share by Electronic Warfare Revenue in 2019
    Figure 17. North America Electronic Warfare Market Size YoY Growth (2015-2020) (Million US$)
    Figure 18. Europe Electronic Warfare Market Size YoY Growth (2015-2020) (Million US$)
    Figure 19. China Electronic Warfare Market Size YoY Growth (2015-2020) (Million US$)
    Figure 20. Japan Electronic Warfare Market Size YoY Growth (2015-2020) (Million US$)
    Figure 21. Southeast Asia Electronic Warfare Market Size YoY Growth (2015-2020) (Million US$)
    Figure 22. India Electronic Warfare Market Size YoY Growth (2015-2020) (Million US$)
    Figure 23. Central & South America Electronic Warfare Market Size YoY Growth (2015-2020) (Million US$)
    Figure 24. Elbit Systems Total Revenue (US$ Million): 2019 Compared with 2018
    Figure 25. Elbit Systems Revenue Growth Rate in Electronic Warfare Business (2015-2020)
    Figure 26. Israel Aerospace Industries Total Revenue (US$ Million): 2019 Compared with 2018
    Figure 27. Israel Aerospace Industries Revenue Growth Rate in Electronic Warfare Business (2015-2020)
    Figure 28. Lockheed Martin Total Revenue (US$ Million): 2019 Compared with 2018
    Figure 29. Lockheed Martin Revenue Growth Rate in Electronic Warfare Business (2015-2020)
    Figure 30. Boeing Total Revenue (US$ Million): 2019 Compared with 2018
    Figure 31. Boeing Revenue Growth Rate in Electronic Warfare Business (2015-2020)
    Figure 32. Saab Total Revenue (US$ Million): 2019 Compared with 2018
    Figure 33. Saab Revenue Growth Rate in Electronic Warfare Business (2015-2020)
    Figure 34. Thales Total Revenue (US$ Million): 2019 Compared with 2018
    Figure 35. Thales Revenue Growth Rate in Electronic Warfare Business (2015-2020)
    Figure 36. Textron Total Revenue (US$ Million): 2019 Compared with 2018
    Figure 37. Textron Revenue Growth Rate in Electronic Warfare Business (2015-2020)
    Figure 38. Bae Systems Total Revenue (US$ Million): 2019 Compared with 2018
    Figure 39. Bae Systems Revenue Growth Rate in Electronic Warfare Business (2015-2020)
    Figure 40. Raytheon Total Revenue (US$ Million): 2019 Compared with 2018
    Figure 41. Raytheon Revenue Growth Rate in Electronic Warfare Business (2015-2020)
    Figure 42. L3 Technologies Total Revenue (US$ Million): 2019 Compared with 2018
    Figure 43. L3 Technologies Revenue Growth Rate in Electronic Warfare Business (2015-2020)
    Figure 44. Rockwell Collins Total Revenue (US$ Million): 2019 Compared with 2018
    Figure 45. Rockwell Collins Revenue Growth Rate in Electronic Warfare Business (2015-2020)
    Figure 46. Teledyne Technologies Total Revenue (US$ Million): 2019 Compared with 2018
    Figure 47. Teledyne Technologies Revenue Growth Rate in Electronic Warfare Business (2015-2020)
    Figure 48. Harris Total Revenue (US$ Million): 2019 Compared with 2018
    Figure 49. Harris Revenue Growth Rate in Electronic Warfare Business (2015-2020)
    Figure 50. Leonardo Total Revenue (US$ Million): 2019 Compared with 2018
    Figure 51. Leonardo Revenue Growth Rate in Electronic Warfare Business (2015-2020)
    Figure 52. General Dynamics Total Revenue (US$ Million): 2019 Compared with 2018
    Figure 53. General Dynamics Revenue Growth Rate in Electronic Warfare Business (2015-2020)
    Figure 54. Bottom-up and Top-down Approaches for This Report
    Figure 55. Data Triangulation
    Figure 56. Key Executives Interviewed
SELECT A FORMAT
Added to Cart
Electronic (PDF)

$3900

This license allows only one user to access the PDF.
Electronic (PDF)

$5850

This license allows 1 - 5 user to access the PDF, license is suitable for small groups of 5 users working together
Electronic (PDF)

$7800

This license allows users/teams in a same Enterprise to use this report, various departments within an enterpise can use this report
Add to Cart
Buy Now (15% Discount)

OUR CUSTOMER

Accenture

RELATED REPORTS

Global Man Portable Military Electronics Market Research Report 2024

120 Pages
Type: Report
Code: QYRE-Auto-21F6143
Mon Apr 15 00:00:00 UTC 2024

Add to Cart

Global Military Biometrics Market Research Report 2024

120 Pages
Type: Report
Code: QYRE-Auto-25G6074
Tue Apr 02 00:00:00 UTC 2024

Add to Cart

Jeep-Style Military Vehicle - Global Market Share and Ranking, Overall Sales and Demand Forecast 2024-2030

120 Pages
Type: Report
Code: QYRE-Auto-35Q13750
Tue Mar 26 00:00:00 UTC 2024

Add to Cart

Offshore Patrol Vessels - Global Market Share and Ranking, Overall Sales and Demand Forecast 2024-2030

120 Pages
Type: Report
Code: QYRE-Auto-3315
Thu Mar 21 00:00:00 UTC 2024

Add to Cart