0
U.S. (TOLL FREE)
+1 (315) 215-3225
Automative

0
U.S. (TOLL FREE)
+1 (315) 215-3225
Electric Random Orbital Sander- Global Market Share and Ranking, Overall Sales and Demand Forecast 2026-2032
Published Date: 2026-01-13
|
Report Code: QYRE-Auto-13C14675
Home | Market Reports | Business & Industrial| Industrial Materials & Equipment| Heavy Machinery
Global Electric Random Orbital Sander Market Research Report 2023
BUY CHAPTERS

Electric Random Orbital Sander- Global Market Share and Ranking, Overall Sales and Demand Forecast 2026-2032

Code: QYRE-Auto-13C14675
Report
2026-01-13
Pages:132
QYResearch
Buy Now with 15% Discount
DESCRIPTION
TABLE OF CONTENT
TABLES & FIGURES

Electric Random Orbital Sander- Market Size

The global market for Electric Random Orbital Sander was estimated to be worth US$ 493 million in 2025 and is projected to reach US$ 708 million, growing at a CAGR of 5.3% from 2026 to 2032.

Electric Random Orbital Sander- Market

Electric Random Orbital Sander- Market

The potential shifts in the 2025 U.S. tariff framework pose substantial volatility risks to global markets. This report provides a comprehensive assessment of recent tariff adjustments and international strategic countermeasures on Electric Random Orbital Sander cross-border industrial footprints, capital allocation patterns, regional economic interdependencies, and supply chain reconfigurations.
In 2025, the global sales volume of Electric Random Orbital Sander was approximately 4,700,000 units, with an average price of USD105 per unit and a gross profit margin of 24%-29%. This product is a handheld sander that uses a circular sanding disc to perform a combination of rotation and eccentric revolution. A typical product consists of a motor (brushed/brushless) and eccentric mechanism, a 5–6 inch back disc, a brake ring, bearings and vibration damping structure, a dustbin/vacuum inlet, speed control and soft-start circuitry, a PA/ABS housing and a rubber grip. Common parameters are typically a disc diameter of 125/150 mm, an eccentricity of 2.5–5.0 mm, an idle speed of approximately 7,000–12,000 OPM, and vibration and noise levels that meet mainstream professional tool standards. It also generally supports external vacuum cleaners (with hose diameters typically 25–35 mm). In terms of typical usage: A fine decoration/woodwork installation team usually has 2-6 units per vehicle (divided into coarse and fine mesh grades + backup machines), a small to medium-sized cabinet factory usually has 10-30 units per workstation (panel sanding, edge banding and finishing, pre-painting treatment areas), and an automotive body and paint shop usually has 1-2 units per workstation in the putty and primer sanding process, which are tied to the vacuum dust collection system as standard tooling.
The growth logic of this product category stems more from "the expansion of application scenarios + stricter delivery standards" than from the simple popularity of DIY: On the one hand, scenarios such as customized home furnishings, high-end decoration, old house renovation, and car repair have increasingly lower tolerance for "surface consistency." Issues such as swirl marks, transparent bottoms, and whitening will ultimately translate into rework time and claims costs, driving more contractors and factories to upgrade the random track handheld sander from "optional tool" to "standard equipment for every workstation." On the other hand, rising requirements for dust control and occupational health have made the dust collection ecosystem (interfaces, vacuum cleaner linkage, and consumable accessories) a source of brand premium. Industry competition has shifted from "selling a machine" to "selling a replicable sanding workstation." High-end brands lock ASP and repurchase (sandpaper/back plate/filter bag) into lifecycle revenue through low vibration, strong dust collection, and platformization, while mid-to-low-end brands maintain scale through retail volume and price range coverage. Upstream, fluctuations in the supply and cost of motors, bearings, and power devices directly impact the stability and gross profit of the entire machine. Downstream, channel concentration (large retailers, private label brands) compresses the bargaining power of individual machines, forcing manufacturers to exchange "increased workstation efficiency, reduced rework rates, and compliance endorsements (low dust)" for higher project winning rates and packaged profit margins. Overall, the key to success in this market is not "whose machines run faster," but "who can make surface quality, dust, efficiency, and platform reusability quantifiable delivery standards," thereby transforming tools into a sustainable pool of consumables and workstation ecosystem profits.
This report provides a comprehensive view of the global market for Electric Random Orbital Sander, covering total sales volume, sales revenue, pricing, the market share and ranking of key companies, along with analyses by region & country, by Type, and by Application.
The Electric Random Orbital Sander market size, estimations, and forecasts are presented in terms of sales volume (K Units) and revenue ($ millions), with 2025 as the base year and historical and forecast data from 2021 to 2032. The report combines quantitative and qualitative analysis to help readers develop growth strategies, assess the competitive landscape, evaluate their position in the current marketplace, and make informed business decisions regarding Electric Random Orbital Sander.
Market Segmentation

Scope of Electric Random Orbital Sander- Market Report

Report Metric Details
Report Name Electric Random Orbital Sander- Market
CAGR 5.3%
Segment by Type
  • 125 mm
  • 150 mm
  • Others
Segment by Power Source
  • 12V
  • 18V
Segment by Eccentricity
  • 2.5-3 mm
  • 3-4 mm
  • 4-5 mm
Segment by Application
  • Automotive
  • Aerospace
  • Woodworking
  • Metalworking
  • Others
By Region
  • North America (United States, Canada)
  • Europe (Germany, France, UK, Italy, Russia) Rest of Europe
  • Nordic Countries
  • Asia-Pacific (China, Japan, South Korea)
  • Southeast Asia (India, Australia)
  • Rest of Asia
  • Latin America (Mexico, Brazil)
  • Rest of Latin America
  • Middle East & Africa (Turkey, Saudi Arabia, UAE, Rest of MEA)
Consumption by Region
  • North America (United States, Canada)
  • Europe (Germany, France, UK, Italy, Russia)
  • Asia-Pacific (China, Japan, South Korea, Taiwan)
  • Southeast Asia (India)
  • Latin America (Mexico, Brazil)
By Company DEWALT, Bosch, Makita, Metabo, Einhell, Mirka, Jet Tools, Ingersoll Rand, 3M, TTI, Festool, Dynabrade, Chicago Pneumatic, HiKOKI, SKIL, WEN Products, KUKEN, Nitto Kohki, Sumake, Harbor Freight
Forecast units USD million in value
Report coverage Revenue and volume forecast, company share, competitive landscape, growth factors and trends

Chapter Outline

  • Chapter 1: Introduces the scope of the report and the global market size (value, volume, and price). It also summarizes market dynamics and Recent Developments; identifies key drivers and restraints; outlines challenges and risks for manufacturers; reviews relevant industry policies and U.S. tariff implications.
  • Chapter 2: Provides a detailed analysis of the Electric Random Orbital Sander manufacturers' competitive landscape—including pricing, sales and revenue shares, Recent Developments plans, and mergers and acquisitions (M&A).
  • Chapter 3: Analyzes market segmentation by Type, presenting the size and growth potential of each segment to help readers identify blue-ocean opportunities.
  • Chapter 4: Analyzes market segmentation by Application, presenting the size and growth potential of each downstream segment to help readers identify blue-ocean opportunities.
  • Chapter 5: Presents Electric Random Orbital Sander sales and revenue at the regional level. It offers a quantitative assessment of market size and growth potential by region and summarizes market development, future prospects, addressable space, and country-level market size worldwide.
  • Chapter 6: Presents Electric Random Orbital Sander sales and revenue at the country level. It provides segmented data by Type and by Application for each country/region.
  • Chapter 7: Profiles key players, detailing the main companies' product sales, revenue, pricing, gross margin, product portfolios, Recent Developments, etc.
  • Chapter 8: Analyzes the industry value chain, including upstream suppliers and downstream applications/customers.
  • Chapter 9: Conclusion.

FAQ for this report

Who are the main players in the Electric Random Orbital Sander- Market report?

Ans: The main players in the Electric Random Orbital Sander- Market are DEWALT, Bosch, Makita, Metabo, Einhell, Mirka, Jet Tools, Ingersoll Rand, 3M, TTI, Festool, Dynabrade, Chicago Pneumatic, HiKOKI, SKIL, WEN Products, KUKEN, Nitto Kohki, Sumake, Harbor Freight

What are the Application segmentation covered in the Electric Random Orbital Sander- Market report?

Ans: The Applications covered in the Electric Random Orbital Sander- Market report are Automotive, Aerospace, Woodworking, Metalworking, Others

What are the Type segmentation covered in the Electric Random Orbital Sander- Market report?

Ans: The Types covered in the Electric Random Orbital Sander- Market report are 125 mm, 150 mm, Others

1 Market Overview
1.1 Electric Random Orbital Sander Product Introduction
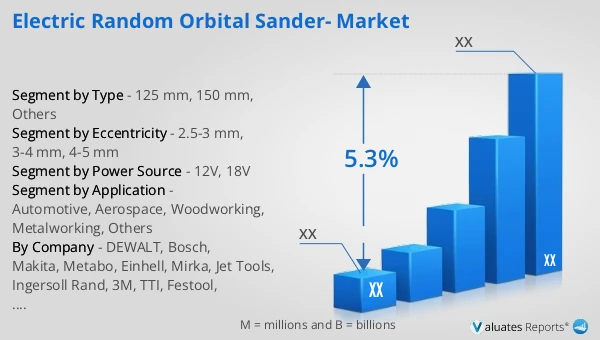
1.2 Global Electric Random Orbital Sander Market Size Forecast
1.2.1 Global Electric Random Orbital Sander Sales Value (2021–2032)
1.2.2 Global Electric Random Orbital Sander Sales Volume (2021–2032)
1.2.3 Global Electric Random Orbital Sander Sales Price (2021–2032)
1.3 Electric Random Orbital Sander Market Trends & Drivers
1.3.1 Electric Random Orbital Sander Industry Trends
1.3.2 Electric Random Orbital Sander Market Drivers & Opportunities
1.3.3 Electric Random Orbital Sander Market Challenges
1.3.4 Electric Random Orbital Sander Market Restraints
1.3.5 Impact of U.S. Tariffs
1.4 Assumptions and Limitations
1.5 Study Objectives
1.6 Years Considered
2 Competitive Analysis by Company
2.1 Global Electric Random Orbital Sander Players Revenue Ranking (2025)
2.2 Global Electric Random Orbital Sander Revenue by Company (2021–2026)
2.3 Global Electric Random Orbital Sander Sales Volume Ranking of Players (2025)
2.4 Global Electric Random Orbital Sander Sales Volume by Company (2021–2026)
2.5 Global Electric Random Orbital Sander Average Price by Company (2021–2026)
2.6 Key Manufacturers Electric Random Orbital Sander Manufacturing Base and Headquarters
2.7 Key Manufacturers Electric Random Orbital Sander Product Offerings
2.8 Key Manufacturers Start of Mass Production of Electric Random Orbital Sander
2.9 Electric Random Orbital Sander Market Competitive Analysis
2.9.1 Electric Random Orbital Sander Market Concentration Rate (2021–2026)
2.9.2 Global 5 and 10 Largest Manufacturers by Electric Random Orbital Sander Revenue in 2025
2.9.3 Global Companies by Tier (Tier 1, Tier 2, Tier 3), based on Electric Random Orbital Sander revenue, 2025
2.10 Mergers & Acquisitions and Expansion
3 Segmentation Electric Random Orbital Sander Market Classification
3.1 Introduction by Type
3.1.1 125 mm
3.1.2 150 mm
3.1.3 Others
3.1.4 Global Electric Random Orbital Sander Sales Value by Type
3.1.4.1 Global Electric Random Orbital Sander Sales Value by Type (2021 vs 2025 vs 2032)
3.1.4.2 Global Electric Random Orbital Sander Sales Value, by Type (2021–2032)
3.1.4.3 Global Electric Random Orbital Sander Sales Value, by Type (%), 2021–2032
3.1.5 Global Electric Random Orbital Sander Sales Volume by Type
3.1.5.1 Global Electric Random Orbital Sander Sales Volume by Type (2021 vs 2025 vs 2032)
3.1.5.2 Global Electric Random Orbital Sander Sales Volume, by Type (2021–2032)
3.1.5.3 Global Electric Random Orbital Sander Sales Volume, by Type (%), 2021–2032
3.1.6 Global Electric Random Orbital Sander Average Price by Type (2021–2032)
3.2 Introduction by Power Source
3.2.1 12V
3.2.2 18V
3.2.3 Global Electric Random Orbital Sander Sales Value by Power Source
3.2.3.1 Global Electric Random Orbital Sander Sales Value by Power Source (2021 vs 2025 vs 2032)
3.2.3.2 Global Electric Random Orbital Sander Sales Value, by Power Source (2021–2032)
3.2.3.3 Global Electric Random Orbital Sander Sales Value, by Power Source (%), 2021–2032
3.2.4 Global Electric Random Orbital Sander Sales Volume by Power Source
3.2.4.1 Global Electric Random Orbital Sander Sales Volume by Power Source (2021 vs 2025 vs 2032)
3.2.4.2 Global Electric Random Orbital Sander Sales Volume, by Power Source (2021–2032)
3.2.4.3 Global Electric Random Orbital Sander Sales Volume, by Power Source (%), 2021–2032
3.2.5 Global Electric Random Orbital Sander Average Price by Power Source (2021–2032)
3.3 Introduction by Eccentricity
3.3.1 2.5-3 mm
3.3.2 3-4 mm
3.3.3 4-5 mm
3.3.4 Global Electric Random Orbital Sander Sales Value by Eccentricity
3.3.4.1 Global Electric Random Orbital Sander Sales Value by Eccentricity (2021 vs 2025 vs 2032)
3.3.4.2 Global Electric Random Orbital Sander Sales Value, by Eccentricity (2021–2032)
3.3.4.3 Global Electric Random Orbital Sander Sales Value, by Eccentricity (%), 2021–2032
3.3.5 Global Electric Random Orbital Sander Sales Volume by Eccentricity
3.3.5.1 Global Electric Random Orbital Sander Sales Volume by Eccentricity (2021 vs 2025 vs 2032)
3.3.5.2 Global Electric Random Orbital Sander Sales Volume, by Eccentricity (2021–2032)
3.3.5.3 Global Electric Random Orbital Sander Sales Volume, by Eccentricity (%), 2021–2032
3.3.6 Global Electric Random Orbital Sander Average Price by Eccentricity (2021–2032)
4 Segmentation by Application
4.1 Introduction by Application
4.1.1 Automotive
4.1.2 Aerospace
4.1.3 Woodworking
4.1.4 Metalworking
4.1.5 Others
4.2 Global Electric Random Orbital Sander Sales Value by Application
4.2.1 Global Electric Random Orbital Sander Sales Value by Application (2021 vs 2025 vs 2032)
4.2.2 Global Electric Random Orbital Sander Sales Value, by Application (2021–2032)
4.2.3 Global Electric Random Orbital Sander Sales Value, by Application (%), 2021–2032
4.3 Global Electric Random Orbital Sander Sales Volume by Application
4.3.1 Global Electric Random Orbital Sander Sales Volume by Application (2021 vs 2025 vs 2032)
4.3.2 Global Electric Random Orbital Sander Sales Volume, by Application (2021–2032)
4.3.3 Global Electric Random Orbital Sander Sales Volume, by Application (%), 2021–2032
4.4 Global Electric Random Orbital Sander Average Price by Application (2021–2032)
5 Segmentation by Region
5.1 Global Electric Random Orbital Sander Sales Value by Region
5.1.1 Global Electric Random Orbital Sander Sales Value by Region: 2021 vs 2025 vs 2032
5.1.2 Global Electric Random Orbital Sander Sales Value by Region (2021–2026)
5.1.3 Global Electric Random Orbital Sander Sales Value by Region (2027–2032)
5.1.4 Global Electric Random Orbital Sander Sales Value by Region (%), 2021–2032
5.2 Global Electric Random Orbital Sander Sales Volume by Region
5.2.1 Global Electric Random Orbital Sander Sales Volume by Region: 2021 vs 2025 vs 2032
5.2.2 Global Electric Random Orbital Sander Sales Volume by Region (2021–2026)
5.2.3 Global Electric Random Orbital Sander Sales Volume by Region (2027–2032)
5.2.4 Global Electric Random Orbital Sander Sales Volume by Region (%), 2021–2032
5.3 Global Electric Random Orbital Sander Average Price by Region (2021–2032)
5.4 North America
5.4.1 North America Electric Random Orbital Sander Sales Value, 2021–2032
5.4.2 North America Electric Random Orbital Sander Sales Value by Country (%), 2025 vs 2032
5.5 Europe
5.5.1 Europe Electric Random Orbital Sander Sales Value, 2021–2032
5.5.2 Europe Electric Random Orbital Sander Sales Value by Country (%), 2025 vs 2032
5.6 Asia Pacific
5.6.1 Asia Pacific Electric Random Orbital Sander Sales Value, 2021–2032
5.6.2 Asia Pacific Electric Random Orbital Sander Sales Value by Region (%), 2025 vs 2032
5.7 South America
5.7.1 South America Electric Random Orbital Sander Sales Value, 2021–2032
5.7.2 South America Electric Random Orbital Sander Sales Value by Country (%), 2025 vs 2032
5.8 Middle East & Africa
5.8.1 Middle East & Africa Electric Random Orbital Sander Sales Value, 2021–2032
5.8.2 Middle East & Africa Electric Random Orbital Sander Sales Value by Country (%), 2025 vs 2032
6 Segmentation by Key Countries/Regions
6.1 Key Countries/Regions Electric Random Orbital Sander Sales Value Growth Trends, 2021 vs 2025 vs 2032
6.2 Key Countries/Regions Electric Random Orbital Sander Sales Value and Sales Volume
6.2.1 Key Countries/Regions Electric Random Orbital Sander Sales Value, 2021–2032
6.2.2 Key Countries/Regions Electric Random Orbital Sander Sales Volume, 2021–2032
6.3 United States
6.3.1 United States Electric Random Orbital Sander Sales Value, 2021–2032
6.3.2 United States Electric Random Orbital Sander Sales Value by Type (%), 2025 vs 2032
6.3.3 United States Electric Random Orbital Sander Sales Value by Application, 2025 vs 2032
6.4 Europe
6.4.1 Europe Electric Random Orbital Sander Sales Value, 2021–2032
6.4.2 Europe Electric Random Orbital Sander Sales Value by Type (%), 2025 vs 2032
6.4.3 Europe Electric Random Orbital Sander Sales Value by Application, 2025 vs 2032
6.5 China
6.5.1 China Electric Random Orbital Sander Sales Value, 2021–2032
6.5.2 China Electric Random Orbital Sander Sales Value by Type (%), 2025 vs 2032
6.5.3 China Electric Random Orbital Sander Sales Value by Application, 2025 vs 2032
6.6 Japan
6.6.1 Japan Electric Random Orbital Sander Sales Value, 2021–2032
6.6.2 Japan Electric Random Orbital Sander Sales Value by Type (%), 2025 vs 2032
6.6.3 Japan Electric Random Orbital Sander Sales Value by Application, 2025 vs 2032
6.7 South Korea
6.7.1 South Korea Electric Random Orbital Sander Sales Value, 2021–2032
6.7.2 South Korea Electric Random Orbital Sander Sales Value by Type (%), 2025 vs 2032
6.7.3 South Korea Electric Random Orbital Sander Sales Value by Application, 2025 vs 2032
6.8 Southeast Asia
6.8.1 Southeast Asia Electric Random Orbital Sander Sales Value, 2021–2032
6.8.2 Southeast Asia Electric Random Orbital Sander Sales Value by Type (%), 2025 vs 2032
6.8.3 Southeast Asia Electric Random Orbital Sander Sales Value by Application, 2025 vs 2032
6.9 India
6.9.1 India Electric Random Orbital Sander Sales Value, 2021–2032
6.9.2 India Electric Random Orbital Sander Sales Value by Type (%), 2025 vs 2032
6.9.3 India Electric Random Orbital Sander Sales Value by Application, 2025 vs 2032
7 Company Profiles
7.1 DEWALT
7.1.1 DEWALT Company Information
7.1.2 DEWALT Introduction and Business Overview
7.1.3 DEWALT Electric Random Orbital Sander Sales, Revenue, Price and Gross Margin (2021–2026)
7.1.4 DEWALT Electric Random Orbital Sander Product Offerings
7.1.5 DEWALT Recent Developments
7.2 Bosch
7.2.1 Bosch Company Information
7.2.2 Bosch Introduction and Business Overview
7.2.3 Bosch Electric Random Orbital Sander Sales, Revenue, Price and Gross Margin (2021–2026)
7.2.4 Bosch Electric Random Orbital Sander Product Offerings
7.2.5 Bosch Recent Developments
7.3 Makita
7.3.1 Makita Company Information
7.3.2 Makita Introduction and Business Overview
7.3.3 Makita Electric Random Orbital Sander Sales, Revenue, Price and Gross Margin (2021–2026)
7.3.4 Makita Electric Random Orbital Sander Product Offerings
7.3.5 Makita Recent Developments
7.4 Metabo
7.4.1 Metabo Company Information
7.4.2 Metabo Introduction and Business Overview
7.4.3 Metabo Electric Random Orbital Sander Sales, Revenue, Price and Gross Margin (2021–2026)
7.4.4 Metabo Electric Random Orbital Sander Product Offerings
7.4.5 Metabo Recent Developments
7.5 Einhell
7.5.1 Einhell Company Information
7.5.2 Einhell Introduction and Business Overview
7.5.3 Einhell Electric Random Orbital Sander Sales, Revenue, Price and Gross Margin (2021–2026)
7.5.4 Einhell Electric Random Orbital Sander Product Offerings
7.5.5 Einhell Recent Developments
7.6 Mirka
7.6.1 Mirka Company Information
7.6.2 Mirka Introduction and Business Overview
7.6.3 Mirka Electric Random Orbital Sander Sales, Revenue, Price and Gross Margin (2021–2026)
7.6.4 Mirka Electric Random Orbital Sander Product Offerings
7.6.5 Mirka Recent Developments
7.7 Jet Tools
7.7.1 Jet Tools Company Information
7.7.2 Jet Tools Introduction and Business Overview
7.7.3 Jet Tools Electric Random Orbital Sander Sales, Revenue, Price and Gross Margin (2021–2026)
7.7.4 Jet Tools Electric Random Orbital Sander Product Offerings
7.7.5 Jet Tools Recent Developments
7.8 Ingersoll Rand
7.8.1 Ingersoll Rand Company Information
7.8.2 Ingersoll Rand Introduction and Business Overview
7.8.3 Ingersoll Rand Electric Random Orbital Sander Sales, Revenue, Price and Gross Margin (2021–2026)
7.8.4 Ingersoll Rand Electric Random Orbital Sander Product Offerings
7.8.5 Ingersoll Rand Recent Developments
7.9 3M
7.9.1 3M Company Information
7.9.2 3M Introduction and Business Overview
7.9.3 3M Electric Random Orbital Sander Sales, Revenue, Price and Gross Margin (2021–2026)
7.9.4 3M Electric Random Orbital Sander Product Offerings
7.9.5 3M Recent Developments
7.10 TTI
7.10.1 TTI Company Information
7.10.2 TTI Introduction and Business Overview
7.10.3 TTI Electric Random Orbital Sander Sales, Revenue, Price and Gross Margin (2021–2026)
7.10.4 TTI Electric Random Orbital Sander Product Offerings
7.10.5 TTI Recent Developments
7.11 Festool
7.11.1 Festool Company Information
7.11.2 Festool Introduction and Business Overview
7.11.3 Festool Electric Random Orbital Sander Sales, Revenue, Price and Gross Margin (2021–2026)
7.11.4 Festool Electric Random Orbital Sander Product Offerings
7.11.5 Festool Recent Developments
7.12 Dynabrade
7.12.1 Dynabrade Company Information
7.12.2 Dynabrade Introduction and Business Overview
7.12.3 Dynabrade Electric Random Orbital Sander Sales, Revenue, Price and Gross Margin (2021–2026)
7.12.4 Dynabrade Electric Random Orbital Sander Product Offerings
7.12.5 Dynabrade Recent Developments
7.13 Chicago Pneumatic
7.13.1 Chicago Pneumatic Company Information
7.13.2 Chicago Pneumatic Introduction and Business Overview
7.13.3 Chicago Pneumatic Electric Random Orbital Sander Sales, Revenue, Price and Gross Margin (2021–2026)
7.13.4 Chicago Pneumatic Electric Random Orbital Sander Product Offerings
7.13.5 Chicago Pneumatic Recent Developments
7.14 HiKOKI
7.14.1 HiKOKI Company Information
7.14.2 HiKOKI Introduction and Business Overview
7.14.3 HiKOKI Electric Random Orbital Sander Sales, Revenue, Price and Gross Margin (2021–2026)
7.14.4 HiKOKI Electric Random Orbital Sander Product Offerings
7.14.5 HiKOKI Recent Developments
7.15 SKIL
7.15.1 SKIL Company Information
7.15.2 SKIL Introduction and Business Overview
7.15.3 SKIL Electric Random Orbital Sander Sales, Revenue, Price and Gross Margin (2021–2026)
7.15.4 SKIL Electric Random Orbital Sander Product Offerings
7.15.5 SKIL Recent Developments
7.16 WEN Products
7.16.1 WEN Products Company Information
7.16.2 WEN Products Introduction and Business Overview
7.16.3 WEN Products Electric Random Orbital Sander Sales, Revenue, Price and Gross Margin (2021–2026)
7.16.4 WEN Products Electric Random Orbital Sander Product Offerings
7.16.5 WEN Products Recent Developments
7.17 KUKEN
7.17.1 KUKEN Company Information
7.17.2 KUKEN Introduction and Business Overview
7.17.3 KUKEN Electric Random Orbital Sander Sales, Revenue, Price and Gross Margin (2021–2026)
7.17.4 KUKEN Electric Random Orbital Sander Product Offerings
7.17.5 KUKEN Recent Developments
7.18 Nitto Kohki
7.18.1 Nitto Kohki Company Information
7.18.2 Nitto Kohki Introduction and Business Overview
7.18.3 Nitto Kohki Electric Random Orbital Sander Sales, Revenue, Price and Gross Margin (2021–2026)
7.18.4 Nitto Kohki Electric Random Orbital Sander Product Offerings
7.18.5 Nitto Kohki Recent Developments
7.19 Sumake
7.19.1 Sumake Company Information
7.19.2 Sumake Introduction and Business Overview
7.19.3 Sumake Electric Random Orbital Sander Sales, Revenue, Price and Gross Margin (2021–2026)
7.19.4 Sumake Electric Random Orbital Sander Product Offerings
7.19.5 Sumake Recent Developments
7.20 Harbor Freight
7.20.1 Harbor Freight Company Information
7.20.2 Harbor Freight Introduction and Business Overview
7.20.3 Harbor Freight Electric Random Orbital Sander Sales, Revenue, Price and Gross Margin (2021–2026)
7.20.4 Harbor Freight Electric Random Orbital Sander Product Offerings
7.20.5 Harbor Freight Recent Developments
8 Industry Chain Analysis
8.1 Electric Random Orbital Sander Industrial Chain
8.2 Electric Random Orbital Sander Upstream Analysis
8.2.1 Key Raw Materials
8.2.2 Key Suppliers of Raw Materials
8.2.3 Manufacturing Cost Structure
8.3 Midstream Analysis
8.4 Downstream Analysis (Customer Analysis)
8.5 Sales Model and Sales Channelss
8.5.1 Electric Random Orbital Sander Sales Model
8.5.2 Sales Channels
8.5.3 Electric Random Orbital Sander Distributors
9 Research Findings and Conclusion
10 Appendix
10.1 Research Methodology
10.1.1 Methodology/Research Approach
10.1.1.1 Research Programs/Design
10.1.1.2 Market Size Estimation
10.1.1.3 Market Breakdown and Data Triangulation
10.1.2 Data Source
10.1.2.1 Secondary Sources
10.1.2.2 Primary Sources
10.2 Author Details
10.3 Disclaimer
List of Tables
 Table 1. Electric Random Orbital Sander Market Trends
 Table 2. Electric Random Orbital Sander Market Drivers & Opportunities
 Table 3. Electric Random Orbital Sander Market Challenges
 Table 4. Electric Random Orbital Sander Market Restraints


List of Figures
 Figure 1. Electric Random Orbital Sander Product Picture
 Figure 2. Global Electric Random Orbital Sander Sales Value, 2021 vs 2025 vs 2032 (US$ Million)
 Figure 3. Global Electric Random Orbital Sander Sales Value (US$ Million), 2021–2032
 Figure 4. Global Electric Random Orbital Sander Sales Volume (K Units), 2021–2032
 Figure 5. Global Electric Random Orbital Sander Sales Price (US$/Unit), 2021–2032
 Figure 6. Electric Random Orbital Sander Report Years Considered
 Figure 7. Global Electric Random Orbital Sander Players Revenue Ranking (US$ Million), 2025
 Figure 8. Global Electric Random Orbital Sander Sales Volume Ranking of Players (K Units), 2025
 Figure 9. The 5 and 10 Largest Manufacturers in the World: Market Share by Electric Random Orbital Sander Revenue in 2025
 Figure 10. Electric Random Orbital Sander Market Share by Company Type (Tier 1, Tier 2, and Tier 3): 2021 vs 2025
 Figure 11. 125 mm Picture
 Figure 12. 150 mm Picture
 Figure 13. Others Picture
 Figure 14. Global Electric Random Orbital Sander Sales Value by Type (US$ Million), 2021 vs 2025 vs 2032
 Figure 15. Global Electric Random Orbital Sander Sales Value Market Share by Type, 2025 & 2032
 Figure 16. Global Electric Random Orbital Sander Sales Volume by Type (K Units), 2021 vs 2025 vs 2032
 Figure 17. Global Electric Random Orbital Sander Sales Volume Market Share by Type, 2025 & 2032
 Figure 18. Global Electric Random Orbital Sander Price by Type (US$/Unit), 2021–2032
 Figure 19. 12V Picture
 Figure 20. 18V Picture
 Figure 21. Global Electric Random Orbital Sander Sales Value by Power Source (US$ Million), 2021 vs 2025 vs 2032
 Figure 22. Global Electric Random Orbital Sander Sales Value Market Share by Power Source, 2025 & 2032
 Figure 23. Global Electric Random Orbital Sander Sales Volume by Power Source (K Units), 2021 vs 2025 vs 2032
 Figure 24. Global Electric Random Orbital Sander Sales Volume Market Share by Power Source, 2025 & 2032
 Figure 25. Global Electric Random Orbital Sander Price by Power Source (US$/Unit), 2021–2032
 Figure 26. 2.5-3 mm Picture
 Figure 27. 3-4 mm Picture
 Figure 28. 4-5 mm Picture
 Figure 29. Global Electric Random Orbital Sander Sales Value by Eccentricity (US$ Million), 2021 vs 2025 vs 2032
 Figure 30. Global Electric Random Orbital Sander Sales Value Market Share by Eccentricity, 2025 & 2032
 Figure 31. Global Electric Random Orbital Sander Sales Volume by Eccentricity (K Units), 2021 vs 2025 vs 2032
 Figure 32. Global Electric Random Orbital Sander Sales Volume Market Share by Eccentricity, 2025 & 2032
 Figure 33. Global Electric Random Orbital Sander Price by Eccentricity (US$/Unit), 2021–2032
 Figure 34. Product Picture of Automotive
 Figure 35. Product Picture of Aerospace
 Figure 36. Product Picture of Woodworking
 Figure 37. Product Picture of Metalworking
 Figure 38. Product Picture of Others
 Figure 39. Global Electric Random Orbital Sander Sales Value by Application (US$ Million), 2021 vs 2025 vs 2032
 Figure 40. Global Electric Random Orbital Sander Sales Value Market Share by Application, 2025 & 2032
 Figure 41. Global Electric Random Orbital Sander Sales Volume by Application (K Units), 2021 vs 2025 vs 2032
 Figure 42. Global Electric Random Orbital Sander Sales Volume Market Share by Application, 2025 & 2032
 Figure 43. Global Electric Random Orbital Sander Price by Application (US$/Unit), 2021–2032
 Figure 44. North America Electric Random Orbital Sander Sales Value (US$ Million), 2021–2032
 Figure 45. North America Electric Random Orbital Sander Sales Value by Country (%), 2025 vs 2032
 Figure 46. Europe Electric Random Orbital Sander Sales Value (US$ Million), 2021–2032
 Figure 47. Europe Electric Random Orbital Sander Sales Value by Country (%), 2025 vs 2032
 Figure 48. Asia Pacific Electric Random Orbital Sander Sales Value (US$ Million), 2021–2032
 Figure 49. Asia Pacific Electric Random Orbital Sander Sales Value by Region (%), 2025 vs 2032
 Figure 50. South America Electric Random Orbital Sander Sales Value (US$ Million), 2021–2032
 Figure 51. South America Electric Random Orbital Sander Sales Value by Country (%), 2025 vs 2032
 Figure 52. Middle East & Africa Electric Random Orbital Sander Sales Value (US$ Million), 2021–2032
 Figure 53. Middle East & Africa Electric Random Orbital Sander Sales Value by Country (%), 2025 vs 2032
 Figure 54. Key Countries/Regions Electric Random Orbital Sander Sales Value (%), 2021–2032
 Figure 55. Key Countries/Regions Electric Random Orbital Sander Sales Volume (%), 2021–2032
 Figure 56. United States Electric Random Orbital Sander Sales Value (US$ Million), 2021–2032
 Figure 57. United States Electric Random Orbital Sander Sales Value by Type (%), 2025 vs 2032
 Figure 58. United States Electric Random Orbital Sander Sales Value by Application (%), 2025 vs 2032
 Figure 59. Europe Electric Random Orbital Sander Sales Value (US$ Million), 2021–2032
 Figure 60. Europe Electric Random Orbital Sander Sales Value by Type (%), 2025 vs 2032
 Figure 61. Europe Electric Random Orbital Sander Sales Value by Application (%), 2025 vs 2032
 Figure 62. China Electric Random Orbital Sander Sales Value (US$ Million), 2021–2032
 Figure 63. China Electric Random Orbital Sander Sales Value by Type (%), 2025 vs 2032
 Figure 64. China Electric Random Orbital Sander Sales Value by Application (%), 2025 vs 2032
 Figure 65. Japan Electric Random Orbital Sander Sales Value (US$ Million), 2021–2032
 Figure 66. Japan Electric Random Orbital Sander Sales Value by Type (%), 2025 vs 2032
 Figure 67. Japan Electric Random Orbital Sander Sales Value by Application (%), 2025 vs 2032
 Figure 68. South Korea Electric Random Orbital Sander Sales Value (US$ Million), 2021–2032
 Figure 69. South Korea Electric Random Orbital Sander Sales Value by Type (%), 2025 vs 2032
 Figure 70. South Korea Electric Random Orbital Sander Sales Value by Application (%), 2025 vs 2032
 Figure 71. Southeast Asia Electric Random Orbital Sander Sales Value (US$ Million), 2021–2032
 Figure 72. Southeast Asia Electric Random Orbital Sander Sales Value by Type (%), 2025 vs 2032
 Figure 73. Southeast Asia Electric Random Orbital Sander Sales Value by Application (%), 2025 vs 2032
 Figure 74. India Electric Random Orbital Sander Sales Value (US$ Million), 2021–2032
 Figure 75. India Electric Random Orbital Sander Sales Value by Type (%), 2025 vs 2032
 Figure 76. India Electric Random Orbital Sander Sales Value by Application (%), 2025 vs 2032
 Figure 77. Electric Random Orbital Sander Industrial Chain
 Figure 78. Electric Random Orbital Sander Manufacturing Cost Structure
 Figure 79. Channels of Distribution (Direct Sales, and Distribution)
 Figure 80. Bottom-up and Top-down Approaches for This Report
 Figure 81. Data Triangulation
 Figure 82. Key Executives Interviewed
SELECT A FORMAT
Added to Cart
Electronic

$3950

Single User License
Electronic

$5925

Multi User License
Electronic

$7900

Enterprise License
Add to Cart
Buy Now (15% Discount)

OUR CUSTOMER

Lukasiewicz Research Network