List of Tables
Table 1. Global Rebranding Agency Services Market Size Growth Rate by Service Type (US$ Million): 2020 VS 2024 VS 2031
Table 2. Key Players of Brand Strategy Consulting
Table 3. Key Players of Visual Identity Design
Table 4. Key Players of Brand Messaging Development
Table 5. Key Players of Digital Branding
Table 6. Key Players of Corporate Communication Services
Table 7. Global Rebranding Agency Services Market Size Growth Rate by Rebranding Scope (US$ Million): 2020 VS 2024 VS 2031
Table 8. Key Players of Partial Rebranding
Table 9. Key Players of Complete Rebranding
Table 10. Key Players of Merger or Acquisition Rebranding
Table 11. Key Players of Market Repositioning Rebranding
Table 12. Global Rebranding Agency Services Market Size Growth Rate by Industry Sector (US$ Million): 2020 VS 2024 VS 2031
Table 13. Key Players of Consumer Goods
Table 14. Key Players of Technology
Table 15. Key Players of Healthcare
Table 16. Key Players of Finance
Table 17. Key Players of Education
Table 18. Key Players of Hospitality
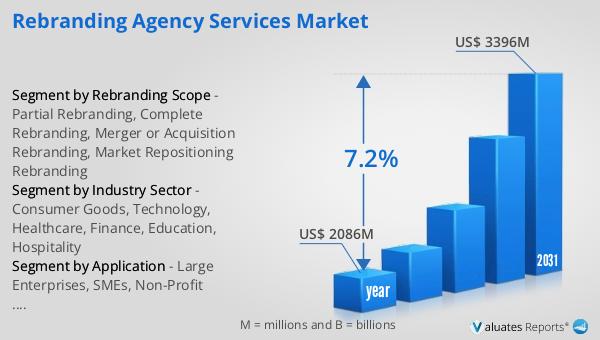
Table 19. Global Rebranding Agency Services Market Size Growth by Application (US$ Million): 2020 VS 2024 VS 2031
Table 20. Global Rebranding Agency Services Market Size by Region (US$ Million): 2020 VS 2024 VS 2031
Table 21. Global Rebranding Agency Services Market Size by Region (2020-2025) & (US$ Million)
Table 22. Global Rebranding Agency Services Market Share by Region (2020-2025)
Table 23. Global Rebranding Agency Services Forecasted Market Size by Region (2026-2031) & (US$ Million)
Table 24. Global Rebranding Agency Services Market Share by Region (2026-2031)
Table 25. Rebranding Agency Services Market Trends
Table 26. Rebranding Agency Services Market Drivers
Table 27. Rebranding Agency Services Market Challenges
Table 28. Rebranding Agency Services Market Restraints
Table 29. Global Rebranding Agency Services Revenue by Players (2020-2025) & (US$ Million)
Table 30. Global Rebranding Agency Services Market Share by Players (2020-2025)
Table 31. Global Top Rebranding Agency Services Players by Company Type (Tier 1, Tier 2, and Tier 3) & (based on the Revenue in Rebranding Agency Services as of 2024)
Table 32. Ranking of Global Top Rebranding Agency Services Companies by Revenue (US$ Million) in 2024
Table 33. Global 5 Largest Players Market Share by Rebranding Agency Services Revenue (CR5 and HHI) & (2020-2025)
Table 34. Global Key Players of Rebranding Agency Services, Headquarters and Area Served
Table 35. Global Key Players of Rebranding Agency Services, Product and Application
Table 36. Global Key Players of Rebranding Agency Services, Date of Enter into This Industry
Table 37. Mergers & Acquisitions, Expansion Plans
Table 38. Global Rebranding Agency Services Market Size by Service Type (2020-2025) & (US$ Million)
Table 39. Global Rebranding Agency Services Revenue Market Share by Service Type (2020-2025)
Table 40. Global Rebranding Agency Services Forecasted Market Size by Service Type (2026-2031) & (US$ Million)
Table 41. Global Rebranding Agency Services Revenue Market Share by Service Type (2026-2031)
Table 42. Global Rebranding Agency Services Market Size by Application (2020-2025) & (US$ Million)
Table 43. Global Rebranding Agency Services Revenue Market Share by Application (2020-2025)
Table 44. Global Rebranding Agency Services Forecasted Market Size by Application (2026-2031) & (US$ Million)
Table 45. Global Rebranding Agency Services Revenue Market Share by Application (2026-2031)
Table 46. North America Rebranding Agency Services Market Size Growth Rate by Country (US$ Million): 2020 VS 2024 VS 2031
Table 47. North America Rebranding Agency Services Market Size by Country (2020-2025) & (US$ Million)
Table 48. North America Rebranding Agency Services Market Size by Country (2026-2031) & (US$ Million)
Table 49. Europe Rebranding Agency Services Market Size Growth Rate by Country (US$ Million): 2020 VS 2024 VS 2031
Table 50. Europe Rebranding Agency Services Market Size by Country (2020-2025) & (US$ Million)
Table 51. Europe Rebranding Agency Services Market Size by Country (2026-2031) & (US$ Million)
Table 52. Asia-Pacific Rebranding Agency Services Market Size Growth Rate by Region (US$ Million): 2020 VS 2024 VS 2031
Table 53. Asia-Pacific Rebranding Agency Services Market Size by Region (2020-2025) & (US$ Million)
Table 54. Asia-Pacific Rebranding Agency Services Market Size by Region (2026-2031) & (US$ Million)
Table 55. Latin America Rebranding Agency Services Market Size Growth Rate by Country (US$ Million): 2020 VS 2024 VS 2031
Table 56. Latin America Rebranding Agency Services Market Size by Country (2020-2025) & (US$ Million)
Table 57. Latin America Rebranding Agency Services Market Size by Country (2026-2031) & (US$ Million)
Table 58. Middle East & Africa Rebranding Agency Services Market Size Growth Rate by Country (US$ Million): 2020 VS 2024 VS 2031
Table 59. Middle East & Africa Rebranding Agency Services Market Size by Country (2020-2025) & (US$ Million)
Table 60. Middle East & Africa Rebranding Agency Services Market Size by Country (2026-2031) & (US$ Million)
Table 61. Wolff Olins Company Details
Table 62. Wolff Olins Business Overview
Table 63. Wolff Olins Rebranding Agency Services Product
Table 64. Wolff Olins Revenue in Rebranding Agency Services Business (2020-2025) & (US$ Million)
Table 65. Wolff Olins Recent Development
Table 66. Catchword Company Details
Table 67. Catchword Business Overview
Table 68. Catchword Rebranding Agency Services Product
Table 69. Catchword Revenue in Rebranding Agency Services Business (2020-2025) & (US$ Million)
Table 70. Catchword Recent Development
Table 71. Winkreative Company Details
Table 72. Winkreative Business Overview
Table 73. Winkreative Rebranding Agency Services Product
Table 74. Winkreative Revenue in Rebranding Agency Services Business (2020-2025) & (US$ Million)
Table 75. Winkreative Recent Development
Table 76. Tangible Brand Consultants Company Details
Table 77. Tangible Brand Consultants Business Overview
Table 78. Tangible Brand Consultants Rebranding Agency Services Product
Table 79. Tangible Brand Consultants Revenue in Rebranding Agency Services Business (2020-2025) & (US$ Million)
Table 80. Tangible Brand Consultants Recent Development
Table 81. Green Group Studio Company Details
Table 82. Green Group Studio Business Overview
Table 83. Green Group Studio Rebranding Agency Services Product
Table 84. Green Group Studio Revenue in Rebranding Agency Services Business (2020-2025) & (US$ Million)
Table 85. Green Group Studio Recent Development
Table 86. MarketingModo Company Details
Table 87. MarketingModo Business Overview
Table 88. MarketingModo Rebranding Agency Services Product
Table 89. MarketingModo Revenue in Rebranding Agency Services Business (2020-2025) & (US$ Million)
Table 90. MarketingModo Recent Development
Table 91. Interbrand Company Details
Table 92. Interbrand Business Overview
Table 93. Interbrand Rebranding Agency Services Product
Table 94. Interbrand Revenue in Rebranding Agency Services Business (2020-2025) & (US$ Million)
Table 95. Interbrand Recent Development
Table 96. Duck.Design Company Details
Table 97. Duck.Design Business Overview
Table 98. Duck.Design Rebranding Agency Services Product
Table 99. Duck.Design Revenue in Rebranding Agency Services Business (2020-2025) & (US$ Million)
Table 100. Duck.Design Recent Development
Table 101. Halo Lab Company Details
Table 102. Halo Lab Business Overview
Table 103. Halo Lab Rebranding Agency Services Product
Table 104. Halo Lab Revenue in Rebranding Agency Services Business (2020-2025) & (US$ Million)
Table 105. Halo Lab Recent Development
Table 106. Brand Purist Company Details
Table 107. Brand Purist Business Overview
Table 108. Brand Purist Rebranding Agency Services Product
Table 109. Brand Purist Revenue in Rebranding Agency Services Business (2020-2025) & (US$ Million)
Table 110. Brand Purist Recent Development
Table 111. Ramotion Company Details
Table 112. Ramotion Business Overview
Table 113. Ramotion Rebranding Agency Services Product
Table 114. Ramotion Revenue in Rebranding Agency Services Business (2020-2025) & (US$ Million)
Table 115. Ramotion Recent Development
Table 116. Studio 8 Design Company Details
Table 117. Studio 8 Design Business Overview
Table 118. Studio 8 Design Rebranding Agency Services Product
Table 119. Studio 8 Design Revenue in Rebranding Agency Services Business (2020-2025) & (US$ Million)
Table 120. Studio 8 Design Recent Development
Table 121. Jones Sign Company Details
Table 122. Jones Sign Business Overview
Table 123. Jones Sign Rebranding Agency Services Product
Table 124. Jones Sign Revenue in Rebranding Agency Services Business (2020-2025) & (US$ Million)
Table 125. Jones Sign Recent Development
Table 126. Toptal Company Details
Table 127. Toptal Business Overview
Table 128. Toptal Rebranding Agency Services Product
Table 129. Toptal Revenue in Rebranding Agency Services Business (2020-2025) & (US$ Million)
Table 130. Toptal Recent Development
Table 131. OVO Company Details
Table 132. OVO Business Overview
Table 133. OVO Rebranding Agency Services Product
Table 134. OVO Revenue in Rebranding Agency Services Business (2020-2025) & (US$ Million)
Table 135. OVO Recent Development
Table 136. Soto Group Company Details
Table 137. Soto Group Business Overview
Table 138. Soto Group Rebranding Agency Services Product
Table 139. Soto Group Revenue in Rebranding Agency Services Business (2020-2025) & (US$ Million)
Table 140. Soto Group Recent Development
Table 141. SmashBrand Company Details
Table 142. SmashBrand Business Overview
Table 143. SmashBrand Rebranding Agency Services Product
Table 144. SmashBrand Revenue in Rebranding Agency Services Business (2020-2025) & (US$ Million)
Table 145. SmashBrand Recent Development
Table 146. Clay Company Details
Table 147. Clay Business Overview
Table 148. Clay Rebranding Agency Services Product
Table 149. Clay Revenue in Rebranding Agency Services Business (2020-2025) & (US$ Million)
Table 150. Clay Recent Development
Table 151. Mission Control Company Details
Table 152. Mission Control Business Overview
Table 153. Mission Control Rebranding Agency Services Product
Table 154. Mission Control Revenue in Rebranding Agency Services Business (2020-2025) & (US$ Million)
Table 155. Mission Control Recent Development
Table 156. Pentagram Company Details
Table 157. Pentagram Business Overview
Table 158. Pentagram Rebranding Agency Services Product
Table 159. Pentagram Revenue in Rebranding Agency Services Business (2020-2025) & (US$ Million)
Table 160. Pentagram Recent Development
Table 161. DesignStudio Company Details
Table 162. DesignStudio Business Overview
Table 163. DesignStudio Rebranding Agency Services Product
Table 164. DesignStudio Revenue in Rebranding Agency Services Business (2020-2025) & (US$ Million)
Table 165. DesignStudio Recent Development
Table 166. Siegel+Gale Company Details
Table 167. Siegel+Gale Business Overview
Table 168. Siegel+Gale Rebranding Agency Services Product
Table 169. Siegel+Gale Revenue in Rebranding Agency Services Business (2020-2025) & (US$ Million)
Table 170. Siegel+Gale Recent Development
Table 171. Lippincott Company Details
Table 172. Lippincott Business Overview
Table 173. Lippincott Rebranding Agency Services Product
Table 174. Lippincott Revenue in Rebranding Agency Services Business (2020-2025) & (US$ Million)
Table 175. Lippincott Recent Development
Table 176. Saffron Company Details
Table 177. Saffron Business Overview
Table 178. Saffron Rebranding Agency Services Product
Table 179. Saffron Revenue in Rebranding Agency Services Business (2020-2025) & (US$ Million)
Table 180. Saffron Recent Development
Table 181. Labbrand Company Details
Table 182. Labbrand Business Overview
Table 183. Labbrand Rebranding Agency Services Product
Table 184. Labbrand Revenue in Rebranding Agency Services Business (2020-2025) & (US$ Million)
Table 185. Labbrand Recent Development
Table 186. Anomaly Company Details
Table 187. Anomaly Business Overview
Table 188. Anomaly Rebranding Agency Services Product
Table 189. Anomaly Revenue in Rebranding Agency Services Business (2020-2025) & (US$ Million)
Table 190. Anomaly Recent Development
Table 191. Dentsu Company Details
Table 192. Dentsu Business Overview
Table 193. Dentsu Rebranding Agency Services Product
Table 194. Dentsu Revenue in Rebranding Agency Services Business (2020-2025) & (US$ Million)
Table 195. Dentsu Recent Development
Table 196. FutureBrand Australia Company Details
Table 197. FutureBrand Australia Business Overview
Table 198. FutureBrand Australia Rebranding Agency Services Product
Table 199. FutureBrand Australia Revenue in Rebranding Agency Services Business (2020-2025) & (US$ Million)
Table 200. FutureBrand Australia Recent Development
Table 201. ipulse Company Details
Table 202. ipulse Business Overview
Table 203. ipulse Rebranding Agency Services Product
Table 204. ipulse Revenue in Rebranding Agency Services Business (2020-2025) & (US$ Million)
Table 205. ipulse Recent Development
Table 206. Brandwell Company Details
Table 207. Brandwell Business Overview
Table 208. Brandwell Rebranding Agency Services Product
Table 209. Brandwell Revenue in Rebranding Agency Services Business (2020-2025) & (US$ Million)
Table 210. Brandwell Recent Development
Table 211. Research Programs/Design for This Report
Table 212. Key Data Information from Secondary Sources
Table 213. Key Data Information from Primary Sources
Table 214. Authors List of This Report
List of Figures
Figure 1. Rebranding Agency Services Picture
Figure 2. Global Rebranding Agency Services Market Size Comparison by Service Type (2020-2031) & (US$ Million)
Figure 3. Global Rebranding Agency Services Market Share by Service Type: 2024 VS 2031
Figure 4. Brand Strategy Consulting Features
Figure 5. Visual Identity Design Features
Figure 6. Brand Messaging Development Features
Figure 7. Digital Branding Features
Figure 8. Corporate Communication Services Features
Figure 9. Global Rebranding Agency Services Market Size Comparison by Rebranding Scope (2020-2031) & (US$ Million)
Figure 10. Partial Rebranding Features
Figure 11. Complete Rebranding Features
Figure 12. Merger or Acquisition Rebranding Features
Figure 13. Market Repositioning Rebranding Features
Figure 14. Global Rebranding Agency Services Market Size Comparison by Industry Sector (2020-2031) & (US$ Million)
Figure 15. Consumer Goods Features
Figure 16. Technology Features
Figure 17. Healthcare Features
Figure 18. Finance Features
Figure 19. Education Features
Figure 20. Hospitality Features
Figure 21. Global Rebranding Agency Services Market Size by Application (2020-2031) & (US$ Million)
Figure 22. Global Rebranding Agency Services Market Share by Application: 2024 VS 2031
Figure 23. Large Enterprises Case Studies
Figure 24. SMEs Case Studies
Figure 25. Non-Profit Organizations Case Studies
Figure 26. Rebranding Agency Services Report Years Considered
Figure 27. Global Rebranding Agency Services Market Size (US$ Million), Year-over-Year: 2020-2031
Figure 28. Global Rebranding Agency Services Market Size, (US$ Million), 2020 VS 2024 VS 2031
Figure 29. Global Rebranding Agency Services Market Share by Region: 2024 VS 2031
Figure 30. Global Rebranding Agency Services Market Share by Players in 2024
Figure 31. Global Rebranding Agency Services Market Share by Company Type (Tier 1, Tier 2, and Tier 3)
Figure 32. The Top 10 and 5 Players Market Share by Rebranding Agency Services Revenue in 2024
Figure 33. North America Rebranding Agency Services Market Size YoY Growth (2020-2031) & (US$ Million)
Figure 34. North America Rebranding Agency Services Market Share by Country (2020-2031)
Figure 35. United States Rebranding Agency Services Market Size YoY Growth (2020-2031) & (US$ Million)
Figure 36. Canada Rebranding Agency Services Market Size YoY Growth (2020-2031) & (US$ Million)
Figure 37. Europe Rebranding Agency Services Market Size YoY Growth (2020-2031) & (US$ Million)
Figure 38. Europe Rebranding Agency Services Market Share by Country (2020-2031)
Figure 39. Germany Rebranding Agency Services Market Size YoY Growth (2020-2031) & (US$ Million)
Figure 40. France Rebranding Agency Services Market Size YoY Growth (2020-2031) & (US$ Million)
Figure 41. U.K. Rebranding Agency Services Market Size YoY Growth (2020-2031) & (US$ Million)
Figure 42. Italy Rebranding Agency Services Market Size YoY Growth (2020-2031) & (US$ Million)
Figure 43. Russia Rebranding Agency Services Market Size YoY Growth (2020-2031) & (US$ Million)
Figure 44. Ireland Rebranding Agency Services Market Size YoY Growth (2020-2031) & (US$ Million)
Figure 45. Asia-Pacific Rebranding Agency Services Market Size YoY Growth (2020-2031) & (US$ Million)
Figure 46. Asia-Pacific Rebranding Agency Services Market Share by Region (2020-2031)
Figure 47. China Rebranding Agency Services Market Size YoY Growth (2020-2031) & (US$ Million)
Figure 48. Japan Rebranding Agency Services Market Size YoY Growth (2020-2031) & (US$ Million)
Figure 49. South Korea Rebranding Agency Services Market Size YoY Growth (2020-2031) & (US$ Million)
Figure 50. Southeast Asia Rebranding Agency Services Market Size YoY Growth (2020-2031) & (US$ Million)
Figure 51. India Rebranding Agency Services Market Size YoY Growth (2020-2031) & (US$ Million)
Figure 52. Australia & New Zealand Rebranding Agency Services Market Size YoY Growth (2020-2031) & (US$ Million)
Figure 53. Latin America Rebranding Agency Services Market Size YoY Growth (2020-2031) & (US$ Million)
Figure 54. Latin America Rebranding Agency Services Market Share by Country (2020-2031)
Figure 55. Mexico Rebranding Agency Services Market Size YoY Growth (2020-2031) & (US$ Million)
Figure 56. Brazil Rebranding Agency Services Market Size YoY Growth (2020-2031) & (US$ Million)
Figure 57. Middle East & Africa Rebranding Agency Services Market Size YoY Growth (2020-2031) & (US$ Million)
Figure 58. Middle East & Africa Rebranding Agency Services Market Share by Country (2020-2031)
Figure 59. Israel Rebranding Agency Services Market Size YoY Growth (2020-2031) & (US$ Million)
Figure 60. Saudi Arabia Rebranding Agency Services Market Size YoY Growth (2020-2031) & (US$ Million)
Figure 61. UAE Rebranding Agency Services Market Size YoY Growth (2020-2031) & (US$ Million)
Figure 62. Wolff Olins Revenue Growth Rate in Rebranding Agency Services Business (2020-2025)
Figure 63. Catchword Revenue Growth Rate in Rebranding Agency Services Business (2020-2025)
Figure 64. Winkreative Revenue Growth Rate in Rebranding Agency Services Business (2020-2025)
Figure 65. Tangible Brand Consultants Revenue Growth Rate in Rebranding Agency Services Business (2020-2025)
Figure 66. Green Group Studio Revenue Growth Rate in Rebranding Agency Services Business (2020-2025)
Figure 67. MarketingModo Revenue Growth Rate in Rebranding Agency Services Business (2020-2025)
Figure 68. Interbrand Revenue Growth Rate in Rebranding Agency Services Business (2020-2025)
Figure 69. Duck.Design Revenue Growth Rate in Rebranding Agency Services Business (2020-2025)
Figure 70. Halo Lab Revenue Growth Rate in Rebranding Agency Services Business (2020-2025)
Figure 71. Brand Purist Revenue Growth Rate in Rebranding Agency Services Business (2020-2025)
Figure 72. Ramotion Revenue Growth Rate in Rebranding Agency Services Business (2020-2025)
Figure 73. Studio 8 Design Revenue Growth Rate in Rebranding Agency Services Business (2020-2025)
Figure 74. Jones Sign Revenue Growth Rate in Rebranding Agency Services Business (2020-2025)
Figure 75. Toptal Revenue Growth Rate in Rebranding Agency Services Business (2020-2025)
Figure 76. OVO Revenue Growth Rate in Rebranding Agency Services Business (2020-2025)
Figure 77. Soto Group Revenue Growth Rate in Rebranding Agency Services Business (2020-2025)
Figure 78. SmashBrand Revenue Growth Rate in Rebranding Agency Services Business (2020-2025)
Figure 79. Clay Revenue Growth Rate in Rebranding Agency Services Business (2020-2025)
Figure 80. Mission Control Revenue Growth Rate in Rebranding Agency Services Business (2020-2025)
Figure 81. Pentagram Revenue Growth Rate in Rebranding Agency Services Business (2020-2025)
Figure 82. DesignStudio Revenue Growth Rate in Rebranding Agency Services Business (2020-2025)
Figure 83. Siegel+Gale Revenue Growth Rate in Rebranding Agency Services Business (2020-2025)
Figure 84. Lippincott Revenue Growth Rate in Rebranding Agency Services Business (2020-2025)
Figure 85. Saffron Revenue Growth Rate in Rebranding Agency Services Business (2020-2025)
Figure 86. Labbrand Revenue Growth Rate in Rebranding Agency Services Business (2020-2025)
Figure 87. Anomaly Revenue Growth Rate in Rebranding Agency Services Business (2020-2025)
Figure 88. Dentsu Revenue Growth Rate in Rebranding Agency Services Business (2020-2025)
Figure 89. FutureBrand Australia Revenue Growth Rate in Rebranding Agency Services Business (2020-2025)
Figure 90. ipulse Revenue Growth Rate in Rebranding Agency Services Business (2020-2025)
Figure 91. Brandwell Revenue Growth Rate in Rebranding Agency Services Business (2020-2025)
Figure 92. Bottom-up and Top-down Approaches for This Report
Figure 93. Data Triangulation
Figure 94. Key Executives Interviewed