FEATURED COMPANIES
Kemira Oyj
TAKI CHEMICAL
Polyaluminium Chloride (PAC) Solution Market Size
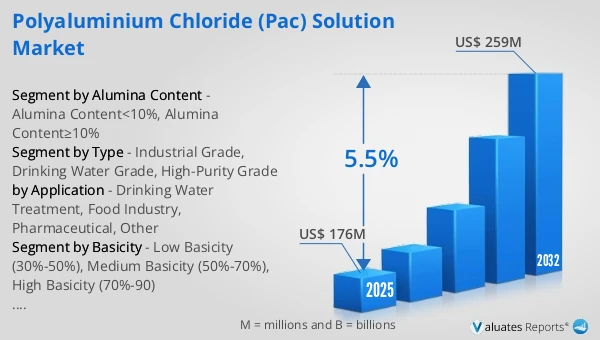
The global Polyaluminium Chloride (PAC) Solution market was valued at US$ 176 million in 2025 and is anticipated to reach US$ 259 million by 2032, at a CAGR of 5.5% from 2026 to 2032.
Polyaluminium Chloride (PAC) Solution Market
The 2025 U.S. tariff policies introduce profound uncertainty into the global economic landscape. This report critically examines the implications of recent tariff adjustments and international strategic countermeasures on Polyaluminium Chloride (PAC) Solution competitive dynamics, regional economic interdependencies, and supply chain reconfigurations.
Polyaluminum chloride solution is a liquid inorganic polymer coagulant with polyaluminum chloride as the active ingredient. It is usually in the form of an aqueous solution with a certain effective alumina content and alkalinity. The solution is mainly composed of multi-core hydroxy aluminum complexes. After addition, it promotes rapid coagulation and sedimentation of colloids and suspended solids through mechanisms such as electric neutralization, adsorption bridging, and net capture and sweeping. It is commonly used in water treatment plants, municipal sewage upgrading, industrial wastewater pretreatment, and deep turbidity and decolorization. In 2025, global Polyaluminium Chloride (PAC) Solution production reached approximately 3,147 K MT, with an average global market price of around US$ 56 per MT.
The core advantages of liquid products lie in their immediate use, strong adaptability to automated metering and dosing, labor-saving dissolution and preparation processes, and lower dust risks. Therefore, their penetration rate in large-scale water operations and continuous industrial water treatment has steadily increased. However, their competitive focus will shift from single purity and low price to effective alumina content and alkalinity stability, low insoluble matter and low impurity control, flocculation efficiency under low temperature and low turbidity conditions, storage and transportation stability and anti-corrosion packaging solutions, as well as the ability to achieve drug consumption optimization and sludge reduction through online monitoring linkage. Suppliers with process service capabilities and quality consistency are more likely to gain market share in centralized procurement and long-term framework agreements.
This report delivers a comprehensive overview of the global Polyaluminium Chloride (PAC) Solution market, with both quantitative and qualitative analyses, to help readers develop growth strategies, assess the competitive landscape, evaluate their position in the current market, and make informed business decisions regarding Polyaluminium Chloride (PAC) Solution. The Polyaluminium Chloride (PAC) Solution market size, estimates, and forecasts are provided in terms of output/shipments (Kilotons) and revenue (US$ millions), with 2025 as the base year and historical and forecast data for 2021–2032.
The report segments the global Polyaluminium Chloride (PAC) Solution market comprehensively. Regional market sizes by Type, by Application, by Alumina Content, and by company are also provided. For deeper insight, the report profiles the competitive landscape, key competitors, and their respective market rankings, and discusses technological trends and new product developments.
This report will assist Polyaluminium Chloride (PAC) Solution manufacturers, new entrants, and companies across the industry value chain with information on revenues, production, and average prices for the overall market and its sub-segments, by company, by Type, by Application, and by region.
Market Segmentation
Scope of Polyaluminium Chloride (PAC) Solution Market Report
| Report Metric |
Details |
| Report Name |
Polyaluminium Chloride (PAC) Solution Market |
| Accounted market size in 2025 |
US$ 176 million |
| Forecasted market size in 2032 |
US$ 259 million |
| CAGR |
5.5% |
| Base Year |
2025 |
| Forecasted years |
2026 - 2032 |
| Segment by Type |
- Industrial Grade
- Drinking Water Grade
- High-Purity Grade
|
| Segment by Alumina Content |
- Alumina Content<10%
- Alumina Content≥10%
|
| Segment by Basicity |
- Low Basicity (30%-50%)
- Medium Basicity (50%-70%)
- High Basicity (70%-90)
|
| by Application |
- Drinking Water Treatment
- Food Industry
- Pharmaceutical
- Other
|
| Production by Region |
- North America
- Europe
- China
- Japan
|
| Consumption by Region |
- North America (United States, Canada)
- Europe (Germany, France, UK, Italy, Russia)
- Asia-Pacific (China, Japan, South Korea, Taiwan)
- Southeast Asia (India)
- Latin America (Mexico, Brazil)
|
| By Company |
Kemira, Taki Chemical, Feralco Group, Venator, Aditya Birla, Neel Chem, USALCO, GK Finechem, Guangdong HEC Technology Holding, Shandong Zhongke Tianze Clean Water Materials, Fengbai Plastic Chemicals, Henan Aierfuke Chemicals Group, Henan Tairan Water Purificantion Material, Hengyang Jianheng Industry Development, Shandong Jiahua Water Treatment Technology, Lanyao Water Treatment Agent |
| Forecast units |
USD million in value |
| Report coverage |
Revenue and volume forecast, company share, competitive landscape, growth factors and trends |
Chapter Outline
- Chapter 1: Defines the scope of the report and presents an executive summary of market segments (by Type, by Application, by Alumina Content, etc.), including the size of each segment and its future growth potential. It offers a high-level view of the current market and its likely evolution in the short, medium, and long term.
- Chapter 2: Provides a detailed analysis of the competitive landscape for Polyaluminium Chloride (PAC) Solution manufacturers, including prices, production, value-based market shares, latest development plans, and information on mergers and acquisitions.
- Chapter 3: Examines Polyaluminium Chloride (PAC) Solution production/output and value by region and country, providing a quantitative assessment of market size and growth potential for each region over the next six years.
- Chapter 4: Analyzes Polyaluminium Chloride (PAC) Solution consumption at the regional and country levels. It quantifies market size and growth potential for each region and its key countries, and outlines market development, outlook, addressable space, and national production.
- Chapter 5: Analyzes market segments by Type, covering the size and growth potential of each segment to help readers identify “blue ocean” opportunities.
- Chapter 6: Analyzes market segments by Application, covering the size and growth potential of each segment to help readers identify “blue ocean” opportunities in downstream markets.
- Chapter 7: Profiles key players, detailing the fundamentals of major companies, including product production/output, value, price, gross margin, product portfolio/introductions, and recent developments.
- Chapter 8: Reviews the industry value chain, including upstream and downstream segments.
- Chapter 9: Discusses market dynamics and recent developments, including drivers, restraints, challenges and risks for manufacturers, U.S. Tariffs and relevant policy analysis.
- Chapter 10: Summarizes the key findings and conclusions of the report.
FAQ for this report
How fast is Polyaluminium Chloride (PAC) Solution Market growing?
Ans: The Polyaluminium Chloride (PAC) Solution Market witnessing a CAGR of 5.5% during the forecast period 2026-2032.
What is the Polyaluminium Chloride (PAC) Solution Market size in 2032?
Ans: The Polyaluminium Chloride (PAC) Solution Market size in 2032 will be US$ 259 million.
Who are the main players in the Polyaluminium Chloride (PAC) Solution Market report?
Ans: The main players in the Polyaluminium Chloride (PAC) Solution Market are Kemira, Taki Chemical, Feralco Group, Venator, Aditya Birla, Neel Chem, USALCO, GK Finechem, Guangdong HEC Technology Holding, Shandong Zhongke Tianze Clean Water Materials, Fengbai Plastic Chemicals, Henan Aierfuke Chemicals Group, Henan Tairan Water Purificantion Material, Hengyang Jianheng Industry Development, Shandong Jiahua Water Treatment Technology, Lanyao Water Treatment Agent
What are the Application segmentation covered in the Polyaluminium Chloride (PAC) Solution Market report?
Ans: The Applications covered in the Polyaluminium Chloride (PAC) Solution Market report are Drinking Water Treatment, Food Industry, Pharmaceutical, Other
What are the Type segmentation covered in the Polyaluminium Chloride (PAC) Solution Market report?
Ans: The Types covered in the Polyaluminium Chloride (PAC) Solution Market report are Industrial Grade, Drinking Water Grade, High-Purity Grade

