List of Tables
Table 1. Global Market LBS Market Size (US$ Million) Comparison by Region 2018 VS 2022 VS 2029
Table 2. Global LBS Market Size by Region (2018-2023) & (US$ Million)
Table 3. Global LBS Market Size Share by Region (2018-2023)
Table 4. Global LBS Forecasted Market Size by Region (2024-2029) & (US$ Million)
Table 5. Global LBS Forecasted Market Size Share by Region (2024-2029)
Table 6. Global LBS Market Size (US$ Million) by Technology: 2018 VS 2022 VS 2029
Table 7. Global LBS Market Size by Technology (2018-2023) & (US$ Million)
Table 8. Global LBS Revenue Market Share by Technology (2018-2023)
Table 9. Global LBS Forecasted Market Size by Technology (2024-2029) & (US$ Million)
Table 10. Global LBS Revenue Market Share by Technology (2024-2029)
Table 11. North America LBS Revenue by Technology (2018-2023) & (US$ Million)
Table 12. North America LBS Revenue by Technology (2024-2029) & (US$ Million)
Table 13. Europe LBS Revenue by Technology (2018-2023) & (US$ Million)
Table 14. Europe LBS Revenue by Technology (2024-2029) & (US$ Million)
Table 15. Asia-Pacific LBS Revenue by Technology (2018-2023) & (US$ Million)
Table 16. Asia-Pacific LBS Revenue by Technology (2024-2029) & (US$ Million)
Table 17. Latin America LBS Revenue by Technology (2018-2023) & (US$ Million)
Table 18. Latin America LBS Revenue by Technology (2024-2029) & (US$ Million)
Table 19. Middle East and Africa LBS Revenue by Technology (2018-2023) & (US$ Million)
Table 20. Middle East and Africa LBS Revenue by Technology (2024-2029) & (US$ Million)
Table 21. Global LBS Market Size (US$ Million) by Application: 2018 VS 2022 VS 2029
Table 22. Global LBS Market Size by Application (2018-2023) & (US$ Million)
Table 23. Global LBS Revenue Market Share by Application (2018-2023)
Table 24. Global LBS Forecasted Market Size by Application (2024-2029) & (US$ Million)
Table 25. Global LBS Revenue Market Share by Application (2024-2029)
Table 26. North America LBS Revenue by Application (2018-2023) & (US$ Million)
Table 27. North America LBS Revenue by Application (2024-2029) & (US$ Million)
Table 28. Europe LBS Revenue by Application (2018-2023) & (US$ Million)
Table 29. Europe LBS Revenue by Application (2024-2029) & (US$ Million)
Table 30. Asia-Pacific LBS Revenue by Application (2018-2023) & (US$ Million)
Table 31. Asia-Pacific LBS Revenue by Application (2024-2029) & (US$ Million)
Table 32. Latin America LBS Revenue by Application (2018-2023) & (US$ Million)
Table 33. Latin America LBS Revenue by Application (2024-2029) & (US$ Million)
Table 34. Middle East and Africa LBS Revenue by Application (2018-2023) & (US$ Million)
Table 35. Middle East and Africa LBS Revenue by Application (2024-2029) & (US$ Million)
Table 36. Global LBS Revenue (US$ Million) by Players (2018-2023)
Table 37. Global LBS Revenue Market Share by Players (2018-2023)
Table 38. Global Top Players Market Share by Company Type (Tier 1, Tier 2 and Tier 3) & (based on the Revenue in LBS as of 2022)
Table 39. Date of Key Players Enter into LBS Market
Table 40. Global LBS Key Players Headquarters and Area Served
Table 41. LBS Product Solution and Service
Table 42. Global LBS Players Market Concentration Ratio (CR5 and HHI)
Table 43. Mergers & Acquisitions, Expansion Plans
Table 44. Alibaba Group Basic Information List
Table 45. Alibaba Group Description and Business Overview
Table 46. Alibaba Group LBS Products, Services and Solutions
Table 47. Revenue (US$ Million) in LBS Business of Alibaba Group (2018-2023)
Table 48. Alibaba Group Recent Developments
Table 49. Apple Basic Information List
Table 50. Apple Description and Business Overview
Table 51. Apple LBS Products, Services and Solutions
Table 52. Revenue (US$ Million) in LBS Business of Apple (2018-2023)
Table 53. Apple Recent Developments
Table 54. Foursquare Basic Information List
Table 55. Foursquare Description and Business Overview
Table 56. Foursquare LBS Products, Services and Solutions
Table 57. Revenue (US$ Million) in LBS Business of Foursquare (2018-2023)
Table 58. Foursquare Recent Developments
Table 59. Google Basic Information List
Table 60. Google Description and Business Overview
Table 61. Google LBS Products, Services and Solutions
Table 62. Revenue (US$ Million) in LBS Business of Google (2018-2023)
Table 63. Google Recent Developments
Table 64. HERE Basic Information List
Table 65. HERE Description and Business Overview
Table 66. HERE LBS Products, Services and Solutions
Table 67. Revenue (US$ Million) in LBS Business of HERE (2018-2023)
Table 68. HERE Recent Developments
Table 69. Aisle411 Basic Information List
Table 70. Aisle411 Description and Business Overview
Table 71. Aisle411 LBS Products, Services and Solutions
Table 72. Revenue (US$ Million) in LBS Business of Aisle411 (2018-2023)
Table 73. Aisle411 Recent Developments
Table 74. Baidu Basic Information List
Table 75. Baidu Description and Business Overview
Table 76. Baidu LBS Products, Services and Solutions
Table 77. Revenue (US$ Million) in LBS Business of Baidu (2018-2023)
Table 78. Baidu Recent Developments
Table 79. Dianping Basic Information List
Table 80. Dianping Description and Business Overview
Table 81. Dianping LBS Products, Services and Solutions
Table 82. Revenue (US$ Million) in LBS Business of Dianping (2018-2023)
Table 83. Dianping Recent Developments
Table 84. Etisalat Basic Information List
Table 85. Etisalat Description and Business Overview
Table 86. Etisalat LBS Products, Services and Solutions
Table 87. Revenue (US$ Million) in LBS Business of Etisalat (2018-2023)
Table 88. Etisalat Recent Developments
Table 89. Facebook Basic Information List
Table 90. Facebook Description and Business Overview
Table 91. Facebook LBS Products, Services and Solutions
Table 92. Revenue (US$ Million) in LBS Business of Facebook (2018-2023)
Table 93. Facebook Recent Developments
Table 94. Intel Basic Information List
Table 95. Intel Description and Business Overview
Table 96. Intel LBS Products, Services and Solutions
Table 97. Revenue (US$ Million) in LBS Business of Intel (2018-2023)
Table 98. Intel Recent Developments
Table 99. MazeMap Basic Information List
Table 100. MazeMap Description and Business Overview
Table 101. MazeMap LBS Products, Services and Solutions
Table 102. Revenue (US$ Million) in LBS Business of MazeMap (2018-2023)
Table 103. MazeMap Recent Developments
Table 104. Micello Basic Information List
Table 105. Micello Description and Business Overview
Table 106. Micello LBS Products, Services and Solutions
Table 107. Revenue (US$ Million) in LBS Business of Micello (2018-2023)
Table 108. Micello Recent Developments
Table 109. MTN Group Basic Information List
Table 110. MTN Group Description and Business Overview
Table 111. MTN Group LBS Products, Services and Solutions
Table 112. Revenue (US$ Million) in LBS Business of MTN Group (2018-2023)
Table 113. MTN Group Recent Developments
Table 114. North America LBS Market Size by Country (2018-2023) & (US$ Million)
Table 115. North America LBS Market Size by Country (2024-2029) & (US$ Million)
Table 116. Europe LBS Market Size by Country (2018-2023) & (US$ Million)
Table 117. Europe LBS Market Size by Country (2024-2029) & (US$ Million)
Table 118. Asia-Pacific LBS Market Size Growth Rate (CAGR) by Region (US$ Million): 2018 VS 2022 VS 2029
Table 119. Asia-Pacific LBS Market Size by Region (2018-2023) & (US$ Million)
Table 120. Asia-Pacific LBS Market Size by Region (2024-2029) & (US$ Million)
Table 121. Asia-Pacific LBS Market Share by Region (2018-2023)
Table 122. Asia-Pacific LBS Market Share by Region (2024-2029)
Table 123. Latin America LBS Market Size Growth Rate (CAGR) by Region (US$ Million): 2018 VS 2022 VS 2029
Table 124. Latin America LBS Market Size by Country (2018-2023) & (US$ Million)
Table 125. Latin America LBS Market Size by Country (2024-2029) & (US$ Million)
Table 126. Middle East & Africa LBS Market Size Growth Rate (CAGR) by Region (US$ Million): 2018 VS 2022 VS 2029
Table 127. Middle East & Africa LBS Market Size by Country (2018-2023) & (US$ Million)
Table 128. Middle East & Africa LBS Market Size by Country (2024-2029) & (US$ Million)
Table 129. LBS Market Trends
Table 130. LBS Market Drivers
Table 131. LBS Market Challenges
Table 132. LBS Market Restraints
Table 133. Research Programs/Design for This Report
Table 134. Key Data Information from Secondary Sources
Table 135. Key Data Information from Primary Sources
List of Figures
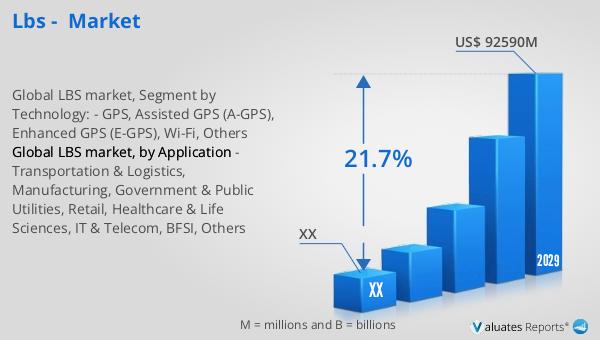
Figure 1. Global LBS Market Size Year-over-Year 2018-2029 & (US$ Million)
Figure 2. Global LBS Market Size (US$ Million), 2018 VS 2022 VS 2029
Figure 3. Global LBS Market Share by Regions: 2022 VS 2029
Figure 4. Global LBS Forecasted Market Size Share by Region (2024-2029)
Figure 5. North America LBS Market Size Growth Rate (2018-2029) & (US$ Million)
Figure 6. Europe LBS Market Size Growth Rate (2018-2029) & (US$ Million)
Figure 7. Asia-Pacific LBS Market Size Growth Rate (2018-2029) & (US$ Million)
Figure 8. Latin America LBS Market Size Growth Rate (2018-2029) & (US$ Million)
Figure 9. Middle East & Africa LBS Market Size Growth Rate (2018-2029) & (US$ Million)
Figure 10. Product Picture of GPS
Figure 11. Global GPS Market Size (US$ Million) & YoY Growth (2018-2029)
Figure 12. Product Picture of Assisted GPS (A-GPS)
Figure 13. Global Assisted GPS (A-GPS) Market Size (US$ Million) & YoY Growth (2018-2029)
Figure 14. Product Picture of Enhanced GPS (E-GPS)
Figure 15. Global Enhanced GPS (E-GPS) Market Size (US$ Million) & YoY Growth (2018-2029)
Figure 16. Product Picture of Wi-Fi
Figure 17. Global Wi-Fi Market Size (US$ Million) & YoY Growth (2018-2029)
Figure 18. Product Picture of Others
Figure 19. Global Others Market Size (US$ Million) & YoY Growth (2018-2029)
Figure 20. Global LBS Market Size Share by Technology: 2022 & 2029
Figure 21. North America LBS Revenue Market Share by Technology (2018-2029)
Figure 22. Europe LBS Revenue Market Share by Technology (2018-2029)
Figure 23. Asia-Pacific LBS Revenue Market Share by Technology (2018-2029)
Figure 24. Latin America LBS Revenue Market Share by Technology (2018-2029)
Figure 25. Middle East and Africa LBS Revenue Market Share by Technology (2018-2029)
Figure 26. Transportation & Logistics Market Size (US$ Million) & YoY Growth (2018-2029)
Figure 27. Manufacturing Market Size (US$ Million) & YoY Growth (2018-2029)
Figure 28. Government & Public Utilities Market Size (US$ Million) & YoY Growth (2018-2029)
Figure 29. Retail Market Size (US$ Million) & YoY Growth (2018-2029)
Figure 30. Healthcare & Life Sciences Market Size (US$ Million) & YoY Growth (2018-2029)
Figure 31. IT & Telecom Market Size (US$ Million) & YoY Growth (2018-2029)
Figure 32. BFSI Market Size (US$ Million) & YoY Growth (2018-2029)
Figure 33. Others Market Size (US$ Million) & YoY Growth (2018-2029)
Figure 34. Global LBS Market Size Share by Application: 2022 & 2029
Figure 35. North America LBS Revenue Market Share by Application (2018-2029)
Figure 36. Europe LBS Revenue Market Share by Application (2018-2029)
Figure 37. Asia-Pacific LBS Revenue Market Share by Application (2018-2029)
Figure 38. Latin America LBS Revenue Market Share by Application (2018-2029)
Figure 39. Middle East and Africa LBS Revenue Market Share by Application (2018-2029)
Figure 40. LBS Market Share by Company Type (Tier 1, Tier 2 and Tier 3): 2018 VS 2022
Figure 41. Global Top 5 and Top 10 Players LBS Market Share in 2022
Figure 42. North America LBS Market Share by Country (2018-2029)
Figure 43. U.S. LBS Market Size (2018-2029) & (US$ Million)
Figure 44. Canada LBS Market Size (2018-2029) & (US$ Million)
Figure 45. Germany LBS Market Size (2018-2029) & (US$ Million)
Figure 46. France LBS Market Size (2018-2029) & (US$ Million)
Figure 47. U.K. LBS Market Size (2018-2029) & (US$ Million)
Figure 48. Italy LBS Market Size (2018-2029) & (US$ Million)
Figure 49. Russia LBS Market Size (2018-2029) & (US$ Million)
Figure 50. Nordic Countries LBS Market Size (2018-2029) & (US$ Million)
Figure 51. Asia-Pacific LBS Market Share by Region (2018-2029)
Figure 52. China LBS Market Size (2018-2029) & (US$ Million)
Figure 53. Japan LBS Market Size (2018-2029) & (US$ Million)
Figure 54. South Korea LBS Market Size (2018-2029) & (US$ Million)
Figure 55. Southeast Asia LBS Market Size (2018-2029) & (US$ Million)
Figure 56. India LBS Market Size (2018-2029) & (US$ Million)
Figure 57. Australia LBS Market Size (2018-2029) & (US$ Million)
Figure 58. Latin America LBS Market Share by Country (2018-2029)
Figure 59. Mexico LBS Market Size (2018-2029) & (US$ Million)
Figure 60. Brazil LBS Market Size (2018-2029) & (US$ Million)
Figure 61. Middle East & Africa LBS Market Share by Country (2018-2029)
Figure 62. Turkey LBS Market Size (2018-2029) & (US$ Million)
Figure 63. Saudi Arabia LBS Market Size (2018-2029) & (US$ Million)
Figure 64. UAE LBS Market Size (2018-2029) & (US$ Million)
Figure 65. Bottom-up and Top-down Approaches for This Report