List of Tables
Table 1. Global Chemical Supply Chain Services Market Size Growth Rate by Type (US$ Million): 2021 vs 2025 vs 2032
Table 2. Key Players of Logistics Services
Table 3. Key Players of Warehousing Services
Table 4. Global Chemical Supply Chain Services Market Size Growth by Application (US$ Million): 2021 vs 2025 vs 2032
Table 5. Global Chemical Supply Chain Services Market Size by Region (US$ Million): 2021 vs 2025 vs 2032
Table 6. Global Chemical Supply Chain Services Market Size by Region (US$ Million), 2021–2026
Table 7. Global Chemical Supply Chain Services Market Share by Region (2021–2026)
Table 8. Global Chemical Supply Chain Services Forecasted Market Size by Region (US$ Million), 2027–2032
Table 9. Global Chemical Supply Chain Services Market Share by Region (2027–2032)
Table 10. Chemical Supply Chain Services Market Trends
Table 11. Chemical Supply Chain Services Market Drivers
Table 12. Chemical Supply Chain Services Market Challenges
Table 13. Chemical Supply Chain Services Market Restraints
Table 14. Global Chemical Supply Chain Services Revenue by Players (US$ Million), 2021–2026
Table 15. Global Chemical Supply Chain Services Market Share by Players (2021–2026)
Table 16. Global Top Chemical Supply Chain Services Players by Tier (Tier 1, Tier 2, and Tier 3), based on Chemical Supply Chain Services Revenue, 2025
Table 17. Ranking of Global Top Chemical Supply Chain Services Companies by Revenue (US$ Million) in 2025
Table 18. Global 5 Largest Players Market Share by Chemical Supply Chain Services Revenue (CR5 and HHI), 2021–2026
Table 19. Global Key Players of Chemical Supply Chain Services, Headquarters and Area Served
Table 20. Global Key Players of Chemical Supply Chain Services, Products and Applications
Table 21. Global Key Players of Chemical Supply Chain Services, Date of General Availability (GA)
Table 22. Mergers and Acquisitions, Expansion Plans
Table 23. Global Chemical Supply Chain Services Market Size by Type (US$ Million), 2021–2026
Table 24. Global Chemical Supply Chain Services Revenue Market Share by Type (2021–2026)
Table 25. Global Chemical Supply Chain Services Forecasted Market Size by Type (US$ Million), 2027–2032
Table 26. Global Chemical Supply Chain Services Revenue Market Share by Type (2027–2032)
Table 27. Global Chemical Supply Chain Services Market Size by Application (US$ Million), 2021–2026
Table 28. Global Chemical Supply Chain Services Revenue Market Share by Application (2021–2026)
Table 29. Global Chemical Supply Chain Services Forecasted Market Size by Application (US$ Million), 2027–2032
Table 30. Global Chemical Supply Chain Services Revenue Market Share by Application (2027–2032)
Table 31. North America Chemical Supply Chain Services Market Size Growth Rate by Country (US$ Million): 2021 vs 2025 vs 2032
Table 32. North America Chemical Supply Chain Services Market Size by Country (US$ Million), 2021–2026
Table 33. North America Chemical Supply Chain Services Market Size by Country (US$ Million), 2027–2032
Table 34. Europe Chemical Supply Chain Services Market Size Growth Rate by Country (US$ Million): 2021 vs 2025 vs 2032
Table 35. Europe Chemical Supply Chain Services Market Size by Country (US$ Million), 2021–2026
Table 36. Europe Chemical Supply Chain Services Market Size by Country (US$ Million), 2027–2032
Table 37. Asia-Pacific Chemical Supply Chain Services Market Size Growth Rate by Region (US$ Million): 2021 vs 2025 vs 2032
Table 38. Asia-Pacific Chemical Supply Chain Services Market Size by Region (US$ Million), 2021–2026
Table 39. Asia-Pacific Chemical Supply Chain Services Market Size by Region (US$ Million), 2027–2032
Table 40. Latin America Chemical Supply Chain Services Market Size Growth Rate by Country (US$ Million): 2021 vs 2025 vs 2032
Table 41. Latin America Chemical Supply Chain Services Market Size by Country (US$ Million), 2021–2026
Table 42. Latin America Chemical Supply Chain Services Market Size by Country (US$ Million), 2027–2032
Table 43. Middle East & Africa Chemical Supply Chain Services Market Size Growth Rate by Country (US$ Million): 2021 vs 2025 vs 2032
Table 44. Middle East & Africa Chemical Supply Chain Services Market Size by Country (US$ Million), 2021–2026
Table 45. Middle East & Africa Chemical Supply Chain Services Market Size by Country (US$ Million), 2027–2032
Table 46. C.H. Robinson Company Details
Table 47. C.H. Robinson Business Overview
Table 48. C.H. Robinson Chemical Supply Chain Services Product
Table 49. C.H. Robinson Revenue in Chemical Supply Chain Services Business (US$ Million), 2021–2026
Table 50. C.H. Robinson Recent Development
Table 51. DB Schenker Company Details
Table 52. DB Schenker Business Overview
Table 53. DB Schenker Chemical Supply Chain Services Product
Table 54. DB Schenker Revenue in Chemical Supply Chain Services Business (US$ Million), 2021–2026
Table 55. DB Schenker Recent Development
Table 56. Kinder Morgan Company Details
Table 57. Kinder Morgan Business Overview
Table 58. Kinder Morgan Chemical Supply Chain Services Product
Table 59. Kinder Morgan Revenue in Chemical Supply Chain Services Business (US$ Million), 2021–2026
Table 60. Kinder Morgan Recent Development
Table 61. Maersk Company Details
Table 62. Maersk Business Overview
Table 63. Maersk Chemical Supply Chain Services Product
Table 64. Maersk Revenue in Chemical Supply Chain Services Business (US$ Million), 2021–2026
Table 65. Maersk Recent Development
Table 66. DSV Company Details
Table 67. DSV Business Overview
Table 68. DSV Chemical Supply Chain Services Product
Table 69. DSV Revenue in Chemical Supply Chain Services Business (US$ Million), 2021–2026
Table 70. DSV Recent Development
Table 71. Xinjiang Tianshun Supply Chain Company Details
Table 72. Xinjiang Tianshun Supply Chain Business Overview
Table 73. Xinjiang Tianshun Supply Chain Chemical Supply Chain Services Product
Table 74. Xinjiang Tianshun Supply Chain Revenue in Chemical Supply Chain Services Business (US$ Million), 2021–2026
Table 75. Xinjiang Tianshun Supply Chain Recent Development
Table 76. MilkyWay Company Details
Table 77. MilkyWay Business Overview
Table 78. MilkyWay Chemical Supply Chain Services Product
Table 79. MilkyWay Revenue in Chemical Supply Chain Services Business (US$ Million), 2021–2026
Table 80. MilkyWay Recent Development
Table 81. CTS International Logistics Corporation Company Details
Table 82. CTS International Logistics Corporation Business Overview
Table 83. CTS International Logistics Corporation Chemical Supply Chain Services Product
Table 84. CTS International Logistics Corporation Revenue in Chemical Supply Chain Services Business (US$ Million), 2021–2026
Table 85. CTS International Logistics Corporation Recent Development
Table 86. Zhang Jia Gang Freetrade Science & Technology Company Details
Table 87. Zhang Jia Gang Freetrade Science & Technology Business Overview
Table 88. Zhang Jia Gang Freetrade Science & Technology Chemical Supply Chain Services Product
Table 89. Zhang Jia Gang Freetrade Science & Technology Revenue in Chemical Supply Chain Services Business (US$ Million), 2021–2026
Table 90. Zhang Jia Gang Freetrade Science & Technology Recent Development
Table 91. Zhuhai Winbase International Chemical Tank Terminal Company Details
Table 92. Zhuhai Winbase International Chemical Tank Terminal Business Overview
Table 93. Zhuhai Winbase International Chemical Tank Terminal Chemical Supply Chain Services Product
Table 94. Zhuhai Winbase International Chemical Tank Terminal Revenue in Chemical Supply Chain Services Business (US$ Million), 2021–2026
Table 95. Zhuhai Winbase International Chemical Tank Terminal Recent Development
Table 96. BDP International Company Details
Table 97. BDP International Business Overview
Table 98. BDP International Chemical Supply Chain Services Product
Table 99. BDP International Revenue in Chemical Supply Chain Services Business (US$ Million), 2021–2026
Table 100. BDP International Recent Development
Table 101. Shanghai Sinotrans Chemical International Logistics Company Details
Table 102. Shanghai Sinotrans Chemical International Logistics Business Overview
Table 103. Shanghai Sinotrans Chemical International Logistics Chemical Supply Chain Services Product
Table 104. Shanghai Sinotrans Chemical International Logistics Revenue in Chemical Supply Chain Services Business (US$ Million), 2021–2026
Table 105. Shanghai Sinotrans Chemical International Logistics Recent Development
Table 106. COSCO Shipping Logistics Company Details
Table 107. COSCO Shipping Logistics Business Overview
Table 108. COSCO Shipping Logistics Chemical Supply Chain Services Product
Table 109. COSCO Shipping Logistics Revenue in Chemical Supply Chain Services Business (US$ Million), 2021–2026
Table 110. COSCO Shipping Logistics Recent Development
Table 111. Beifang Group Company Details
Table 112. Beifang Group Business Overview
Table 113. Beifang Group Chemical Supply Chain Services Product
Table 114. Beifang Group Revenue in Chemical Supply Chain Services Business (US$ Million), 2021–2026
Table 115. Beifang Group Recent Development
Table 116. B2BE Company Details
Table 117. B2BE Business Overview
Table 118. B2BE Chemical Supply Chain Services Product
Table 119. B2BE Revenue in Chemical Supply Chain Services Business (US$ Million), 2021–2026
Table 120. B2BE Recent Development
Table 121. DHL Group Company Details
Table 122. DHL Group Business Overview
Table 123. DHL Group Chemical Supply Chain Services Product
Table 124. DHL Group Revenue in Chemical Supply Chain Services Business (US$ Million), 2021–2026
Table 125. DHL Group Recent Development
Table 126. TEU S.A Company Details
Table 127. TEU S.A Business Overview
Table 128. TEU S.A Chemical Supply Chain Services Product
Table 129. TEU S.A Revenue in Chemical Supply Chain Services Business (US$ Million), 2021–2026
Table 130. TEU S.A Recent Development
Table 131. Huafon Group Company Details
Table 132. Huafon Group Business Overview
Table 133. Huafon Group Chemical Supply Chain Services Product
Table 134. Huafon Group Revenue in Chemical Supply Chain Services Business (US$ Million), 2021–2026
Table 135. Huafon Group Recent Development
Table 136. Tegma Company Details
Table 137. Tegma Business Overview
Table 138. Tegma Chemical Supply Chain Services Product
Table 139. Tegma Revenue in Chemical Supply Chain Services Business (US$ Million), 2021–2026
Table 140. Tegma Recent Development
Table 141. GEP Company Details
Table 142. GEP Business Overview
Table 143. GEP Chemical Supply Chain Services Product
Table 144. GEP Revenue in Chemical Supply Chain Services Business (US$ Million), 2021–2026
Table 145. GEP Recent Development
Table 146. Penske Logistics Company Details
Table 147. Penske Logistics Business Overview
Table 148. Penske Logistics Chemical Supply Chain Services Product
Table 149. Penske Logistics Revenue in Chemical Supply Chain Services Business (US$ Million), 2021–2026
Table 150. Penske Logistics Recent Development
Table 151. DGL Group Company Details
Table 152. DGL Group Business Overview
Table 153. DGL Group Chemical Supply Chain Services Product
Table 154. DGL Group Revenue in Chemical Supply Chain Services Business (US$ Million), 2021–2026
Table 155. DGL Group Recent Development
Table 156. BSI America Company Details
Table 157. BSI America Business Overview
Table 158. BSI America Chemical Supply Chain Services Product
Table 159. BSI America Revenue in Chemical Supply Chain Services Business (US$ Million), 2021–2026
Table 160. BSI America Recent Development
Table 161. SINOPEC Pipeline Storage & Transportation Company Details
Table 162. SINOPEC Pipeline Storage & Transportation Business Overview
Table 163. SINOPEC Pipeline Storage & Transportation Chemical Supply Chain Services Product
Table 164. SINOPEC Pipeline Storage & Transportation Revenue in Chemical Supply Chain Services Business (US$ Million), 2021–2026
Table 165. SINOPEC Pipeline Storage & Transportation Recent Development
Table 166. Agility Company Details
Table 167. Agility Business Overview
Table 168. Agility Chemical Supply Chain Services Product
Table 169. Agility Revenue in Chemical Supply Chain Services Business (US$ Million), 2021–2026
Table 170. Agility Recent Development
Table 171. Quantix Company Details
Table 172. Quantix Business Overview
Table 173. Quantix Chemical Supply Chain Services Product
Table 174. Quantix Revenue in Chemical Supply Chain Services Business (US$ Million), 2021–2026
Table 175. Quantix Recent Development
Table 176. Research Programs/Design for This Report
Table 177. Key Data Information from Secondary Sources
Table 178. Key Data Information from Primary Sources
Table 179. Authors List of This Report
List of Figures
Figure 1. Chemical Supply Chain Services Picture
Figure 2. Global Chemical Supply Chain Services Market Size Comparison by Type (US$ Million), 2021–2032
Figure 3. Global Chemical Supply Chain Services Market Share by Type: 2025 vs 2032
Figure 4. Logistics Services Features
Figure 5. Warehousing Services Features
Figure 6. Global Chemical Supply Chain Services Market Size by Application (US$ Million), 2021–2032
Figure 7. Global Chemical Supply Chain Services Market Share by Application: 2025 vs 2032
Figure 8. Flammable and Explosive Chemicals Case Studies
Figure 9. Highly Toxic Chemicals Case Studies
Figure 10. General Chemicals Case Studies
Figure 11. Others Case Studies
Figure 12. Chemical Supply Chain Services Report Years Considered
Figure 13. Global Chemical Supply Chain Services Market Size (US$ Million), Year-over-Year: 2021–2032
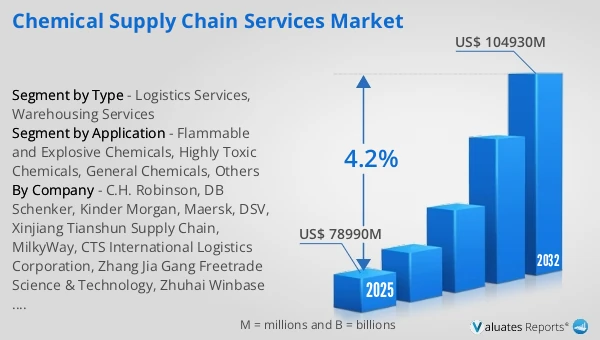
Figure 14. Global Chemical Supply Chain Services Market Size, (US$ Million), 2021 vs 2025 vs 2032
Figure 15. Global Chemical Supply Chain Services Market Share by Region: 2025 vs 2032
Figure 16. Global Chemical Supply Chain Services Market Share by Players in 2025
Figure 17. Global Chemical Supply Chain Services Market Share by Company Type (Tier 1, Tier 2, and Tier 3)
Figure 18. The Top 10 and 5 Players Market Share by Chemical Supply Chain Services Revenue in 2025
Figure 19. North America Chemical Supply Chain Services Market Size YoY Growth (US$ Million), 2021–2032
Figure 20. North America Chemical Supply Chain Services Market Share by Country (2021–2032)
Figure 21. United States Chemical Supply Chain Services Market Size YoY Growth (US$ Million), 2021–2032
Figure 22. Canada Chemical Supply Chain Services Market Size YoY Growth (US$ Million), 2021–2032
Figure 23. Europe Chemical Supply Chain Services Market Size YoY Growth (US$ Million), 2021–2032
Figure 24. Europe Chemical Supply Chain Services Market Share by Country (2021–2032)
Figure 25. Germany Chemical Supply Chain Services Market Size YoY Growth (US$ Million), 2021–2032
Figure 26. France Chemical Supply Chain Services Market Size YoY Growth (US$ Million), 2021–2032
Figure 27. U.K. Chemical Supply Chain Services Market Size YoY Growth (US$ Million), 2021–2032
Figure 28. Italy Chemical Supply Chain Services Market Size YoY Growth (US$ Million), 2021–2032
Figure 29. Russia Chemical Supply Chain Services Market Size YoY Growth (US$ Million), 2021–2032
Figure 30. Ireland Chemical Supply Chain Services Market Size YoY Growth (US$ Million), 2021–2032
Figure 31. Asia-Pacific Chemical Supply Chain Services Market Size YoY Growth (US$ Million), 2021–2032
Figure 32. Asia-Pacific Chemical Supply Chain Services Market Share by Region (2021–2032)
Figure 33. China Chemical Supply Chain Services Market Size YoY Growth (US$ Million), 2021–2032
Figure 34. Japan Chemical Supply Chain Services Market Size YoY Growth (US$ Million), 2021–2032
Figure 35. South Korea Chemical Supply Chain Services Market Size YoY Growth (US$ Million), 2021–2032
Figure 36. Southeast Asia Chemical Supply Chain Services Market Size YoY Growth (US$ Million), 2021–2032
Figure 37. India Chemical Supply Chain Services Market Size YoY Growth (US$ Million), 2021–2032
Figure 38. Australia & New Zealand Chemical Supply Chain Services Market Size YoY Growth (US$ Million), 2021–2032
Figure 39. Latin America Chemical Supply Chain Services Market Size YoY Growth (US$ Million), 2021–2032
Figure 40. Latin America Chemical Supply Chain Services Market Share by Country (2021–2032)
Figure 41. Mexico Chemical Supply Chain Services Market Size YoY Growth (US$ Million), 2021–2032
Figure 42. Brazil Chemical Supply Chain Services Market Size YoY Growth (US$ Million), 2021–2032
Figure 43. Middle East & Africa Chemical Supply Chain Services Market Size YoY Growth (US$ Million), 2021–2032
Figure 44. Middle East & Africa Chemical Supply Chain Services Market Share by Country (2021–2032)
Figure 45. Israel Chemical Supply Chain Services Market Size YoY Growth (US$ Million), 2021–2032
Figure 46. Saudi Arabia Chemical Supply Chain Services Market Size YoY Growth (US$ Million), 2021–2032
Figure 47. UAE Chemical Supply Chain Services Market Size YoY Growth (US$ Million), 2021–2032
Figure 48. C.H. Robinson Revenue Growth Rate in Chemical Supply Chain Services Business (2021–2026)
Figure 49. DB Schenker Revenue Growth Rate in Chemical Supply Chain Services Business (2021–2026)
Figure 50. Kinder Morgan Revenue Growth Rate in Chemical Supply Chain Services Business (2021–2026)
Figure 51. Maersk Revenue Growth Rate in Chemical Supply Chain Services Business (2021–2026)
Figure 52. DSV Revenue Growth Rate in Chemical Supply Chain Services Business (2021–2026)
Figure 53. Xinjiang Tianshun Supply Chain Revenue Growth Rate in Chemical Supply Chain Services Business (2021–2026)
Figure 54. MilkyWay Revenue Growth Rate in Chemical Supply Chain Services Business (2021–2026)
Figure 55. CTS International Logistics Corporation Revenue Growth Rate in Chemical Supply Chain Services Business (2021–2026)
Figure 56. Zhang Jia Gang Freetrade Science & Technology Revenue Growth Rate in Chemical Supply Chain Services Business (2021–2026)
Figure 57. Zhuhai Winbase International Chemical Tank Terminal Revenue Growth Rate in Chemical Supply Chain Services Business (2021–2026)
Figure 58. BDP International Revenue Growth Rate in Chemical Supply Chain Services Business (2021–2026)
Figure 59. Shanghai Sinotrans Chemical International Logistics Revenue Growth Rate in Chemical Supply Chain Services Business (2021–2026)
Figure 60. COSCO Shipping Logistics Revenue Growth Rate in Chemical Supply Chain Services Business (2021–2026)
Figure 61. Beifang Group Revenue Growth Rate in Chemical Supply Chain Services Business (2021–2026)
Figure 62. B2BE Revenue Growth Rate in Chemical Supply Chain Services Business (2021–2026)
Figure 63. DHL Group Revenue Growth Rate in Chemical Supply Chain Services Business (2021–2026)
Figure 64. TEU S.A Revenue Growth Rate in Chemical Supply Chain Services Business (2021–2026)
Figure 65. Huafon Group Revenue Growth Rate in Chemical Supply Chain Services Business (2021–2026)
Figure 66. Tegma Revenue Growth Rate in Chemical Supply Chain Services Business (2021–2026)
Figure 67. GEP Revenue Growth Rate in Chemical Supply Chain Services Business (2021–2026)
Figure 68. Penske Logistics Revenue Growth Rate in Chemical Supply Chain Services Business (2021–2026)
Figure 69. DGL Group Revenue Growth Rate in Chemical Supply Chain Services Business (2021–2026)
Figure 70. BSI America Revenue Growth Rate in Chemical Supply Chain Services Business (2021–2026)
Figure 71. SINOPEC Pipeline Storage & Transportation Revenue Growth Rate in Chemical Supply Chain Services Business (2021–2026)
Figure 72. Agility Revenue Growth Rate in Chemical Supply Chain Services Business (2021–2026)
Figure 73. Quantix Revenue Growth Rate in Chemical Supply Chain Services Business (2021–2026)
Figure 74. Bottom-up and Top-down Approaches for This Report
Figure 75. Data Triangulation
Figure 76. Key Executives Interviewed