List of Tables
Table 1. Global Bus Charging Station Solution Market Size Growth Rate by Type (US$ Million): 2020 VS 2024 VS 2031
Table 2. Key Players of DC Charging Piles
Table 3. Key Players of Intelligent Charging Pile Operation System
Table 4. Key Players of Dedicated Power Distribution System
Table 5. Key Players of Complete Optical Storage Equipment
Table 6. Key Players of Energy Management Platform
Table 7. Global Bus Charging Station Solution Market Size Growth by Application (US$ Million): 2020 VS 2024 VS 2031
Table 8. Global Bus Charging Station Solution Market Size by Region (US$ Million): 2020 VS 2024 VS 2031
Table 9. Global Bus Charging Station Solution Market Size by Region (2020-2025) & (US$ Million)
Table 10. Global Bus Charging Station Solution Market Share by Region (2020-2025)
Table 11. Global Bus Charging Station Solution Forecasted Market Size by Region (2026-2031) & (US$ Million)
Table 12. Global Bus Charging Station Solution Market Share by Region (2026-2031)
Table 13. Bus Charging Station Solution Market Trends
Table 14. Bus Charging Station Solution Market Drivers
Table 15. Bus Charging Station Solution Market Challenges
Table 16. Bus Charging Station Solution Market Restraints
Table 17. Global Bus Charging Station Solution Revenue by Players (2020-2025) & (US$ Million)
Table 18. Global Bus Charging Station Solution Market Share by Players (2020-2025)
Table 19. Global Top Bus Charging Station Solution Players by Company Type (Tier 1, Tier 2, and Tier 3) & (based on the Revenue in Bus Charging Station Solution as of 2024)
Table 20. Ranking of Global Top Bus Charging Station Solution Companies by Revenue (US$ Million) in 2024
Table 21. Global 5 Largest Players Market Share by Bus Charging Station Solution Revenue (CR5 and HHI) & (2020-2025)
Table 22. Global Key Players of Bus Charging Station Solution, Headquarters and Area Served
Table 23. Global Key Players of Bus Charging Station Solution, Product and Application
Table 24. Global Key Players of Bus Charging Station Solution, Date of Enter into This Industry
Table 25. Mergers & Acquisitions, Expansion Plans
Table 26. Global Bus Charging Station Solution Market Size by Type (2020-2025) & (US$ Million)
Table 27. Global Bus Charging Station Solution Revenue Market Share by Type (2020-2025)
Table 28. Global Bus Charging Station Solution Forecasted Market Size by Type (2026-2031) & (US$ Million)
Table 29. Global Bus Charging Station Solution Revenue Market Share by Type (2026-2031)
Table 30. Global Bus Charging Station Solution Market Size by Application (2020-2025) & (US$ Million)
Table 31. Global Bus Charging Station Solution Revenue Market Share by Application (2020-2025)
Table 32. Global Bus Charging Station Solution Forecasted Market Size by Application (2026-2031) & (US$ Million)
Table 33. Global Bus Charging Station Solution Revenue Market Share by Application (2026-2031)
Table 34. North America Bus Charging Station Solution Market Size Growth Rate by Country (US$ Million): 2020 VS 2024 VS 2031
Table 35. North America Bus Charging Station Solution Market Size by Country (2020-2025) & (US$ Million)
Table 36. North America Bus Charging Station Solution Market Size by Country (2026-2031) & (US$ Million)
Table 37. Europe Bus Charging Station Solution Market Size Growth Rate by Country (US$ Million): 2020 VS 2024 VS 2031
Table 38. Europe Bus Charging Station Solution Market Size by Country (2020-2025) & (US$ Million)
Table 39. Europe Bus Charging Station Solution Market Size by Country (2026-2031) & (US$ Million)
Table 40. Asia-Pacific Bus Charging Station Solution Market Size Growth Rate by Region (US$ Million): 2020 VS 2024 VS 2031
Table 41. Asia-Pacific Bus Charging Station Solution Market Size by Region (2020-2025) & (US$ Million)
Table 42. Asia-Pacific Bus Charging Station Solution Market Size by Region (2026-2031) & (US$ Million)
Table 43. Latin America Bus Charging Station Solution Market Size Growth Rate by Country (US$ Million): 2020 VS 2024 VS 2031
Table 44. Latin America Bus Charging Station Solution Market Size by Country (2020-2025) & (US$ Million)
Table 45. Latin America Bus Charging Station Solution Market Size by Country (2026-2031) & (US$ Million)
Table 46. Middle East & Africa Bus Charging Station Solution Market Size Growth Rate by Country (US$ Million): 2020 VS 2024 VS 2031
Table 47. Middle East & Africa Bus Charging Station Solution Market Size by Country (2020-2025) & (US$ Million)
Table 48. Middle East & Africa Bus Charging Station Solution Market Size by Country (2026-2031) & (US$ Million)
Table 49. Heliox Company Details
Table 50. Heliox Business Overview
Table 51. Heliox Bus Charging Station Solution Product
Table 52. Heliox Revenue in Bus Charging Station Solution Business (2020-2025) & (US$ Million)
Table 53. Heliox Recent Development
Table 54. The Mobility House Company Details
Table 55. The Mobility House Business Overview
Table 56. The Mobility House Bus Charging Station Solution Product
Table 57. The Mobility House Revenue in Bus Charging Station Solution Business (2020-2025) & (US$ Million)
Table 58. The Mobility House Recent Development
Table 59. Ekoenergetyka Company Details
Table 60. Ekoenergetyka Business Overview
Table 61. Ekoenergetyka Bus Charging Station Solution Product
Table 62. Ekoenergetyka Revenue in Bus Charging Station Solution Business (2020-2025) & (US$ Million)
Table 63. Ekoenergetyka Recent Development
Table 64. Siemens Company Details
Table 65. Siemens Business Overview
Table 66. Siemens Bus Charging Station Solution Product
Table 67. Siemens Revenue in Bus Charging Station Solution Business (2020-2025) & (US$ Million)
Table 68. Siemens Recent Development
Table 69. Circontrol Company Details
Table 70. Circontrol Business Overview
Table 71. Circontrol Bus Charging Station Solution Product
Table 72. Circontrol Revenue in Bus Charging Station Solution Business (2020-2025) & (US$ Million)
Table 73. Circontrol Recent Development
Table 74. Schunk Group Company Details
Table 75. Schunk Group Business Overview
Table 76. Schunk Group Bus Charging Station Solution Product
Table 77. Schunk Group Revenue in Bus Charging Station Solution Business (2020-2025) & (US$ Million)
Table 78. Schunk Group Recent Development
Table 79. ChargePoint Company Details
Table 80. ChargePoint Business Overview
Table 81. ChargePoint Bus Charging Station Solution Product
Table 82. ChargePoint Revenue in Bus Charging Station Solution Business (2020-2025) & (US$ Million)
Table 83. ChargePoint Recent Development
Table 84. MAN Company Details
Table 85. MAN Business Overview
Table 86. MAN Bus Charging Station Solution Product
Table 87. MAN Revenue in Bus Charging Station Solution Business (2020-2025) & (US$ Million)
Table 88. MAN Recent Development
Table 89. Scania Company Details
Table 90. Scania Business Overview
Table 91. Scania Bus Charging Station Solution Product
Table 92. Scania Revenue in Bus Charging Station Solution Business (2020-2025) & (US$ Million)
Table 93. Scania Recent Development
Table 94. EVSE Company Details
Table 95. EVSE Business Overview
Table 96. EVSE Bus Charging Station Solution Product
Table 97. EVSE Revenue in Bus Charging Station Solution Business (2020-2025) & (US$ Million)
Table 98. EVSE Recent Development
Table 99. Kempower Company Details
Table 100. Kempower Business Overview
Table 101. Kempower Bus Charging Station Solution Product
Table 102. Kempower Revenue in Bus Charging Station Solution Business (2020-2025) & (US$ Million)
Table 103. Kempower Recent Development
Table 104. Electrly Company Details
Table 105. Electrly Business Overview
Table 106. Electrly Bus Charging Station Solution Product
Table 107. Electrly Revenue in Bus Charging Station Solution Business (2020-2025) & (US$ Million)
Table 108. Electrly Recent Development
Table 109. ABB Company Details
Table 110. ABB Business Overview
Table 111. ABB Bus Charging Station Solution Product
Table 112. ABB Revenue in Bus Charging Station Solution Business (2020-2025) & (US$ Million)
Table 113. ABB Recent Development
Table 114. Hangzhou Zhonhen Electric Company Details
Table 115. Hangzhou Zhonhen Electric Business Overview
Table 116. Hangzhou Zhonhen Electric Bus Charging Station Solution Product
Table 117. Hangzhou Zhonhen Electric Revenue in Bus Charging Station Solution Business (2020-2025) & (US$ Million)
Table 118. Hangzhou Zhonhen Electric Recent Development
Table 119. Guangdong East Company Details
Table 120. Guangdong East Business Overview
Table 121. Guangdong East Bus Charging Station Solution Product
Table 122. Guangdong East Revenue in Bus Charging Station Solution Business (2020-2025) & (US$ Million)
Table 123. Guangdong East Recent Development
Table 124. Shenzhen Blink Future New Energy Technology Company Details
Table 125. Shenzhen Blink Future New Energy Technology Business Overview
Table 126. Shenzhen Blink Future New Energy Technology Bus Charging Station Solution Product
Table 127. Shenzhen Blink Future New Energy Technology Revenue in Bus Charging Station Solution Business (2020-2025) & (US$ Million)
Table 128. Shenzhen Blink Future New Energy Technology Recent Development
Table 129. Eaton Company Details
Table 130. Eaton Business Overview
Table 131. Eaton Bus Charging Station Solution Product
Table 132. Eaton Revenue in Bus Charging Station Solution Business (2020-2025) & (US$ Million)
Table 133. Eaton Recent Development
Table 134. Research Programs/Design for This Report
Table 135. Key Data Information from Secondary Sources
Table 136. Key Data Information from Primary Sources
Table 137. Authors List of This Report
List of Figures
Figure 1. Bus Charging Station Solution Picture
Figure 2. Global Bus Charging Station Solution Market Size Comparison by Type (2020-2031) & (US$ Million)
Figure 3. Global Bus Charging Station Solution Market Share by Type: 2024 VS 2031
Figure 4. DC Charging Piles Features
Figure 5. Intelligent Charging Pile Operation System Features
Figure 6. Dedicated Power Distribution System Features
Figure 7. Complete Optical Storage Equipment Features
Figure 8. Energy Management Platform Features
Figure 9. Global Bus Charging Station Solution Market Size by Application (2020-2031) & (US$ Million)
Figure 10. Global Bus Charging Station Solution Market Share by Application: 2024 VS 2031
Figure 11. Pure Electric Bus Case Studies
Figure 12. Plug-in Hybrid Bus Case Studies
Figure 13. Fuel Cell Electric Bus Case Studies
Figure 14. Bus Charging Station Solution Report Years Considered
Figure 15. Global Bus Charging Station Solution Market Size (US$ Million), Year-over-Year: 2020-2031
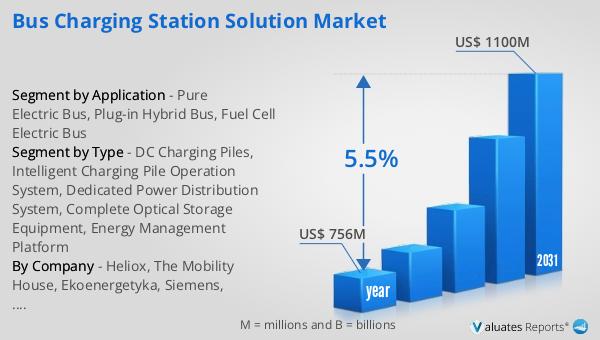
Figure 16. Global Bus Charging Station Solution Market Size, (US$ Million), 2020 VS 2024 VS 2031
Figure 17. Global Bus Charging Station Solution Market Share by Region: 2024 VS 2031
Figure 18. Global Bus Charging Station Solution Market Share by Players in 2024
Figure 19. Global Bus Charging Station Solution Market Share by Company Type (Tier 1, Tier 2, and Tier 3)
Figure 20. The Top 10 and 5 Players Market Share by Bus Charging Station Solution Revenue in 2024
Figure 21. North America Bus Charging Station Solution Market Size YoY Growth (2020-2031) & (US$ Million)
Figure 22. North America Bus Charging Station Solution Market Share by Country (2020-2031)
Figure 23. United States Bus Charging Station Solution Market Size YoY Growth (2020-2031) & (US$ Million)
Figure 24. Canada Bus Charging Station Solution Market Size YoY Growth (2020-2031) & (US$ Million)
Figure 25. Europe Bus Charging Station Solution Market Size YoY Growth (2020-2031) & (US$ Million)
Figure 26. Europe Bus Charging Station Solution Market Share by Country (2020-2031)
Figure 27. Germany Bus Charging Station Solution Market Size YoY Growth (2020-2031) & (US$ Million)
Figure 28. France Bus Charging Station Solution Market Size YoY Growth (2020-2031) & (US$ Million)
Figure 29. U.K. Bus Charging Station Solution Market Size YoY Growth (2020-2031) & (US$ Million)
Figure 30. Italy Bus Charging Station Solution Market Size YoY Growth (2020-2031) & (US$ Million)
Figure 31. Russia Bus Charging Station Solution Market Size YoY Growth (2020-2031) & (US$ Million)
Figure 32. Nordic Countries Bus Charging Station Solution Market Size YoY Growth (2020-2031) & (US$ Million)
Figure 33. Asia-Pacific Bus Charging Station Solution Market Size YoY Growth (2020-2031) & (US$ Million)
Figure 34. Asia-Pacific Bus Charging Station Solution Market Share by Region (2020-2031)
Figure 35. China Bus Charging Station Solution Market Size YoY Growth (2020-2031) & (US$ Million)
Figure 36. Japan Bus Charging Station Solution Market Size YoY Growth (2020-2031) & (US$ Million)
Figure 37. South Korea Bus Charging Station Solution Market Size YoY Growth (2020-2031) & (US$ Million)
Figure 38. Southeast Asia Bus Charging Station Solution Market Size YoY Growth (2020-2031) & (US$ Million)
Figure 39. India Bus Charging Station Solution Market Size YoY Growth (2020-2031) & (US$ Million)
Figure 40. Australia Bus Charging Station Solution Market Size YoY Growth (2020-2031) & (US$ Million)
Figure 41. Latin America Bus Charging Station Solution Market Size YoY Growth (2020-2031) & (US$ Million)
Figure 42. Latin America Bus Charging Station Solution Market Share by Country (2020-2031)
Figure 43. Mexico Bus Charging Station Solution Market Size YoY Growth (2020-2031) & (US$ Million)
Figure 44. Brazil Bus Charging Station Solution Market Size YoY Growth (2020-2031) & (US$ Million)
Figure 45. Middle East & Africa Bus Charging Station Solution Market Size YoY Growth (2020-2031) & (US$ Million)
Figure 46. Middle East & Africa Bus Charging Station Solution Market Share by Country (2020-2031)
Figure 47. Turkey Bus Charging Station Solution Market Size YoY Growth (2020-2031) & (US$ Million)
Figure 48. Saudi Arabia Bus Charging Station Solution Market Size YoY Growth (2020-2031) & (US$ Million)
Figure 49. UAE Bus Charging Station Solution Market Size YoY Growth (2020-2031) & (US$ Million)
Figure 50. Heliox Revenue Growth Rate in Bus Charging Station Solution Business (2020-2025)
Figure 51. The Mobility House Revenue Growth Rate in Bus Charging Station Solution Business (2020-2025)
Figure 52. Ekoenergetyka Revenue Growth Rate in Bus Charging Station Solution Business (2020-2025)
Figure 53. Siemens Revenue Growth Rate in Bus Charging Station Solution Business (2020-2025)
Figure 54. Circontrol Revenue Growth Rate in Bus Charging Station Solution Business (2020-2025)
Figure 55. Schunk Group Revenue Growth Rate in Bus Charging Station Solution Business (2020-2025)
Figure 56. ChargePoint Revenue Growth Rate in Bus Charging Station Solution Business (2020-2025)
Figure 57. MAN Revenue Growth Rate in Bus Charging Station Solution Business (2020-2025)
Figure 58. Scania Revenue Growth Rate in Bus Charging Station Solution Business (2020-2025)
Figure 59. EVSE Revenue Growth Rate in Bus Charging Station Solution Business (2020-2025)
Figure 60. Kempower Revenue Growth Rate in Bus Charging Station Solution Business (2020-2025)
Figure 61. Electrly Revenue Growth Rate in Bus Charging Station Solution Business (2020-2025)
Figure 62. ABB Revenue Growth Rate in Bus Charging Station Solution Business (2020-2025)
Figure 63. Hangzhou Zhonhen Electric Revenue Growth Rate in Bus Charging Station Solution Business (2020-2025)
Figure 64. Guangdong East Revenue Growth Rate in Bus Charging Station Solution Business (2020-2025)
Figure 65. Shenzhen Blink Future New Energy Technology Revenue Growth Rate in Bus Charging Station Solution Business (2020-2025)
Figure 66. Eaton Revenue Growth Rate in Bus Charging Station Solution Business (2020-2025)
Figure 67. Bottom-up and Top-down Approaches for This Report
Figure 68. Data Triangulation
Figure 69. Key Executives Interviewed