0
U.S. (TOLL FREE)
+1 (315) 215-3225
Automative

0
U.S. (TOLL FREE)
+1 (315) 215-3225
Global Clad Metal Market Research Report 2026
Published Date: 2026-05-26
|
Report Code: QYRE-Auto-13R20524
Home | Market Reports | Business & Industrial| Metals & Mining
Global Clad Metal Market Research Report 2026
BUY CHAPTERS

Global Clad Metal Market Research Report 2026

Code: QYRE-Auto-13R20524
Report
2026-05-26
Pages:182
QYResearch
Buy Now with 15% Discount
DESCRIPTION
TABLE OF CONTENT
TABLES & FIGURES

Clad Metal Market Size

The global Clad Metal market was valued at US$ 6998 million in 2025 and is anticipated to reach US$ 10407 million by 2032, at a CAGR of 5.8% from 2026 to 2032.

Clad Metal Market

Clad Metal Market

The 2025 U.S. tariff policies introduce profound uncertainty into the global economic landscape. This report critically examines the implications of recent tariff adjustments and international strategic countermeasures on Clad Metal competitive dynamics, regional economic interdependencies, and supply chain reconfigurations.
Clad metals refer to layered metallic composite materials made by bonding two or more dissimilar metals into a single integrated material through processes such as roll bonding, explosion bonding, diffusion bonding, brazing, electron-beam welding, weld overlay, mechanical lining or other metallurgical and structural joining methods. A typical clad metal combines a base layer that provides strength, pressure-bearing capability, weight reduction or cost efficiency with one or more cladding layers that provide corrosion resistance, wear resistance, electrical conductivity, thermal conductivity, brazability, weldability, precious-metal contact performance or controlled thermal expansion. The main product forms include clad plates, clad strips, clad foils, clad pipes, clad wires, bimetals, battery interconnect clad materials, electrical connector clad materials and multilayer blade or cookware steels. Key specifications include base metal and cladding metal combination, number of layers, total thickness, cladding thickness, bond strength, shear strength, peel strength, corrosion resistance, electrical conductivity, thermal conductivity, coefficient of thermal expansion, formability, weldability, plate width, strip width, thickness tolerance and downstream process compatibility. In this report, the scope focuses on industrial layered metal composites and semi-finished clad metal products rather than plated metals, coated metals or polymer-metal laminates.
In 2025, global clad metal production is projected to reach 1.65 million tons, with an average price of US$4,320 per ton and an average gross margin of 22.5%.
Based on our research, clad metals are a functional composite segment within advanced metallic materials. The core value of the category is not simply higher strength, but the ability to combine different metals into one integrated material so that cost, strength, corrosion resistance, conductivity, thermal performance, weldability, brazability and surface functionality can be optimized together. In chemical processing, oil and gas, offshore, nuclear, pulp and paper, salt chemical and pressure-vessel applications, titanium-steel, zirconium-steel, nickel-alloy-steel and stainless-steel-clad plates can reduce the use of expensive corrosion-resistant alloys while preserving the load-bearing performance of the base metal. In automotive thermal management, batteries, connectors, thermostats and electronics, copper-aluminum, nickel-copper, silver-copper, aluminum-steel and other multilayer strips provide a practical route to combine electrical, thermal, joining and weight advantages. The correct market boundary is therefore layered metallic bonding and functional integration, not ordinary steel, plated metal or coated sheet products.
From the supply side, the market is split into several structurally different groups. Heavy clad plate producers focus on pressure vessels, chemical equipment, energy and industrial corrosion-resistance applications. Precision clad strip suppliers serve batteries, electronics, connectors, thermal devices, appliances and industrial components, where thickness tolerance, batch consistency and downstream stamping or welding performance are critical. Clad pipe and mechanically lined pipe suppliers serve oil and gas, subsea, geothermal, CCUS and corrosive-fluid transportation, where long service life and corrosion resistance are the key value proposition. This explains why the broad vendor universe is much wider than the core formal list. Many metal distributors, stockholders, surface-treatment shops and fabricated-equipment companies may trade or use clad materials, but they should not be treated as true clad metal producers under a narrow manufacturing scope.
Demand growth is being supported by three major forces. The first is corrosion-resistance demand in chemical processing, oil and gas, desalination, marine and energy equipment, where clad plates and clad pipes can reduce life-cycle costs compared with solid alloy alternatives. The second is electrification and electronics, where battery interconnects, busbars, connectors and thermal-management parts require dissimilar-metal bonding to improve conductivity, joinability and weight efficiency. The third is industrial localization and materials substitution, especially in China and India, where domestic producers are expanding in titanium-steel, zirconium-steel, stainless-steel-clad and aluminum-steel composites. However, each subsegment has a different demand cycle: heavy clad plate is project-driven and linked to capital expenditure, while precision clad strip is more volume-driven and tied to automotive, battery and electronics qualification cycles.
From a technology perspective, the industry is moving from conventional heavy plate and simple bimetal structures toward thinner, wider, more multilayered and more precisely controlled clad materials. Explosion bonding remains important for thick plates, reactive metals and combinations that are difficult to weld by conventional methods. Roll bonding is more suitable for high-volume plates, strips and foils used in automotive, electronics and heat-transfer applications. Diffusion bonding, vacuum rolling, surface-activated bonding and electron-beam welding are increasingly relevant for precision materials where interface control and dimensional tolerance are critical. Future competition will depend on metallurgical interface quality, bond strength, thickness uniformity, downstream formability, welding compatibility, customer co-development and certification capability. Overall, the industry is mature but structurally growing, with stronger momentum in battery, electronics and lightweighting applications than in commoditized low-end clad plate products.
This report delivers a comprehensive overview of the global Clad Metal market, with both quantitative and qualitative analyses, to help readers develop growth strategies, assess the competitive landscape, evaluate their position in the current market, and make informed business decisions regarding Clad Metal. The Clad Metal market size, estimates, and forecasts are provided in terms of output/shipments (Kilotons) and revenue (US$ millions), with 2025 as the base year and historical and forecast data for 2021–2032.
The report segments the global Clad Metal market comprehensively. Regional market sizes by Type, by Application, by Bonding Process, and by company are also provided. For deeper insight, the report profiles the competitive landscape, key competitors, and their respective market rankings, and discusses technological trends and new product developments.
This report will assist Clad Metal manufacturers, new entrants, and companies across the industry value chain with information on revenues, production, and average prices for the overall market and its sub-segments, by company, by Type, by Application, and by region.
Market Segmentation

Scope of Clad Metal Market Report

Report Metric Details
Report Name Clad Metal Market
Accounted market size in 2025 US$ 6998 million
Forecasted market size in 2032 US$ 10407 million
CAGR 5.8%
Base Year 2025
Forecasted years 2026 - 2032
Segment by Type
  • Stainless Steel/Carbon Steel Clad
  • Titanium/Steel Clad
  • Zirconium/Steel Clad
  • Nickel Alloy/Steel Clad
  • Copper/Aluminum Clad
  • Aluminum/Steel Clad
  • Silver/Copper Clad
  • Copper/Steel Clad
  • Other
Segment by Bonding Process
  • Roll Bonding
  • Explosion Bonding
  • Diffusion Bonding
  • Brazing Cladding
  • Weld Overlay Cladding
  • Mechanical Lining
  • Electron Beam Welding
  • Other Bonding Processes
Segment by Product Form
  • Sheets
  • Strips
  • Foils
  • Pipes
  • Wires
  • Others
by Application
  • Energy and Oil & Gas
  • Chemical Processing
  • Marine and Offshore
  • Automotive and EV
  • Electronics and Electrical
  • Aerospace and Defense
  • Medical Devices
  • Others
Production by Region
  • North America
  • Europe
  • China
  • Japan
  • India
  • Southeast Asia
Consumption by Region
  • North America (United States, Canada)
  • Europe (Germany, France, UK, Italy, Russia)
  • Asia-Pacific (China, Japan, South Korea, Taiwan)
  • Southeast Asia (India)
  • Latin America (Mexico, Brazil)
By Company DMC Global Inc., Materion Corporation, Wickeder Group, AMETEK Specialty Metal Products, Clad Metal Specialties, Inc., High Energy Metals, Inc., Nippon Steel Corporation, JFE Steel Corporation, Proterial, Ltd., Toyo Kohan Co., Ltd., TAKEFU SPECIAL STEEL CO., LTD., voestalpine Stahl GmbH, ArcelorMittal Industeel, Aperam S.A., BUTTING Group, EEW Group, Cladtek, Proclad Group, Shivalik Bimetal Controls Limited, Imploclad, Telcon Bimetals, DKC International, Dongkuk Steel Mill Co., Ltd., DAE HWA METAL CO., LTD., Korea Clad Tech Co., Ltd., Perfect Welding Technology Co., Ltd., Western Metal Materials Co., Ltd., Baoti Metal Composite Materials Co., Ltd., Nanjing Baotai Special Materials Co., Ltd., Yinbang Clad Material Co., Ltd., Gallianz (Anhui) New Materials Co., Ltd., Hunan Phohom New Material Technology Co., Ltd., Baoji Titanium Cheng Metal Composite Materials Co., Ltd., Wuxi Tianrui Metal Products Co., Ltd., Dalian Shipbuilding Industry Co., Ltd., Shanghai Metal Corporation
Forecast units USD million in value
Report coverage Revenue and volume forecast, company share, competitive landscape, growth factors and trends

Chapter Outline

  • Chapter 1: Defines the scope of the report and presents an executive summary of market segments (by Type, by Application, by Bonding Process, etc.), including the size of each segment and its future growth potential. It offers a high-level view of the current market and its likely evolution in the short, medium, and long term.
  • Chapter 2: Provides a detailed analysis of the competitive landscape for Clad Metal manufacturers, including prices, production, value-based market shares, latest development plans, and information on mergers and acquisitions.
  • Chapter 3: Examines Clad Metal production/output and value by region and country, providing a quantitative assessment of market size and growth potential for each region over the next six years.
  • Chapter 4: Analyzes Clad Metal consumption at the regional and country levels. It quantifies market size and growth potential for each region and its key countries, and outlines market development, outlook, addressable space, and national production.
  • Chapter 5: Analyzes market segments by Type, covering the size and growth potential of each segment to help readers identify “blue ocean” opportunities.
  • Chapter 6: Analyzes market segments by Application, covering the size and growth potential of each segment to help readers identify “blue ocean” opportunities in downstream markets.
  • Chapter 7: Profiles key players, detailing the fundamentals of major companies, including product production/output, value, price, gross margin, product portfolio/introductions, and recent developments.
  • Chapter 8: Reviews the industry value chain, including upstream and downstream segments.
  • Chapter 9: Discusses market dynamics and recent developments, including drivers, restraints, challenges and risks for manufacturers, U.S. Tariffs and relevant policy analysis.
  • Chapter 10: Summarizes the key findings and conclusions of the report.

FAQ for this report

How fast is Clad Metal Market growing?

Ans: The Clad Metal Market witnessing a CAGR of 5.8% during the forecast period 2026-2032.

What is the Clad Metal Market size in 2032?

Ans: The Clad Metal Market size in 2032 will be US$ 10407 million.

Who are the main players in the Clad Metal Market report?

Ans: The main players in the Clad Metal Market are DMC Global Inc., Materion Corporation, Wickeder Group, AMETEK Specialty Metal Products, Clad Metal Specialties, Inc., High Energy Metals, Inc., Nippon Steel Corporation, JFE Steel Corporation, Proterial, Ltd., Toyo Kohan Co., Ltd., TAKEFU SPECIAL STEEL CO., LTD., voestalpine Stahl GmbH, ArcelorMittal Industeel, Aperam S.A., BUTTING Group, EEW Group, Cladtek, Proclad Group, Shivalik Bimetal Controls Limited, Imploclad, Telcon Bimetals, DKC International, Dongkuk Steel Mill Co., Ltd., DAE HWA METAL CO., LTD., Korea Clad Tech Co., Ltd., Perfect Welding Technology Co., Ltd., Western Metal Materials Co., Ltd., Baoti Metal Composite Materials Co., Ltd., Nanjing Baotai Special Materials Co., Ltd., Yinbang Clad Material Co., Ltd., Gallianz (Anhui) New Materials Co., Ltd., Hunan Phohom New Material Technology Co., Ltd., Baoji Titanium Cheng Metal Composite Materials Co., Ltd., Wuxi Tianrui Metal Products Co., Ltd., Dalian Shipbuilding Industry Co., Ltd., Shanghai Metal Corporation

What are the Application segmentation covered in the Clad Metal Market report?

Ans: The Applications covered in the Clad Metal Market report are Energy and Oil & Gas, Chemical Processing, Marine and Offshore, Automotive and EV, Electronics and Electrical, Aerospace and Defense, Medical Devices, Others

What are the Type segmentation covered in the Clad Metal Market report?

Ans: The Types covered in the Clad Metal Market report are Stainless Steel/Carbon Steel Clad, Titanium/Steel Clad, Zirconium/Steel Clad, Nickel Alloy/Steel Clad, Copper/Aluminum Clad, Aluminum/Steel Clad, Silver/Copper Clad, Copper/Steel Clad, Other

1 Clad Metal Market Overview
1.1 Product Definition
1.2 Clad Metal by Type
1.2.1 Global Clad Metal Market Value Growth Rate Analysis by Type: 2025 vs 2032
1.2.2 Stainless Steel/Carbon Steel Clad
1.2.3 Titanium/Steel Clad
1.2.4 Zirconium/Steel Clad
1.2.5 Nickel Alloy/Steel Clad
1.2.6 Copper/Aluminum Clad
1.2.7 Aluminum/Steel Clad
1.2.8 Silver/Copper Clad
1.2.9 Copper/Steel Clad
1.2.10 Other
1.3 Clad Metal by Bonding Process
1.3.1 Global Clad Metal Market Value Growth Rate Analysis by Bonding Process: 2025 vs 2032
1.3.2 Roll Bonding
1.3.3 Explosion Bonding
1.3.4 Diffusion Bonding
1.3.5 Brazing Cladding
1.3.6 Weld Overlay Cladding
1.3.7 Mechanical Lining
1.3.8 Electron Beam Welding
1.3.9 Other Bonding Processes
1.4 Clad Metal by Product Form
1.4.1 Global Clad Metal Market Value Growth Rate Analysis by Product Form: 2025 vs 2032
1.4.2 Sheets
1.4.3 Strips
1.4.4 Foils
1.4.5 Pipes
1.4.6 Wires
1.4.7 Others
1.5 Clad Metal by Application
1.5.1 Global Clad Metal Market Value Growth Rate Analysis by Application: 2025 vs 2032
1.5.2 Energy and Oil & Gas
1.5.3 Chemical Processing
1.5.4 Marine and Offshore
1.5.5 Automotive and EV
1.5.6 Electronics and Electrical
1.5.7 Aerospace and Defense
1.5.8 Medical Devices
1.5.9 Others
1.6 Global Market Growth Prospects
1.6.1 Global Clad Metal Production Value Estimates and Forecasts (2021–2032)
1.6.2 Global Clad Metal Production Capacity Estimates and Forecasts (2021–2032)
1.6.3 Global Clad Metal Production Estimates and Forecasts (2021–2032)
1.6.4 Global Clad Metal Market Average Price Estimates and Forecasts (2021–2032)
1.7 Assumptions and Limitations
2 Market Competition by Manufacturers
2.1 Global Clad Metal Production Market Share by Manufacturers (2021–2026)
2.2 Global Clad Metal Production Value Market Share by Manufacturers (2021–2026)
2.3 Global Key Players of Clad Metal, Industry Ranking, 2024 vs 2025
2.4 Global Clad Metal Market Share by Company Tier (Tier 1, Tier 2, Tier 3)
2.5 Global Clad Metal Average Price by Manufacturers (2021–2026)
2.6 Global Key Manufacturers of Clad Metal, Manufacturing Footprints and Headquarters
2.7 Global Key Manufacturers of Clad Metal, Product Offerings and Applications
2.8 Global Key Manufacturers of Clad Metal, Date of Entry into the Industry
2.9 Clad Metal Market Competitive Situation and Trends
2.9.1 Clad Metal Market Concentration Rate
2.9.2 Top 5 and Top 10 Global Clad Metal Players Market Share by Revenue
2.10 Mergers & Acquisitions and Expansion
3 Clad Metal Production by Region
3.1 Global Clad Metal Production Value Estimates and Forecasts by Region: 2021 vs 2025 vs 2032
3.2 Global Clad Metal Production Value by Region (2021–2032)
3.2.1 Global Clad Metal Production Value by Region (2021–2026)
3.2.2 Global Forecasted Production Value of Clad Metal by Region (2027–2032)
3.3 Global Clad Metal Production Estimates and Forecasts by Region: 2021 vs 2025 vs 2032
3.4 Global Clad Metal Production Volume by Region (2021–2032)
3.4.1 Global Clad Metal Production by Region (2021–2026)
3.4.2 Global Forecasted Production of Clad Metal by Region (2027–2032)
3.5 Global Clad Metal Market Price Analysis by Region (2021–2032)
3.6 Global Clad Metal Production, Value, and Year-over-Year Growth
3.6.1 North America Clad Metal Production Value Estimates and Forecasts (2021–2032)
3.6.2 Europe Clad Metal Production Value Estimates and Forecasts (2021–2032)
3.6.3 China Clad Metal Production Value Estimates and Forecasts (2021–2032)
3.6.4 Japan Clad Metal Production Value Estimates and Forecasts (2021–2032)
3.6.5 India Clad Metal Production Value Estimates and Forecasts (2021–2032)
3.6.6 Southeast Asia Clad Metal Production Value Estimates and Forecasts (2021–2032)
4 Clad Metal Consumption by Region
4.1 Global Clad Metal Consumption Estimates and Forecasts by Region: 2021 vs 2025 vs 2032
4.2 Global Clad Metal Consumption by Region (2021–2032)
4.2.1 Global Clad Metal Consumption by Region (2021–2026)
4.2.2 Global Clad Metal Forecasted Consumption by Region (2027–2032)
4.3 North America
4.3.1 North America Clad Metal Consumption Growth Rate by Country: 2021 vs 2025 vs 2032
4.3.2 North America Clad Metal Consumption by Country (2021–2032)
4.3.3 U.S.
4.3.4 Canada
4.4 Europe
4.4.1 Europe Clad Metal Consumption Growth Rate by Country: 2021 vs 2025 vs 2032
4.4.2 Europe Clad Metal Consumption by Country (2021–2032)
4.4.3 Germany
4.4.4 France
4.4.5 U.K.
4.4.6 Italy
4.4.7 Russia
4.5 Asia Pacific
4.5.1 Asia Pacific Clad Metal Consumption Growth Rate by Region: 2021 vs 2025 vs 2032
4.5.2 Asia Pacific Clad Metal Consumption by Region (2021–2032)
4.5.3 China
4.5.4 Japan
4.5.5 South Korea
4.5.6 China Taiwan
4.5.7 Southeast Asia
4.5.8 India
4.6 Latin America, Middle East & Africa
4.6.1 Latin America, Middle East & Africa Clad Metal Consumption Growth Rate by Country: 2021 vs 2025 vs 2032
4.6.2 Latin America, Middle East & Africa Clad Metal Consumption by Country (2021–2032)
4.6.3 Mexico
4.6.4 Brazil
4.6.5 Turkey
4.6.6 GCC Countries
5 Segment by Type
5.1 Global Clad Metal Production by Type (2021–2032)
5.1.1 Global Clad Metal Production by Type (2021–2026)
5.1.2 Global Clad Metal Production by Type (2027–2032)
5.1.3 Global Clad Metal Production Market Share by Type (2021–2032)
5.2 Global Clad Metal Production Value by Type (2021–2032)
5.2.1 Global Clad Metal Production Value by Type (2021–2026)
5.2.2 Global Clad Metal Production Value by Type (2027–2032)
5.2.3 Global Clad Metal Production Value Market Share by Type (2021–2032)
5.3 Global Clad Metal Price by Type (2021–2032)
6 Segment by Application
6.1 Global Clad Metal Production by Application (2021–2032)
6.1.1 Global Clad Metal Production by Application (2021–2026)
6.1.2 Global Clad Metal Production by Application (2027–2032)
6.1.3 Global Clad Metal Production Market Share by Application (2021–2032)
6.2 Global Clad Metal Production Value by Application (2021–2032)
6.2.1 Global Clad Metal Production Value by Application (2021–2026)
6.2.2 Global Clad Metal Production Value by Application (2027–2032)
6.2.3 Global Clad Metal Production Value Market Share by Application (2021–2032)
6.3 Global Clad Metal Price by Application (2021–2032)
7 Key Companies Profiled
7.1 DMC Global Inc.
7.1.1 DMC Global Inc. Clad Metal Company Information
7.1.2 DMC Global Inc. Clad Metal Product Portfolio
7.1.3 DMC Global Inc. Clad Metal Production, Value, Price, and Gross Margin (2021–2026)
7.1.4 DMC Global Inc. Main Business and Markets Served
7.1.5 DMC Global Inc. Recent Developments/Updates
7.2 Materion Corporation
7.2.1 Materion Corporation Clad Metal Company Information
7.2.2 Materion Corporation Clad Metal Product Portfolio
7.2.3 Materion Corporation Clad Metal Production, Value, Price, and Gross Margin (2021–2026)
7.2.4 Materion Corporation Main Business and Markets Served
7.2.5 Materion Corporation Recent Developments/Updates
7.3 Wickeder Group
7.3.1 Wickeder Group Clad Metal Company Information
7.3.2 Wickeder Group Clad Metal Product Portfolio
7.3.3 Wickeder Group Clad Metal Production, Value, Price, and Gross Margin (2021–2026)
7.3.4 Wickeder Group Main Business and Markets Served
7.3.5 Wickeder Group Recent Developments/Updates
7.4 AMETEK Specialty Metal Products
7.4.1 AMETEK Specialty Metal Products Clad Metal Company Information
7.4.2 AMETEK Specialty Metal Products Clad Metal Product Portfolio
7.4.3 AMETEK Specialty Metal Products Clad Metal Production, Value, Price, and Gross Margin (2021–2026)
7.4.4 AMETEK Specialty Metal Products Main Business and Markets Served
7.4.5 AMETEK Specialty Metal Products Recent Developments/Updates
7.5 Clad Metal Specialties, Inc.
7.5.1 Clad Metal Specialties, Inc. Clad Metal Company Information
7.5.2 Clad Metal Specialties, Inc. Clad Metal Product Portfolio
7.5.3 Clad Metal Specialties, Inc. Clad Metal Production, Value, Price, and Gross Margin (2021–2026)
7.5.4 Clad Metal Specialties, Inc. Main Business and Markets Served
7.5.5 Clad Metal Specialties, Inc. Recent Developments/Updates
7.6 High Energy Metals, Inc.
7.6.1 High Energy Metals, Inc. Clad Metal Company Information
7.6.2 High Energy Metals, Inc. Clad Metal Product Portfolio
7.6.3 High Energy Metals, Inc. Clad Metal Production, Value, Price, and Gross Margin (2021–2026)
7.6.4 High Energy Metals, Inc. Main Business and Markets Served
7.6.5 High Energy Metals, Inc. Recent Developments/Updates
7.7 Nippon Steel Corporation
7.7.1 Nippon Steel Corporation Clad Metal Company Information
7.7.2 Nippon Steel Corporation Clad Metal Product Portfolio
7.7.3 Nippon Steel Corporation Clad Metal Production, Value, Price, and Gross Margin (2021–2026)
7.7.4 Nippon Steel Corporation Main Business and Markets Served
7.7.5 Nippon Steel Corporation Recent Developments/Updates
7.8 JFE Steel Corporation
7.8.1 JFE Steel Corporation Clad Metal Company Information
7.8.2 JFE Steel Corporation Clad Metal Product Portfolio
7.8.3 JFE Steel Corporation Clad Metal Production, Value, Price, and Gross Margin (2021–2026)
7.8.4 JFE Steel Corporation Main Business and Markets Served
7.8.5 JFE Steel Corporation Recent Developments/Updates
7.9 Proterial, Ltd.
7.9.1 Proterial, Ltd. Clad Metal Company Information
7.9.2 Proterial, Ltd. Clad Metal Product Portfolio
7.9.3 Proterial, Ltd. Clad Metal Production, Value, Price, and Gross Margin (2021–2026)
7.9.4 Proterial, Ltd. Main Business and Markets Served
7.9.5 Proterial, Ltd. Recent Developments/Updates
7.10 Toyo Kohan Co., Ltd.
7.10.1 Toyo Kohan Co., Ltd. Clad Metal Company Information
7.10.2 Toyo Kohan Co., Ltd. Clad Metal Product Portfolio
7.10.3 Toyo Kohan Co., Ltd. Clad Metal Production, Value, Price, and Gross Margin (2021–2026)
7.10.4 Toyo Kohan Co., Ltd. Main Business and Markets Served
7.10.5 Toyo Kohan Co., Ltd. Recent Developments/Updates
7.11 TAKEFU SPECIAL STEEL CO., LTD.
7.11.1 TAKEFU SPECIAL STEEL CO., LTD. Clad Metal Company Information
7.11.2 TAKEFU SPECIAL STEEL CO., LTD. Clad Metal Product Portfolio
7.11.3 TAKEFU SPECIAL STEEL CO., LTD. Clad Metal Production, Value, Price, and Gross Margin (2021–2026)
7.11.4 TAKEFU SPECIAL STEEL CO., LTD. Main Business and Markets Served
7.11.5 TAKEFU SPECIAL STEEL CO., LTD. Recent Developments/Updates
7.12 voestalpine Stahl GmbH
7.12.1 voestalpine Stahl GmbH Clad Metal Company Information
7.12.2 voestalpine Stahl GmbH Clad Metal Product Portfolio
7.12.3 voestalpine Stahl GmbH Clad Metal Production, Value, Price, and Gross Margin (2021–2026)
7.12.4 voestalpine Stahl GmbH Main Business and Markets Served
7.12.5 voestalpine Stahl GmbH Recent Developments/Updates
7.13 ArcelorMittal Industeel
7.13.1 ArcelorMittal Industeel Clad Metal Company Information
7.13.2 ArcelorMittal Industeel Clad Metal Product Portfolio
7.13.3 ArcelorMittal Industeel Clad Metal Production, Value, Price, and Gross Margin (2021–2026)
7.13.4 ArcelorMittal Industeel Main Business and Markets Served
7.13.5 ArcelorMittal Industeel Recent Developments/Updates
7.14 Aperam S.A.
7.14.1 Aperam S.A. Clad Metal Company Information
7.14.2 Aperam S.A. Clad Metal Product Portfolio
7.14.3 Aperam S.A. Clad Metal Production, Value, Price, and Gross Margin (2021–2026)
7.14.4 Aperam S.A. Main Business and Markets Served
7.14.5 Aperam S.A. Recent Developments/Updates
7.15 BUTTING Group
7.15.1 BUTTING Group Clad Metal Company Information
7.15.2 BUTTING Group Clad Metal Product Portfolio
7.15.3 BUTTING Group Clad Metal Production, Value, Price, and Gross Margin (2021–2026)
7.15.4 BUTTING Group Main Business and Markets Served
7.15.5 BUTTING Group Recent Developments/Updates
7.16 EEW Group
7.16.1 EEW Group Clad Metal Company Information
7.16.2 EEW Group Clad Metal Product Portfolio
7.16.3 EEW Group Clad Metal Production, Value, Price, and Gross Margin (2021–2026)
7.16.4 EEW Group Main Business and Markets Served
7.16.5 EEW Group Recent Developments/Updates
7.17 Cladtek
7.17.1 Cladtek Clad Metal Company Information
7.17.2 Cladtek Clad Metal Product Portfolio
7.17.3 Cladtek Clad Metal Production, Value, Price, and Gross Margin (2021–2026)
7.17.4 Cladtek Main Business and Markets Served
7.17.5 Cladtek Recent Developments/Updates
7.18 Proclad Group
7.18.1 Proclad Group Clad Metal Company Information
7.18.2 Proclad Group Clad Metal Product Portfolio
7.18.3 Proclad Group Clad Metal Production, Value, Price, and Gross Margin (2021–2026)
7.18.4 Proclad Group Main Business and Markets Served
7.18.5 Proclad Group Recent Developments/Updates
7.19 Shivalik Bimetal Controls Limited
7.19.1 Shivalik Bimetal Controls Limited Clad Metal Company Information
7.19.2 Shivalik Bimetal Controls Limited Clad Metal Product Portfolio
7.19.3 Shivalik Bimetal Controls Limited Clad Metal Production, Value, Price, and Gross Margin (2021–2026)
7.19.4 Shivalik Bimetal Controls Limited Main Business and Markets Served
7.19.5 Shivalik Bimetal Controls Limited Recent Developments/Updates
7.20 Imploclad
7.20.1 Imploclad Clad Metal Company Information
7.20.2 Imploclad Clad Metal Product Portfolio
7.20.3 Imploclad Clad Metal Production, Value, Price, and Gross Margin (2021–2026)
7.20.4 Imploclad Main Business and Markets Served
7.20.5 Imploclad Recent Developments/Updates
7.21 Telcon Bimetals
7.21.1 Telcon Bimetals Clad Metal Company Information
7.21.2 Telcon Bimetals Clad Metal Product Portfolio
7.21.3 Telcon Bimetals Clad Metal Production, Value, Price, and Gross Margin (2021–2026)
7.21.4 Telcon Bimetals Main Business and Markets Served
7.21.5 Telcon Bimetals Recent Developments/Updates
7.22 DKC International
7.22.1 DKC International Clad Metal Company Information
7.22.2 DKC International Clad Metal Product Portfolio
7.22.3 DKC International Clad Metal Production, Value, Price, and Gross Margin (2021–2026)
7.22.4 DKC International Main Business and Markets Served
7.22.5 DKC International Recent Developments/Updates
7.23 Dongkuk Steel Mill Co., Ltd.
7.23.1 Dongkuk Steel Mill Co., Ltd. Clad Metal Company Information
7.23.2 Dongkuk Steel Mill Co., Ltd. Clad Metal Product Portfolio
7.23.3 Dongkuk Steel Mill Co., Ltd. Clad Metal Production, Value, Price, and Gross Margin (2021–2026)
7.23.4 Dongkuk Steel Mill Co., Ltd. Main Business and Markets Served
7.23.5 Dongkuk Steel Mill Co., Ltd. Recent Developments/Updates
7.24 DAE HWA METAL CO., LTD.
7.24.1 DAE HWA METAL CO., LTD. Clad Metal Company Information
7.24.2 DAE HWA METAL CO., LTD. Clad Metal Product Portfolio
7.24.3 DAE HWA METAL CO., LTD. Clad Metal Production, Value, Price, and Gross Margin (2021–2026)
7.24.4 DAE HWA METAL CO., LTD. Main Business and Markets Served
7.24.5 DAE HWA METAL CO., LTD. Recent Developments/Updates
7.25 Korea Clad Tech Co., Ltd.
7.25.1 Korea Clad Tech Co., Ltd. Clad Metal Company Information
7.25.2 Korea Clad Tech Co., Ltd. Clad Metal Product Portfolio
7.25.3 Korea Clad Tech Co., Ltd. Clad Metal Production, Value, Price, and Gross Margin (2021–2026)
7.25.4 Korea Clad Tech Co., Ltd. Main Business and Markets Served
7.25.5 Korea Clad Tech Co., Ltd. Recent Developments/Updates
7.26 Perfect Welding Technology Co., Ltd.
7.26.1 Perfect Welding Technology Co., Ltd. Clad Metal Company Information
7.26.2 Perfect Welding Technology Co., Ltd. Clad Metal Product Portfolio
7.26.3 Perfect Welding Technology Co., Ltd. Clad Metal Production, Value, Price, and Gross Margin (2021–2026)
7.26.4 Perfect Welding Technology Co., Ltd. Main Business and Markets Served
7.26.5 Perfect Welding Technology Co., Ltd. Recent Developments/Updates
7.27 Western Metal Materials Co., Ltd.
7.27.1 Western Metal Materials Co., Ltd. Clad Metal Company Information
7.27.2 Western Metal Materials Co., Ltd. Clad Metal Product Portfolio
7.27.3 Western Metal Materials Co., Ltd. Clad Metal Production, Value, Price, and Gross Margin (2021–2026)
7.27.4 Western Metal Materials Co., Ltd. Main Business and Markets Served
7.27.5 Western Metal Materials Co., Ltd. Recent Developments/Updates
7.28 Baoti Metal Composite Materials Co., Ltd.
7.28.1 Baoti Metal Composite Materials Co., Ltd. Clad Metal Company Information
7.28.2 Baoti Metal Composite Materials Co., Ltd. Clad Metal Product Portfolio
7.28.3 Baoti Metal Composite Materials Co., Ltd. Clad Metal Production, Value, Price, and Gross Margin (2021–2026)
7.28.4 Baoti Metal Composite Materials Co., Ltd. Main Business and Markets Served
7.28.5 Baoti Metal Composite Materials Co., Ltd. Recent Developments/Updates
7.29 Nanjing Baotai Special Materials Co., Ltd.
7.29.1 Nanjing Baotai Special Materials Co., Ltd. Clad Metal Company Information
7.29.2 Nanjing Baotai Special Materials Co., Ltd. Clad Metal Product Portfolio
7.29.3 Nanjing Baotai Special Materials Co., Ltd. Clad Metal Production, Value, Price, and Gross Margin (2021–2026)
7.29.4 Nanjing Baotai Special Materials Co., Ltd. Main Business and Markets Served
7.29.5 Nanjing Baotai Special Materials Co., Ltd. Recent Developments/Updates
7.30 Yinbang Clad Material Co., Ltd.
7.30.1 Yinbang Clad Material Co., Ltd. Clad Metal Company Information
7.30.2 Yinbang Clad Material Co., Ltd. Clad Metal Product Portfolio
7.30.3 Yinbang Clad Material Co., Ltd. Clad Metal Production, Value, Price, and Gross Margin (2021–2026)
7.30.4 Yinbang Clad Material Co., Ltd. Main Business and Markets Served
7.30.5 Yinbang Clad Material Co., Ltd. Recent Developments/Updates
7.31 Gallianz (Anhui) New Materials Co., Ltd.
7.31.1 Gallianz (Anhui) New Materials Co., Ltd. Clad Metal Company Information
7.31.2 Gallianz (Anhui) New Materials Co., Ltd. Clad Metal Product Portfolio
7.31.3 Gallianz (Anhui) New Materials Co., Ltd. Clad Metal Production, Value, Price, and Gross Margin (2021–2026)
7.31.4 Gallianz (Anhui) New Materials Co., Ltd. Main Business and Markets Served
7.31.5 Gallianz (Anhui) New Materials Co., Ltd. Recent Developments/Updates
7.32 Hunan Phohom New Material Technology Co., Ltd.
7.32.1 Hunan Phohom New Material Technology Co., Ltd. Clad Metal Company Information
7.32.2 Hunan Phohom New Material Technology Co., Ltd. Clad Metal Product Portfolio
7.32.3 Hunan Phohom New Material Technology Co., Ltd. Clad Metal Production, Value, Price, and Gross Margin (2021–2026)
7.32.4 Hunan Phohom New Material Technology Co., Ltd. Main Business and Markets Served
7.32.5 Hunan Phohom New Material Technology Co., Ltd. Recent Developments/Updates
7.33 Baoji Titanium Cheng Metal Composite Materials Co., Ltd.
7.33.1 Baoji Titanium Cheng Metal Composite Materials Co., Ltd. Clad Metal Company Information
7.33.2 Baoji Titanium Cheng Metal Composite Materials Co., Ltd. Clad Metal Product Portfolio
7.33.3 Baoji Titanium Cheng Metal Composite Materials Co., Ltd. Clad Metal Production, Value, Price, and Gross Margin (2021–2026)
7.33.4 Baoji Titanium Cheng Metal Composite Materials Co., Ltd. Main Business and Markets Served
7.33.5 Baoji Titanium Cheng Metal Composite Materials Co., Ltd. Recent Developments/Updates
7.34 Wuxi Tianrui Metal Products Co., Ltd.
7.34.1 Wuxi Tianrui Metal Products Co., Ltd. Clad Metal Company Information
7.34.2 Wuxi Tianrui Metal Products Co., Ltd. Clad Metal Product Portfolio
7.34.3 Wuxi Tianrui Metal Products Co., Ltd. Clad Metal Production, Value, Price, and Gross Margin (2021–2026)
7.34.4 Wuxi Tianrui Metal Products Co., Ltd. Main Business and Markets Served
7.34.5 Wuxi Tianrui Metal Products Co., Ltd. Recent Developments/Updates
7.35 Dalian Shipbuilding Industry Co., Ltd.
7.35.1 Dalian Shipbuilding Industry Co., Ltd. Clad Metal Company Information
7.35.2 Dalian Shipbuilding Industry Co., Ltd. Clad Metal Product Portfolio
7.35.3 Dalian Shipbuilding Industry Co., Ltd. Clad Metal Production, Value, Price, and Gross Margin (2021–2026)
7.35.4 Dalian Shipbuilding Industry Co., Ltd. Main Business and Markets Served
7.35.5 Dalian Shipbuilding Industry Co., Ltd. Recent Developments/Updates
7.36 Shanghai Metal Corporation
7.36.1 Shanghai Metal Corporation Clad Metal Company Information
7.36.2 Shanghai Metal Corporation Clad Metal Product Portfolio
7.36.3 Shanghai Metal Corporation Clad Metal Production, Value, Price, and Gross Margin (2021–2026)
7.36.4 Shanghai Metal Corporation Main Business and Markets Served
7.36.5 Shanghai Metal Corporation Recent Developments/Updates
8 Industry Chain and Sales Channels Analysis
8.1 Clad Metal Industry Chain Analysis
8.2 Clad Metal Raw Material Supply Analysis
8.2.1 Key Raw Materials
8.2.2 Raw Materials Key Suppliers
8.3 Clad Metal Production Modes and Processes
8.4 Clad Metal Sales and Marketing
8.4.1 Clad Metal Sales Channels
8.4.2 Clad Metal Distributors
8.5 Clad Metal Customer Analysis
9 Clad Metal Market Dynamics
9.1 Clad Metal Industry Trends
9.2 Clad Metal Market Drivers
9.3 Clad Metal Market Challenges
9.4 Clad Metal Market Restraints
9.5 Impact of U.S. Tariffs
10 Research Findings and Conclusion
11 Methodology and Data Source
11.1 Methodology/Research Approach
11.1.1 Research Programs/Design
11.1.2 Market Size Estimation
11.1.3 Market Breakdown and Data Triangulation
11.2 Data Source
11.2.1 Secondary Sources
11.2.2 Primary Sources
11.3 Author List
11.4 Disclaimer
List of Tables
 Table 1. Global Clad Metal Market Value by Type (US$ Million), 2025 vs 2032
 Table 2. Global Clad Metal Market Value by Bonding Process (US$ Million), 2025 vs 2032
 Table 3. Global Clad Metal Market Value by Product Form (US$ Million), 2025 vs 2032
 Table 4. Global Clad Metal Market Value by Application (US$ Million), 2025 vs 2032
 Table 5. Global Clad Metal Production Capacity (Kilotons) by Manufacturers in 2025
 Table 6. Global Clad Metal Production by Manufacturers (Kilotons), 2021–2026
 Table 7. Global Clad Metal Production Market Share by Manufacturers (2021–2026)
 Table 8. Global Clad Metal Production Value by Manufacturers (US$ Million), 2021–2026
 Table 9. Global Clad Metal Production Value Share by Manufacturers (2021–2026)
 Table 10. Global Key Players of Clad Metal, Industry Ranking, 2024 vs 2025
 Table 11. Classification of Companies by Tier (Tier 1, Tier 2, Tier 3), based on Clad Metal Production Value, 2025
 Table 12. Global Market Clad Metal Average Price by Manufacturers (US$/Ton), 2021–2026
 Table 13. Global Key Manufacturers of Clad Metal, Manufacturing Footprints and Headquarters
 Table 14. Global Key Manufacturers of Clad Metal, Product Offerings and Applications
 Table 15. Global Key Manufacturers of Clad Metal, Date of Entry into the Industry
 Table 16. Global Clad Metal Manufacturers Market Concentration Ratio (CR5 and HHI)
 Table 17. Mergers & Acquisitions and Expansion Plans
 Table 18. Global Clad Metal Production Value by Region: 2021 vs 2025 vs 2032 (US$ Million)
 Table 19. Global Clad Metal Production Value (US$ Million) by Region (2021–2026)
 Table 20. Global Clad Metal Production Value Market Share by Region (2021–2026)
 Table 21. Global Clad Metal Production Value (US$ Million) Forecast by Region (2027–2032)
 Table 22. Global Clad Metal Production Value Market Share Forecast by Region (2027–2032)
 Table 23. Global Clad Metal Production Comparison by Region: 2021 vs 2025 vs 2032 (Kilotons)
 Table 24. Global Clad Metal Production (Kilotons) by Region (2021–2026)
 Table 25. Global Clad Metal Production Market Share by Region (2021–2026)
 Table 26. Global Clad Metal Production (Kilotons) Forecast by Region (2027–2032)
 Table 27. Global Clad Metal Production Market Share Forecast by Region (2027–2032)
 Table 28. Global Clad Metal Market Average Price (US$/Ton) by Region (2021–2026)
 Table 29. Global Clad Metal Market Average Price (US$/Ton) by Region (2027–2032)
 Table 30. Global Clad Metal Consumption Growth Rate by Region: 2021 vs 2025 vs 2032 (Kilotons)
 Table 31. Global Clad Metal Consumption by Region (Kilotons), 2021–2026
 Table 32. Global Clad Metal Consumption Market Share by Region (2021–2026)
 Table 33. Global Clad Metal Forecasted Consumption by Region (Kilotons), 2027–2032
 Table 34. Global Clad Metal Forecasted Consumption Market Share by Region (2027–2032)
 Table 35. North America Clad Metal Consumption Growth Rate by Country: 2021 vs 2025 vs 2032 (Kilotons)
 Table 36. North America Clad Metal Consumption by Country (Kilotons), 2021–2026
 Table 37. North America Clad Metal Consumption by Country (Kilotons), 2027–2032
 Table 38. Europe Clad Metal Consumption Growth Rate by Country: 2021 vs 2025 vs 2032 (Kilotons)
 Table 39. Europe Clad Metal Consumption by Country (Kilotons), 2021–2026
 Table 40. Europe Clad Metal Consumption by Country (Kilotons), 2027–2032
 Table 41. Asia Pacific Clad Metal Consumption Growth Rate by Region: 2021 vs 2025 vs 2032 (Kilotons)
 Table 42. Asia Pacific Clad Metal Consumption by Region (Kilotons), 2021–2026
 Table 43. Asia Pacific Clad Metal Consumption by Region (Kilotons), 2027–2032
 Table 44. Latin America, Middle East & Africa Clad Metal Consumption Growth Rate by Country: 2021 vs 2025 vs 2032 (Kilotons)
 Table 45. Latin America, Middle East & Africa Clad Metal Consumption by Country (Kilotons), 2021–2026
 Table 46. Latin America, Middle East & Africa Clad Metal Consumption by Country (Kilotons), 2027–2032
 Table 47. Global Clad Metal Production (Kilotons) by Type (2021–2026)
 Table 48. Global Clad Metal Production (Kilotons) by Type (2027–2032)
 Table 49. Global Clad Metal Production Market Share by Type (2021–2026)
 Table 50. Global Clad Metal Production Market Share by Type (2027–2032)
 Table 51. Global Clad Metal Production Value (US$ Million) by Type (2021–2026)
 Table 52. Global Clad Metal Production Value (US$ Million) by Type (2027–2032)
 Table 53. Global Clad Metal Production Value Market Share by Type (2021–2026)
 Table 54. Global Clad Metal Production Value Market Share by Type (2027–2032)
 Table 55. Global Clad Metal Price (US$/Ton) by Type (2021–2026)
 Table 56. Global Clad Metal Price (US$/Ton) by Type (2027–2032)
 Table 57. Global Clad Metal Production (Kilotons) by Application (2021–2026)
 Table 58. Global Clad Metal Production (Kilotons) by Application (2027–2032)
 Table 59. Global Clad Metal Production Market Share by Application (2021–2026)
 Table 60. Global Clad Metal Production Market Share by Application (2027–2032)
 Table 61. Global Clad Metal Production Value (US$ Million) by Application (2021–2026)
 Table 62. Global Clad Metal Production Value (US$ Million) by Application (2027–2032)
 Table 63. Global Clad Metal Production Value Market Share by Application (2021–2026)
 Table 64. Global Clad Metal Production Value Market Share by Application (2027–2032)
 Table 65. Global Clad Metal Price (US$/Ton) by Application (2021–2026)
 Table 66. Global Clad Metal Price (US$/Ton) by Application (2027–2032)
 Table 67. DMC Global Inc. Clad Metal Company Information
 Table 68. DMC Global Inc. Clad Metal Specification and Application
 Table 69. DMC Global Inc. Clad Metal Production (Kilotons), Value (US$ Million), Price (US$/Ton) and Gross Margin (2021–2026)
 Table 70. DMC Global Inc. Main Business and Markets Served
 Table 71. DMC Global Inc. Recent Developments/Updates
 Table 72. Materion Corporation Clad Metal Company Information
 Table 73. Materion Corporation Clad Metal Specification and Application
 Table 74. Materion Corporation Clad Metal Production (Kilotons), Value (US$ Million), Price (US$/Ton) and Gross Margin (2021–2026)
 Table 75. Materion Corporation Main Business and Markets Served
 Table 76. Materion Corporation Recent Developments/Updates
 Table 77. Wickeder Group Clad Metal Company Information
 Table 78. Wickeder Group Clad Metal Specification and Application
 Table 79. Wickeder Group Clad Metal Production (Kilotons), Value (US$ Million), Price (US$/Ton) and Gross Margin (2021–2026)
 Table 80. Wickeder Group Main Business and Markets Served
 Table 81. Wickeder Group Recent Developments/Updates
 Table 82. AMETEK Specialty Metal Products Clad Metal Company Information
 Table 83. AMETEK Specialty Metal Products Clad Metal Specification and Application
 Table 84. AMETEK Specialty Metal Products Clad Metal Production (Kilotons), Value (US$ Million), Price (US$/Ton) and Gross Margin (2021–2026)
 Table 85. AMETEK Specialty Metal Products Main Business and Markets Served
 Table 86. AMETEK Specialty Metal Products Recent Developments/Updates
 Table 87. Clad Metal Specialties, Inc. Clad Metal Company Information
 Table 88. Clad Metal Specialties, Inc. Clad Metal Specification and Application
 Table 89. Clad Metal Specialties, Inc. Clad Metal Production (Kilotons), Value (US$ Million), Price (US$/Ton) and Gross Margin (2021–2026)
 Table 90. Clad Metal Specialties, Inc. Main Business and Markets Served
 Table 91. Clad Metal Specialties, Inc. Recent Developments/Updates
 Table 92. High Energy Metals, Inc. Clad Metal Company Information
 Table 93. High Energy Metals, Inc. Clad Metal Specification and Application
 Table 94. High Energy Metals, Inc. Clad Metal Production (Kilotons), Value (US$ Million), Price (US$/Ton) and Gross Margin (2021–2026)
 Table 95. High Energy Metals, Inc. Main Business and Markets Served
 Table 96. High Energy Metals, Inc. Recent Developments/Updates
 Table 97. Nippon Steel Corporation Clad Metal Company Information
 Table 98. Nippon Steel Corporation Clad Metal Specification and Application
 Table 99. Nippon Steel Corporation Clad Metal Production (Kilotons), Value (US$ Million), Price (US$/Ton) and Gross Margin (2021–2026)
 Table 100. Nippon Steel Corporation Main Business and Markets Served
 Table 101. Nippon Steel Corporation Recent Developments/Updates
 Table 102. JFE Steel Corporation Clad Metal Company Information
 Table 103. JFE Steel Corporation Clad Metal Specification and Application
 Table 104. JFE Steel Corporation Clad Metal Production (Kilotons), Value (US$ Million), Price (US$/Ton) and Gross Margin (2021–2026)
 Table 105. JFE Steel Corporation Main Business and Markets Served
 Table 106. JFE Steel Corporation Recent Developments/Updates
 Table 107. Proterial, Ltd. Clad Metal Company Information
 Table 108. Proterial, Ltd. Clad Metal Specification and Application
 Table 109. Proterial, Ltd. Clad Metal Production (Kilotons), Value (US$ Million), Price (US$/Ton) and Gross Margin (2021–2026)
 Table 110. Proterial, Ltd. Main Business and Markets Served
 Table 111. Proterial, Ltd. Recent Developments/Updates
 Table 112. Toyo Kohan Co., Ltd. Clad Metal Company Information
 Table 113. Toyo Kohan Co., Ltd. Clad Metal Specification and Application
 Table 114. Toyo Kohan Co., Ltd. Clad Metal Production (Kilotons), Value (US$ Million), Price (US$/Ton) and Gross Margin (2021–2026)
 Table 115. Toyo Kohan Co., Ltd. Main Business and Markets Served
 Table 116. Toyo Kohan Co., Ltd. Recent Developments/Updates
 Table 117. TAKEFU SPECIAL STEEL CO., LTD. Clad Metal Company Information
 Table 118. TAKEFU SPECIAL STEEL CO., LTD. Clad Metal Specification and Application
 Table 119. TAKEFU SPECIAL STEEL CO., LTD. Clad Metal Production (Kilotons), Value (US$ Million), Price (US$/Ton) and Gross Margin (2021–2026)
 Table 120. TAKEFU SPECIAL STEEL CO., LTD. Main Business and Markets Served
 Table 121. TAKEFU SPECIAL STEEL CO., LTD. Recent Developments/Updates
 Table 122. voestalpine Stahl GmbH Clad Metal Company Information
 Table 123. voestalpine Stahl GmbH Clad Metal Specification and Application
 Table 124. voestalpine Stahl GmbH Clad Metal Production (Kilotons), Value (US$ Million), Price (US$/Ton) and Gross Margin (2021–2026)
 Table 125. voestalpine Stahl GmbH Main Business and Markets Served
 Table 126. voestalpine Stahl GmbH Recent Developments/Updates
 Table 127. ArcelorMittal Industeel Clad Metal Company Information
 Table 128. ArcelorMittal Industeel Clad Metal Specification and Application
 Table 129. ArcelorMittal Industeel Clad Metal Production (Kilotons), Value (US$ Million), Price (US$/Ton) and Gross Margin (2021–2026)
 Table 130. ArcelorMittal Industeel Main Business and Markets Served
 Table 131. ArcelorMittal Industeel Recent Developments/Updates
 Table 132. Aperam S.A. Clad Metal Company Information
 Table 133. Aperam S.A. Clad Metal Specification and Application
 Table 134. Aperam S.A. Clad Metal Production (Kilotons), Value (US$ Million), Price (US$/Ton) and Gross Margin (2021–2026)
 Table 135. Aperam S.A. Main Business and Markets Served
 Table 136. Aperam S.A. Recent Developments/Updates
 Table 137. BUTTING Group Clad Metal Company Information
 Table 138. BUTTING Group Clad Metal Specification and Application
 Table 139. BUTTING Group Clad Metal Production (Kilotons), Value (US$ Million), Price (US$/Ton) and Gross Margin (2021–2026)
 Table 140. BUTTING Group Main Business and Markets Served
 Table 141. BUTTING Group Recent Developments/Updates
 Table 142. EEW Group Clad Metal Company Information
 Table 143. EEW Group Clad Metal Specification and Application
 Table 144. EEW Group Clad Metal Production (Kilotons), Value (US$ Million), Price (US$/Ton) and Gross Margin (2021–2026)
 Table 145. EEW Group Main Business and Markets Served
 Table 146. EEW Group Recent Developments/Updates
 Table 147. Cladtek Clad Metal Company Information
 Table 148. Cladtek Clad Metal Specification and Application
 Table 149. Cladtek Clad Metal Production (Kilotons), Value (US$ Million), Price (US$/Ton) and Gross Margin (2021–2026)
 Table 150. Cladtek Main Business and Markets Served
 Table 151. Cladtek Recent Developments/Updates
 Table 152. Proclad Group Clad Metal Company Information
 Table 153. Proclad Group Clad Metal Specification and Application
 Table 154. Proclad Group Clad Metal Production (Kilotons), Value (US$ Million), Price (US$/Ton) and Gross Margin (2021–2026)
 Table 155. Proclad Group Main Business and Markets Served
 Table 156. Proclad Group Recent Developments/Updates
 Table 157. Shivalik Bimetal Controls Limited Clad Metal Company Information
 Table 158. Shivalik Bimetal Controls Limited Clad Metal Specification and Application
 Table 159. Shivalik Bimetal Controls Limited Clad Metal Production (Kilotons), Value (US$ Million), Price (US$/Ton) and Gross Margin (2021–2026)
 Table 160. Shivalik Bimetal Controls Limited Main Business and Markets Served
 Table 161. Shivalik Bimetal Controls Limited Recent Developments/Updates
 Table 162. Imploclad Clad Metal Company Information
 Table 163. Imploclad Clad Metal Specification and Application
 Table 164. Imploclad Clad Metal Production (Kilotons), Value (US$ Million), Price (US$/Ton) and Gross Margin (2021–2026)
 Table 165. Imploclad Main Business and Markets Served
 Table 166. Imploclad Recent Developments/Updates
 Table 167. Telcon Bimetals Clad Metal Company Information
 Table 168. Telcon Bimetals Clad Metal Specification and Application
 Table 169. Telcon Bimetals Clad Metal Production (Kilotons), Value (US$ Million), Price (US$/Ton) and Gross Margin (2021–2026)
 Table 170. Telcon Bimetals Main Business and Markets Served
 Table 171. Telcon Bimetals Recent Developments/Updates
 Table 172. DKC International Clad Metal Company Information
 Table 173. DKC International Clad Metal Specification and Application
 Table 174. DKC International Clad Metal Production (Kilotons), Value (US$ Million), Price (US$/Ton) and Gross Margin (2021–2026)
 Table 175. DKC International Main Business and Markets Served
 Table 176. DKC International Recent Developments/Updates
 Table 177. Dongkuk Steel Mill Co., Ltd. Clad Metal Company Information
 Table 178. Dongkuk Steel Mill Co., Ltd. Clad Metal Specification and Application
 Table 179. Dongkuk Steel Mill Co., Ltd. Clad Metal Production (Kilotons), Value (US$ Million), Price (US$/Ton) and Gross Margin (2021–2026)
 Table 180. Dongkuk Steel Mill Co., Ltd. Main Business and Markets Served
 Table 181. Dongkuk Steel Mill Co., Ltd. Recent Developments/Updates
 Table 182. DAE HWA METAL CO., LTD. Clad Metal Company Information
 Table 183. DAE HWA METAL CO., LTD. Clad Metal Specification and Application
 Table 184. DAE HWA METAL CO., LTD. Clad Metal Production (Kilotons), Value (US$ Million), Price (US$/Ton) and Gross Margin (2021–2026)
 Table 185. DAE HWA METAL CO., LTD. Main Business and Markets Served
 Table 186. DAE HWA METAL CO., LTD. Recent Developments/Updates
 Table 187. Korea Clad Tech Co., Ltd. Clad Metal Company Information
 Table 188. Korea Clad Tech Co., Ltd. Clad Metal Specification and Application
 Table 189. Korea Clad Tech Co., Ltd. Clad Metal Production (Kilotons), Value (US$ Million), Price (US$/Ton) and Gross Margin (2021–2026)
 Table 190. Korea Clad Tech Co., Ltd. Main Business and Markets Served
 Table 191. Korea Clad Tech Co., Ltd. Recent Developments/Updates
 Table 192. Perfect Welding Technology Co., Ltd. Clad Metal Company Information
 Table 193. Perfect Welding Technology Co., Ltd. Clad Metal Specification and Application
 Table 194. Perfect Welding Technology Co., Ltd. Clad Metal Production (Kilotons), Value (US$ Million), Price (US$/Ton) and Gross Margin (2021–2026)
 Table 195. Perfect Welding Technology Co., Ltd. Main Business and Markets Served
 Table 196. Perfect Welding Technology Co., Ltd. Recent Developments/Updates
 Table 197. Western Metal Materials Co., Ltd. Clad Metal Company Information
 Table 198. Western Metal Materials Co., Ltd. Clad Metal Specification and Application
 Table 199. Western Metal Materials Co., Ltd. Clad Metal Production (Kilotons), Value (US$ Million), Price (US$/Ton) and Gross Margin (2021–2026)
 Table 200. Western Metal Materials Co., Ltd. Main Business and Markets Served
 Table 201. Western Metal Materials Co., Ltd. Recent Developments/Updates
 Table 202. Baoti Metal Composite Materials Co., Ltd. Clad Metal Company Information
 Table 203. Baoti Metal Composite Materials Co., Ltd. Clad Metal Specification and Application
 Table 204. Baoti Metal Composite Materials Co., Ltd. Clad Metal Production (Kilotons), Value (US$ Million), Price (US$/Ton) and Gross Margin (2021–2026)
 Table 205. Baoti Metal Composite Materials Co., Ltd. Main Business and Markets Served
 Table 206. Baoti Metal Composite Materials Co., Ltd. Recent Developments/Updates
 Table 207. Nanjing Baotai Special Materials Co., Ltd. Clad Metal Company Information
 Table 208. Nanjing Baotai Special Materials Co., Ltd. Clad Metal Specification and Application
 Table 209. Nanjing Baotai Special Materials Co., Ltd. Clad Metal Production (Kilotons), Value (US$ Million), Price (US$/Ton) and Gross Margin (2021–2026)
 Table 210. Nanjing Baotai Special Materials Co., Ltd. Main Business and Markets Served
 Table 211. Nanjing Baotai Special Materials Co., Ltd. Recent Developments/Updates
 Table 212. Yinbang Clad Material Co., Ltd. Clad Metal Company Information
 Table 213. Yinbang Clad Material Co., Ltd. Clad Metal Specification and Application
 Table 214. Yinbang Clad Material Co., Ltd. Clad Metal Production (Kilotons), Value (US$ Million), Price (US$/Ton) and Gross Margin (2021–2026)
 Table 215. Yinbang Clad Material Co., Ltd. Main Business and Markets Served
 Table 216. Yinbang Clad Material Co., Ltd. Recent Developments/Updates
 Table 217. Gallianz (Anhui) New Materials Co., Ltd. Clad Metal Company Information
 Table 218. Gallianz (Anhui) New Materials Co., Ltd. Clad Metal Specification and Application
 Table 219. Gallianz (Anhui) New Materials Co., Ltd. Clad Metal Production (Kilotons), Value (US$ Million), Price (US$/Ton) and Gross Margin (2021–2026)
 Table 220. Gallianz (Anhui) New Materials Co., Ltd. Main Business and Markets Served
 Table 221. Gallianz (Anhui) New Materials Co., Ltd. Recent Developments/Updates
 Table 222. Hunan Phohom New Material Technology Co., Ltd. Clad Metal Company Information
 Table 223. Hunan Phohom New Material Technology Co., Ltd. Clad Metal Specification and Application
 Table 224. Hunan Phohom New Material Technology Co., Ltd. Clad Metal Production (Kilotons), Value (US$ Million), Price (US$/Ton) and Gross Margin (2021–2026)
 Table 225. Hunan Phohom New Material Technology Co., Ltd. Main Business and Markets Served
 Table 226. Hunan Phohom New Material Technology Co., Ltd. Recent Developments/Updates
 Table 227. Baoji Titanium Cheng Metal Composite Materials Co., Ltd. Clad Metal Company Information
 Table 228. Baoji Titanium Cheng Metal Composite Materials Co., Ltd. Clad Metal Specification and Application
 Table 229. Baoji Titanium Cheng Metal Composite Materials Co., Ltd. Clad Metal Production (Kilotons), Value (US$ Million), Price (US$/Ton) and Gross Margin (2021–2026)
 Table 230. Baoji Titanium Cheng Metal Composite Materials Co., Ltd. Main Business and Markets Served
 Table 231. Baoji Titanium Cheng Metal Composite Materials Co., Ltd. Recent Developments/Updates
 Table 232. Wuxi Tianrui Metal Products Co., Ltd. Clad Metal Company Information
 Table 233. Wuxi Tianrui Metal Products Co., Ltd. Clad Metal Specification and Application
 Table 234. Wuxi Tianrui Metal Products Co., Ltd. Clad Metal Production (Kilotons), Value (US$ Million), Price (US$/Ton) and Gross Margin (2021–2026)
 Table 235. Wuxi Tianrui Metal Products Co., Ltd. Main Business and Markets Served
 Table 236. Wuxi Tianrui Metal Products Co., Ltd. Recent Developments/Updates
 Table 237. Dalian Shipbuilding Industry Co., Ltd. Clad Metal Company Information
 Table 238. Dalian Shipbuilding Industry Co., Ltd. Clad Metal Specification and Application
 Table 239. Dalian Shipbuilding Industry Co., Ltd. Clad Metal Production (Kilotons), Value (US$ Million), Price (US$/Ton) and Gross Margin (2021–2026)
 Table 240. Dalian Shipbuilding Industry Co., Ltd. Main Business and Markets Served
 Table 241. Dalian Shipbuilding Industry Co., Ltd. Recent Developments/Updates
 Table 242. Shanghai Metal Corporation Clad Metal Company Information
 Table 243. Shanghai Metal Corporation Clad Metal Specification and Application
 Table 244. Shanghai Metal Corporation Clad Metal Production (Kilotons), Value (US$ Million), Price (US$/Ton) and Gross Margin (2021–2026)
 Table 245. Shanghai Metal Corporation Main Business and Markets Served
 Table 246. Shanghai Metal Corporation Recent Developments/Updates
 Table 247. Key Raw Materials Lists
 Table 248. Raw Materials Key Suppliers Lists
 Table 249. Clad Metal Distributors List
 Table 250. Clad Metal Customers List
 Table 251. Clad Metal Market Trends
 Table 252. Clad Metal Market Drivers
 Table 253. Clad Metal Market Challenges
 Table 254. Clad Metal Market Restraints
 Table 255. Research Programs/Design for This Report
 Table 256. Key Data Information from Secondary Sources
 Table 257. Key Data Information from Primary Sources
 Table 258. Authors List of This Report


List of Figures
 Figure 1. Product Picture of Clad Metal
 Figure 2. Global Clad Metal Market Value by Type (US$ Million), 2021–2032
 Figure 3. Global Clad Metal Market Share by Type: 2025 vs 2032
 Figure 4. Stainless Steel/Carbon Steel Clad Product Picture
 Figure 5. Titanium/Steel Clad Product Picture
 Figure 6. Zirconium/Steel Clad Product Picture
 Figure 7. Nickel Alloy/Steel Clad Product Picture
 Figure 8. Copper/Aluminum Clad Product Picture
 Figure 9. Aluminum/Steel Clad Product Picture
 Figure 10. Silver/Copper Clad Product Picture
 Figure 11. Copper/Steel Clad Product Picture
 Figure 12. Other Product Picture
 Figure 13. Global Clad Metal Market Value by Bonding Process (US$ Million), 2021–2032
 Figure 14. Global Clad Metal Market Share by Bonding Process: 2025 vs 2032
 Figure 15. Roll Bonding Product Picture
 Figure 16. Explosion Bonding Product Picture
 Figure 17. Diffusion Bonding Product Picture
 Figure 18. Brazing Cladding Product Picture
 Figure 19. Weld Overlay Cladding Product Picture
 Figure 20. Mechanical Lining Product Picture
 Figure 21. Electron Beam Welding Product Picture
 Figure 22. Other Bonding Processes Product Picture
 Figure 23. Global Clad Metal Market Value by Product Form (US$ Million), 2021–2032
 Figure 24. Global Clad Metal Market Share by Product Form: 2025 vs 2032
 Figure 25. Sheets Product Picture
 Figure 26. Strips Product Picture
 Figure 27. Foils Product Picture
 Figure 28. Pipes Product Picture
 Figure 29. Wires Product Picture
 Figure 30. Others Product Picture
 Figure 31. Global Clad Metal Market Value by Application (US$ Million), 2021–2032
 Figure 32. Global Clad Metal Market Share by Application: 2025 vs 2032
 Figure 33. Energy and Oil & Gas
 Figure 34. Chemical Processing
 Figure 35. Marine and Offshore
 Figure 36. Automotive and EV
 Figure 37. Electronics and Electrical
 Figure 38. Aerospace and Defense
 Figure 39. Medical Devices
 Figure 40. Others
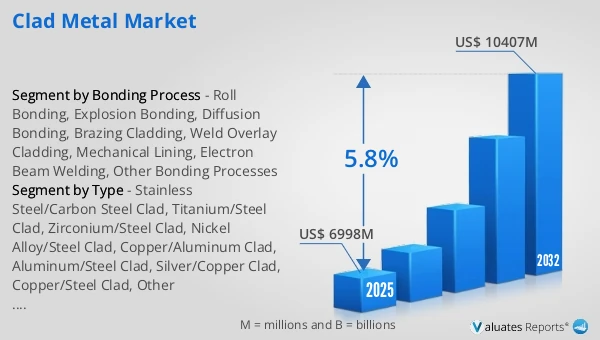
 Figure 41. Global Clad Metal Production Value (US$ Million), 2021 vs 2025 vs 2032
 Figure 42. Global Clad Metal Production Value (US$ Million), 2021–2032
 Figure 43. Global Clad Metal Production Capacity (Kilotons), 2021–2032
 Figure 44. Global Clad Metal Production (Kilotons), 2021–2032
 Figure 45. Global Clad Metal Average Price (US$/Ton), 2021–2032
 Figure 46. Clad Metal Report Years Considered
 Figure 47. Clad Metal Production Share by Manufacturers in 2025
 Figure 48. Global Clad Metal Production Value Share by Manufacturers (2025)
 Figure 49. Clad Metal Market Share by Company Type (Tier 1, Tier 2, and Tier 3): 2021 vs 2025
 Figure 50. Top 5 and Top 10 Global Players: Market Share by Clad Metal Revenue in 2025
 Figure 51. Global Clad Metal Production Value by Region: 2021 vs 2025 vs 2032 (US$ Million)
 Figure 52. Global Clad Metal Production Value Market Share by Region: 2021 vs 2025 vs 2032
 Figure 53. Global Clad Metal Production Comparison by Region: 2021 vs 2025 vs 2032 (Kilotons)
 Figure 54. Global Clad Metal Production Market Share by Region: 2021 vs 2025 vs 2032
 Figure 55. North America Clad Metal Production Value (US$ Million) Growth Rate (2021–2032)
 Figure 56. Europe Clad Metal Production Value (US$ Million) Growth Rate (2021–2032)
 Figure 57. China Clad Metal Production Value (US$ Million) Growth Rate (2021–2032)
 Figure 58. Japan Clad Metal Production Value (US$ Million) Growth Rate (2021–2032)
 Figure 59. India Clad Metal Production Value (US$ Million) Growth Rate (2021–2032)
 Figure 60. Southeast Asia Clad Metal Production Value (US$ Million) Growth Rate (2021–2032)
 Figure 61. Global Clad Metal Consumption by Region: 2021 vs 2025 vs 2032 (Kilotons)
 Figure 62. Global Clad Metal Consumption Market Share by Region: 2021 vs 2025 vs 2032
 Figure 63. North America Clad Metal Consumption and Growth Rate (Kilotons), 2021–2032
 Figure 64. North America Clad Metal Consumption Market Share by Country (2021–2032)
 Figure 65. U.S. Clad Metal Consumption and Growth Rate (Kilotons), 2021–2032
 Figure 66. Canada Clad Metal Consumption and Growth Rate (Kilotons), 2021–2032
 Figure 67. Europe Clad Metal Consumption and Growth Rate (Kilotons), 2021–2032
 Figure 68. Europe Clad Metal Consumption Market Share by Country (2021–2032)
 Figure 69. Germany Clad Metal Consumption and Growth Rate (Kilotons), 2021–2032
 Figure 70. France Clad Metal Consumption and Growth Rate (Kilotons), 2021–2032
 Figure 71. U.K. Clad Metal Consumption and Growth Rate (Kilotons), 2021–2032
 Figure 72. Italy Clad Metal Consumption and Growth Rate (Kilotons), 2021–2032
 Figure 73. Russia Clad Metal Consumption and Growth Rate (Kilotons), 2021–2032
 Figure 74. Asia Pacific Clad Metal Consumption and Growth Rate (Kilotons), 2021–2032
 Figure 75. Asia Pacific Clad Metal Consumption Market Share by Region (2021–2032)
 Figure 76. China Clad Metal Consumption and Growth Rate (Kilotons), 2021–2032
 Figure 77. Japan Clad Metal Consumption and Growth Rate (Kilotons), 2021–2032
 Figure 78. South Korea Clad Metal Consumption and Growth Rate (Kilotons), 2021–2032
 Figure 79. China Taiwan Clad Metal Consumption and Growth Rate (Kilotons), 2021–2032
 Figure 80. Southeast Asia Clad Metal Consumption and Growth Rate (Kilotons), 2021–2032
 Figure 81. India Clad Metal Consumption and Growth Rate (Kilotons), 2021–2032
 Figure 82. Latin America, Middle East & Africa Clad Metal Consumption and Growth Rate (Kilotons), 2021–2032
 Figure 83. Latin America, Middle East & Africa Clad Metal Consumption Market Share by Country (2021–2032)
 Figure 84. Mexico Clad Metal Consumption and Growth Rate (Kilotons), 2021–2032
 Figure 85. Brazil Clad Metal Consumption and Growth Rate (Kilotons), 2021–2032
 Figure 86. Turkey Clad Metal Consumption and Growth Rate (Kilotons), 2021–2032
 Figure 87. GCC Countries Clad Metal Consumption and Growth Rate (Kilotons), 2021–2032
 Figure 88. Global Production Market Share of Clad Metal by Type (2021–2032)
 Figure 89. Global Production Value Market Share of Clad Metal by Type (2021–2032)
 Figure 90. Global Clad Metal Price (US$/Ton) by Type (2021–2032)
 Figure 91. Global Production Market Share of Clad Metal by Application (2021–2032)
 Figure 92. Global Production Value Market Share of Clad Metal by Application (2021–2032)
 Figure 93. Global Clad Metal Price (US$/Ton) by Application (2021–2032)
 Figure 94. Clad Metal Value Chain
 Figure 95. Channels of Distribution (Direct Vs Distribution)
 Figure 96. Bottom-up and Top-down Approaches for This Report
 Figure 97. Data Triangulation
SELECT A FORMAT
Added to Cart
Electronic

$2900

Single User License
Electronic

$4350

Multi User License
Electronic

$5800

Enterprise License
Add to Cart
Buy Now (15% Discount)

OUR CUSTOMER

SecuX Technology Inc

SIMILAR REPORTS