List of Tables
Table 1. Global IoT eSIM Solution Market Size Growth Rate by Type (US$ Million): 2020 VS 2024 VS 2031
Table 2. Key Players of Consumer IoT Solution
Table 3. Key Players of Industrial IoT Solution
Table 4. Global IoT eSIM Solution Market Size Growth Rate by Technical Architecture (US$ Million): 2020 VS 2024 VS 2031
Table 5. Key Players of SaaS Platform Model
Table 6. Key Players of API Integration Model
Table 7. Key Players of Hybrid Model
Table 8. Global IoT eSIM Solution Market Size Growth Rate by Connection Strategy (US$ Million): 2020 VS 2024 VS 2031
Table 9. Key Players of Single-MNO Solution
Table 10. Key Players of Multi-MNO Solution
Table 11. Global IoT eSIM Solution Market Size Growth by Application (US$ Million): 2020 VS 2024 VS 2031
Table 12. Global IoT eSIM Solution Market Size by Region (US$ Million): 2020 VS 2024 VS 2031
Table 13. Global IoT eSIM Solution Market Size by Region (2020-2025) & (US$ Million)
Table 14. Global IoT eSIM Solution Market Share by Region (2020-2025)
Table 15. Global IoT eSIM Solution Forecasted Market Size by Region (2026-2031) & (US$ Million)
Table 16. Global IoT eSIM Solution Market Share by Region (2026-2031)
Table 17. IoT eSIM Solution Market Trends
Table 18. IoT eSIM Solution Market Drivers
Table 19. IoT eSIM Solution Market Challenges
Table 20. IoT eSIM Solution Market Restraints
Table 21. Global IoT eSIM Solution Revenue by Players (2020-2025) & (US$ Million)
Table 22. Global IoT eSIM Solution Market Share by Players (2020-2025)
Table 23. Global Top IoT eSIM Solution Players by Company Type (Tier 1, Tier 2, and Tier 3) & (based on the Revenue in IoT eSIM Solution as of 2024)
Table 24. Ranking of Global Top IoT eSIM Solution Companies by Revenue (US$ Million) in 2024
Table 25. Global 5 Largest Players Market Share by IoT eSIM Solution Revenue (CR5 and HHI) & (2020-2025)
Table 26. Global Key Players of IoT eSIM Solution, Headquarters and Area Served
Table 27. Global Key Players of IoT eSIM Solution, Product and Application
Table 28. Global Key Players of IoT eSIM Solution, Date of Enter into This Industry
Table 29. Mergers & Acquisitions, Expansion Plans
Table 30. Global IoT eSIM Solution Market Size by Type (2020-2025) & (US$ Million)
Table 31. Global IoT eSIM Solution Revenue Market Share by Type (2020-2025)
Table 32. Global IoT eSIM Solution Forecasted Market Size by Type (2026-2031) & (US$ Million)
Table 33. Global IoT eSIM Solution Revenue Market Share by Type (2026-2031)
Table 34. Global IoT eSIM Solution Market Size by Application (2020-2025) & (US$ Million)
Table 35. Global IoT eSIM Solution Revenue Market Share by Application (2020-2025)
Table 36. Global IoT eSIM Solution Forecasted Market Size by Application (2026-2031) & (US$ Million)
Table 37. Global IoT eSIM Solution Revenue Market Share by Application (2026-2031)
Table 38. North America IoT eSIM Solution Market Size Growth Rate by Country (US$ Million): 2020 VS 2024 VS 2031
Table 39. North America IoT eSIM Solution Market Size by Country (2020-2025) & (US$ Million)
Table 40. North America IoT eSIM Solution Market Size by Country (2026-2031) & (US$ Million)
Table 41. Europe IoT eSIM Solution Market Size Growth Rate by Country (US$ Million): 2020 VS 2024 VS 2031
Table 42. Europe IoT eSIM Solution Market Size by Country (2020-2025) & (US$ Million)
Table 43. Europe IoT eSIM Solution Market Size by Country (2026-2031) & (US$ Million)
Table 44. Asia-Pacific IoT eSIM Solution Market Size Growth Rate by Region (US$ Million): 2020 VS 2024 VS 2031
Table 45. Asia-Pacific IoT eSIM Solution Market Size by Region (2020-2025) & (US$ Million)
Table 46. Asia-Pacific IoT eSIM Solution Market Size by Region (2026-2031) & (US$ Million)
Table 47. Latin America IoT eSIM Solution Market Size Growth Rate by Country (US$ Million): 2020 VS 2024 VS 2031
Table 48. Latin America IoT eSIM Solution Market Size by Country (2020-2025) & (US$ Million)
Table 49. Latin America IoT eSIM Solution Market Size by Country (2026-2031) & (US$ Million)
Table 50. Middle East & Africa IoT eSIM Solution Market Size Growth Rate by Country (US$ Million): 2020 VS 2024 VS 2031
Table 51. Middle East & Africa IoT eSIM Solution Market Size by Country (2020-2025) & (US$ Million)
Table 52. Middle East & Africa IoT eSIM Solution Market Size by Country (2026-2031) & (US$ Million)
Table 53. Valid Company Details
Table 54. Valid Business Overview
Table 55. Valid IoT eSIM Solution Product
Table 56. Valid Revenue in IoT eSIM Solution Business (2020-2025) & (US$ Million)
Table 57. Valid Recent Development
Table 58. Kigen Company Details
Table 59. Kigen Business Overview
Table 60. Kigen IoT eSIM Solution Product
Table 61. Kigen Revenue in IoT eSIM Solution Business (2020-2025) & (US$ Million)
Table 62. Kigen Recent Development
Table 63. Eseye Company Details
Table 64. Eseye Business Overview
Table 65. Eseye IoT eSIM Solution Product
Table 66. Eseye Revenue in IoT eSIM Solution Business (2020-2025) & (US$ Million)
Table 67. Eseye Recent Development
Table 68. BICS Company Details
Table 69. BICS Business Overview
Table 70. BICS IoT eSIM Solution Product
Table 71. BICS Revenue in IoT eSIM Solution Business (2020-2025) & (US$ Million)
Table 72. BICS Recent Development
Table 73. emnify Company Details
Table 74. emnify Business Overview
Table 75. emnify IoT eSIM Solution Product
Table 76. emnify Revenue in IoT eSIM Solution Business (2020-2025) & (US$ Million)
Table 77. emnify Recent Development
Table 78. Thales Group Company Details
Table 79. Thales Group Business Overview
Table 80. Thales Group IoT eSIM Solution Product
Table 81. Thales Group Revenue in IoT eSIM Solution Business (2020-2025) & (US$ Million)
Table 82. Thales Group Recent Development
Table 83. Wireless Logic Company Details
Table 84. Wireless Logic Business Overview
Table 85. Wireless Logic IoT eSIM Solution Product
Table 86. Wireless Logic Revenue in IoT eSIM Solution Business (2020-2025) & (US$ Million)
Table 87. Wireless Logic Recent Development
Table 88. 1GLOBAL Company Details
Table 89. 1GLOBAL Business Overview
Table 90. 1GLOBAL IoT eSIM Solution Product
Table 91. 1GLOBAL Revenue in IoT eSIM Solution Business (2020-2025) & (US$ Million)
Table 92. 1GLOBAL Recent Development
Table 93. Trasna Company Details
Table 94. Trasna Business Overview
Table 95. Trasna IoT eSIM Solution Product
Table 96. Trasna Revenue in IoT eSIM Solution Business (2020-2025) & (US$ Million)
Table 97. Trasna Recent Development
Table 98. STMicroelectronics Company Details
Table 99. STMicroelectronics Business Overview
Table 100. STMicroelectronics IoT eSIM Solution Product
Table 101. STMicroelectronics Revenue in IoT eSIM Solution Business (2020-2025) & (US$ Million)
Table 102. STMicroelectronics Recent Development
Table 103. KORE Wireless Company Details
Table 104. KORE Wireless Business Overview
Table 105. KORE Wireless IoT eSIM Solution Product
Table 106. KORE Wireless Revenue in IoT eSIM Solution Business (2020-2025) & (US$ Million)
Table 107. KORE Wireless Recent Development
Table 108. Telit Cinterion Company Details
Table 109. Telit Cinterion Business Overview
Table 110. Telit Cinterion IoT eSIM Solution Product
Table 111. Telit Cinterion Revenue in IoT eSIM Solution Business (2020-2025) & (US$ Million)
Table 112. Telit Cinterion Recent Development
Table 113. Millbeck Company Details
Table 114. Millbeck Business Overview
Table 115. Millbeck IoT eSIM Solution Product
Table 116. Millbeck Revenue in IoT eSIM Solution Business (2020-2025) & (US$ Million)
Table 117. Millbeck Recent Development
Table 118. POND IoT Company Details
Table 119. POND IoT Business Overview
Table 120. POND IoT IoT eSIM Solution Product
Table 121. POND IoT Revenue in IoT eSIM Solution Business (2020-2025) & (US$ Million)
Table 122. POND IoT Recent Development
Table 123. Truphone Company Details
Table 124. Truphone Business Overview
Table 125. Truphone IoT eSIM Solution Product
Table 126. Truphone Revenue in IoT eSIM Solution Business (2020-2025) & (US$ Million)
Table 127. Truphone Recent Development
Table 128. Teltonika Company Details
Table 129. Teltonika Business Overview
Table 130. Teltonika IoT eSIM Solution Product
Table 131. Teltonika Revenue in IoT eSIM Solution Business (2020-2025) & (US$ Million)
Table 132. Teltonika Recent Development
Table 133. NexCon.io Company Details
Table 134. NexCon.io Business Overview
Table 135. NexCon.io IoT eSIM Solution Product
Table 136. NexCon.io Revenue in IoT eSIM Solution Business (2020-2025) & (US$ Million)
Table 137. NexCon.io Recent Development
Table 138. Research Programs/Design for This Report
Table 139. Key Data Information from Secondary Sources
Table 140. Key Data Information from Primary Sources
Table 141. Authors List of This Report
List of Figures
Figure 1. IoT eSIM Solution Picture
Figure 2. Global IoT eSIM Solution Market Size Comparison by Type (2020-2031) & (US$ Million)
Figure 3. Global IoT eSIM Solution Market Share by Type: 2024 VS 2031
Figure 4. Consumer IoT Solution Features
Figure 5. Industrial IoT Solution Features
Figure 6. Global IoT eSIM Solution Market Size Comparison by Technical Architecture (2020-2031) & (US$ Million)
Figure 7. SaaS Platform Model Features
Figure 8. API Integration Model Features
Figure 9. Hybrid Model Features
Figure 10. Global IoT eSIM Solution Market Size Comparison by Connection Strategy (2020-2031) & (US$ Million)
Figure 11. Single-MNO Solution Features
Figure 12. Multi-MNO Solution Features
Figure 13. Global IoT eSIM Solution Market Size by Application (2020-2031) & (US$ Million)
Figure 14. Global IoT eSIM Solution Market Share by Application: 2024 VS 2031
Figure 15. Automotive & Connected Vehicles Case Studies
Figure 16. Energy & Utilities Case Studies
Figure 17. Manufacturing & Industrial IoT Case Studies
Figure 18. Logistics & Supply Chain Case Studies
Figure 19. Consumer Electronics Case Studies
Figure 20. Others Case Studies
Figure 21. IoT eSIM Solution Report Years Considered
Figure 22. Global IoT eSIM Solution Market Size (US$ Million), Year-over-Year: 2020-2031
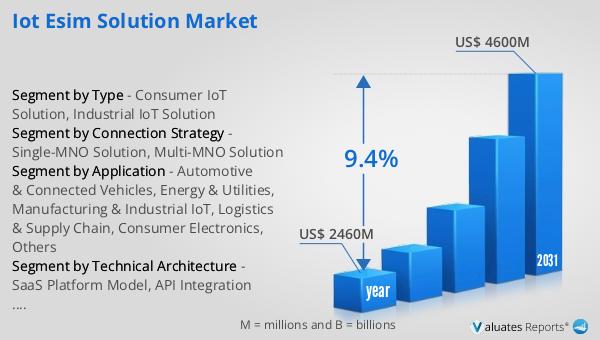
Figure 23. Global IoT eSIM Solution Market Size, (US$ Million), 2020 VS 2024 VS 2031
Figure 24. Global IoT eSIM Solution Market Share by Region: 2024 VS 2031
Figure 25. Global IoT eSIM Solution Market Share by Players in 2024
Figure 26. Global IoT eSIM Solution Market Share by Company Type (Tier 1, Tier 2, and Tier 3)
Figure 27. The Top 10 and 5 Players Market Share by IoT eSIM Solution Revenue in 2024
Figure 28. North America IoT eSIM Solution Market Size YoY Growth (2020-2031) & (US$ Million)
Figure 29. North America IoT eSIM Solution Market Share by Country (2020-2031)
Figure 30. United States IoT eSIM Solution Market Size YoY Growth (2020-2031) & (US$ Million)
Figure 31. Canada IoT eSIM Solution Market Size YoY Growth (2020-2031) & (US$ Million)
Figure 32. Europe IoT eSIM Solution Market Size YoY Growth (2020-2031) & (US$ Million)
Figure 33. Europe IoT eSIM Solution Market Share by Country (2020-2031)
Figure 34. Germany IoT eSIM Solution Market Size YoY Growth (2020-2031) & (US$ Million)
Figure 35. France IoT eSIM Solution Market Size YoY Growth (2020-2031) & (US$ Million)
Figure 36. U.K. IoT eSIM Solution Market Size YoY Growth (2020-2031) & (US$ Million)
Figure 37. Italy IoT eSIM Solution Market Size YoY Growth (2020-2031) & (US$ Million)
Figure 38. Russia IoT eSIM Solution Market Size YoY Growth (2020-2031) & (US$ Million)
Figure 39. Ireland IoT eSIM Solution Market Size YoY Growth (2020-2031) & (US$ Million)
Figure 40. Asia-Pacific IoT eSIM Solution Market Size YoY Growth (2020-2031) & (US$ Million)
Figure 41. Asia-Pacific IoT eSIM Solution Market Share by Region (2020-2031)
Figure 42. China IoT eSIM Solution Market Size YoY Growth (2020-2031) & (US$ Million)
Figure 43. Japan IoT eSIM Solution Market Size YoY Growth (2020-2031) & (US$ Million)
Figure 44. South Korea IoT eSIM Solution Market Size YoY Growth (2020-2031) & (US$ Million)
Figure 45. Southeast Asia IoT eSIM Solution Market Size YoY Growth (2020-2031) & (US$ Million)
Figure 46. India IoT eSIM Solution Market Size YoY Growth (2020-2031) & (US$ Million)
Figure 47. Australia & New Zealand IoT eSIM Solution Market Size YoY Growth (2020-2031) & (US$ Million)
Figure 48. Latin America IoT eSIM Solution Market Size YoY Growth (2020-2031) & (US$ Million)
Figure 49. Latin America IoT eSIM Solution Market Share by Country (2020-2031)
Figure 50. Mexico IoT eSIM Solution Market Size YoY Growth (2020-2031) & (US$ Million)
Figure 51. Brazil IoT eSIM Solution Market Size YoY Growth (2020-2031) & (US$ Million)
Figure 52. Middle East & Africa IoT eSIM Solution Market Size YoY Growth (2020-2031) & (US$ Million)
Figure 53. Middle East & Africa IoT eSIM Solution Market Share by Country (2020-2031)
Figure 54. Israel IoT eSIM Solution Market Size YoY Growth (2020-2031) & (US$ Million)
Figure 55. Saudi Arabia IoT eSIM Solution Market Size YoY Growth (2020-2031) & (US$ Million)
Figure 56. UAE IoT eSIM Solution Market Size YoY Growth (2020-2031) & (US$ Million)
Figure 57. Valid Revenue Growth Rate in IoT eSIM Solution Business (2020-2025)
Figure 58. Kigen Revenue Growth Rate in IoT eSIM Solution Business (2020-2025)
Figure 59. Eseye Revenue Growth Rate in IoT eSIM Solution Business (2020-2025)
Figure 60. BICS Revenue Growth Rate in IoT eSIM Solution Business (2020-2025)
Figure 61. emnify Revenue Growth Rate in IoT eSIM Solution Business (2020-2025)
Figure 62. Thales Group Revenue Growth Rate in IoT eSIM Solution Business (2020-2025)
Figure 63. Wireless Logic Revenue Growth Rate in IoT eSIM Solution Business (2020-2025)
Figure 64. 1GLOBAL Revenue Growth Rate in IoT eSIM Solution Business (2020-2025)
Figure 65. Trasna Revenue Growth Rate in IoT eSIM Solution Business (2020-2025)
Figure 66. STMicroelectronics Revenue Growth Rate in IoT eSIM Solution Business (2020-2025)
Figure 67. KORE Wireless Revenue Growth Rate in IoT eSIM Solution Business (2020-2025)
Figure 68. Telit Cinterion Revenue Growth Rate in IoT eSIM Solution Business (2020-2025)
Figure 69. Millbeck Revenue Growth Rate in IoT eSIM Solution Business (2020-2025)
Figure 70. POND IoT Revenue Growth Rate in IoT eSIM Solution Business (2020-2025)
Figure 71. Truphone Revenue Growth Rate in IoT eSIM Solution Business (2020-2025)
Figure 72. Teltonika Revenue Growth Rate in IoT eSIM Solution Business (2020-2025)
Figure 73. NexCon.io Revenue Growth Rate in IoT eSIM Solution Business (2020-2025)
Figure 74. Bottom-up and Top-down Approaches for This Report
Figure 75. Data Triangulation
Figure 76. Key Executives Interviewed