List of Tables
Table 1. Global Genetically Modified Experimental Animal Model Market Size Growth Rate by Type (US$ Million): 2020 VS 2024 VS 2031
Table 2. Key Players of Genetically Modified Mice
Table 3. Key Players of Genetically Modified Rats
Table 4. Key Players of Genetically Modified Zebrafish
Table 5. Key Players of Others
Table 6. Global Genetically Modified Experimental Animal Model Market Size Growth by Application (US$ Million): 2020 VS 2024 VS 2031
Table 7. Global Genetically Modified Experimental Animal Model Market Size by Region (US$ Million): 2020 VS 2024 VS 2031
Table 8. Global Genetically Modified Experimental Animal Model Market Size by Region (2020-2025) & (US$ Million)
Table 9. Global Genetically Modified Experimental Animal Model Market Share by Region (2020-2025)
Table 10. Global Genetically Modified Experimental Animal Model Forecasted Market Size by Region (2026-2031) & (US$ Million)
Table 11. Global Genetically Modified Experimental Animal Model Market Share by Region (2026-2031)
Table 12. Genetically Modified Experimental Animal Model Market Trends
Table 13. Genetically Modified Experimental Animal Model Market Drivers
Table 14. Genetically Modified Experimental Animal Model Market Challenges
Table 15. Genetically Modified Experimental Animal Model Market Restraints
Table 16. Global Genetically Modified Experimental Animal Model Revenue by Players (2020-2025) & (US$ Million)
Table 17. Global Genetically Modified Experimental Animal Model Market Share by Players (2020-2025)
Table 18. Global Top Genetically Modified Experimental Animal Model Players by Company Type (Tier 1, Tier 2, and Tier 3) & (based on the Revenue in Genetically Modified Experimental Animal Model as of 2024)
Table 19. Ranking of Global Top Genetically Modified Experimental Animal Model Companies by Revenue (US$ Million) in 2024
Table 20. Global 5 Largest Players Market Share by Genetically Modified Experimental Animal Model Revenue (CR5 and HHI) & (2020-2025)
Table 21. Global Key Players of Genetically Modified Experimental Animal Model, Headquarters and Area Served
Table 22. Global Key Players of Genetically Modified Experimental Animal Model, Product and Application
Table 23. Global Key Players of Genetically Modified Experimental Animal Model, Date of Enter into This Industry
Table 24. Mergers & Acquisitions, Expansion Plans
Table 25. Global Genetically Modified Experimental Animal Model Market Size by Type (2020-2025) & (US$ Million)
Table 26. Global Genetically Modified Experimental Animal Model Revenue Market Share by Type (2020-2025)
Table 27. Global Genetically Modified Experimental Animal Model Forecasted Market Size by Type (2026-2031) & (US$ Million)
Table 28. Global Genetically Modified Experimental Animal Model Revenue Market Share by Type (2026-2031)
Table 29. Global Genetically Modified Experimental Animal Model Market Size by Application (2020-2025) & (US$ Million)
Table 30. Global Genetically Modified Experimental Animal Model Revenue Market Share by Application (2020-2025)
Table 31. Global Genetically Modified Experimental Animal Model Forecasted Market Size by Application (2026-2031) & (US$ Million)
Table 32. Global Genetically Modified Experimental Animal Model Revenue Market Share by Application (2026-2031)
Table 33. North America Genetically Modified Experimental Animal Model Market Size Growth Rate by Country (US$ Million): 2020 VS 2024 VS 2031
Table 34. North America Genetically Modified Experimental Animal Model Market Size by Country (2020-2025) & (US$ Million)
Table 35. North America Genetically Modified Experimental Animal Model Market Size by Country (2026-2031) & (US$ Million)
Table 36. Europe Genetically Modified Experimental Animal Model Market Size Growth Rate by Country (US$ Million): 2020 VS 2024 VS 2031
Table 37. Europe Genetically Modified Experimental Animal Model Market Size by Country (2020-2025) & (US$ Million)
Table 38. Europe Genetically Modified Experimental Animal Model Market Size by Country (2026-2031) & (US$ Million)
Table 39. Asia-Pacific Genetically Modified Experimental Animal Model Market Size Growth Rate by Region (US$ Million): 2020 VS 2024 VS 2031
Table 40. Asia-Pacific Genetically Modified Experimental Animal Model Market Size by Region (2020-2025) & (US$ Million)
Table 41. Asia-Pacific Genetically Modified Experimental Animal Model Market Size by Region (2026-2031) & (US$ Million)
Table 42. Latin America Genetically Modified Experimental Animal Model Market Size Growth Rate by Country (US$ Million): 2020 VS 2024 VS 2031
Table 43. Latin America Genetically Modified Experimental Animal Model Market Size by Country (2020-2025) & (US$ Million)
Table 44. Latin America Genetically Modified Experimental Animal Model Market Size by Country (2026-2031) & (US$ Million)
Table 45. Middle East & Africa Genetically Modified Experimental Animal Model Market Size Growth Rate by Country (US$ Million): 2020 VS 2024 VS 2031
Table 46. Middle East & Africa Genetically Modified Experimental Animal Model Market Size by Country (2020-2025) & (US$ Million)
Table 47. Middle East & Africa Genetically Modified Experimental Animal Model Market Size by Country (2026-2031) & (US$ Million)
Table 48. Joinn Laboratories (China) Co., Ltd. Company Details
Table 49. Joinn Laboratories (China) Co., Ltd. Business Overview
Table 50. Joinn Laboratories (China) Co., Ltd. Genetically Modified Experimental Animal Model Product
Table 51. Joinn Laboratories (China) Co., Ltd. Revenue in Genetically Modified Experimental Animal Model Business (2020-2025) & (US$ Million)
Table 52. Joinn Laboratories (China) Co., Ltd. Recent Development
Table 53. Pharmaron Inc. Company Details
Table 54. Pharmaron Inc. Business Overview
Table 55. Pharmaron Inc. Genetically Modified Experimental Animal Model Product
Table 56. Pharmaron Inc. Revenue in Genetically Modified Experimental Animal Model Business (2020-2025) & (US$ Million)
Table 57. Pharmaron Inc. Recent Development
Table 58. Shanghai Model Organisms Center, Inc. Company Details
Table 59. Shanghai Model Organisms Center, Inc. Business Overview
Table 60. Shanghai Model Organisms Center, Inc. Genetically Modified Experimental Animal Model Product
Table 61. Shanghai Model Organisms Center, Inc. Revenue in Genetically Modified Experimental Animal Model Business (2020-2025) & (US$ Million)
Table 62. Shanghai Model Organisms Center, Inc. Recent Development
Table 63. Sichuan Hengshu Bio-Technology Co.,Ltd. Company Details
Table 64. Sichuan Hengshu Bio-Technology Co.,Ltd. Business Overview
Table 65. Sichuan Hengshu Bio-Technology Co.,Ltd. Genetically Modified Experimental Animal Model Product
Table 66. Sichuan Hengshu Bio-Technology Co.,Ltd. Revenue in Genetically Modified Experimental Animal Model Business (2020-2025) & (US$ Million)
Table 67. Sichuan Hengshu Bio-Technology Co.,Ltd. Recent Development
Table 68. China Environmental Technology and Bioenergy Holdings Limited Company Details
Table 69. China Environmental Technology and Bioenergy Holdings Limited Business Overview
Table 70. China Environmental Technology and Bioenergy Holdings Limited Genetically Modified Experimental Animal Model Product
Table 71. China Environmental Technology and Bioenergy Holdings Limited Revenue in Genetically Modified Experimental Animal Model Business (2020-2025) & (US$ Million)
Table 72. China Environmental Technology and Bioenergy Holdings Limited Recent Development
Table 73. GemPharmatech Co., Ltd. Company Details
Table 74. GemPharmatech Co., Ltd. Business Overview
Table 75. GemPharmatech Co., Ltd. Genetically Modified Experimental Animal Model Product
Table 76. GemPharmatech Co., Ltd. Revenue in Genetically Modified Experimental Animal Model Business (2020-2025) & (US$ Million)
Table 77. GemPharmatech Co., Ltd. Recent Development
Table 78. Beijing Vital River Laboratory Animal Technology Co., Ltd. Company Details
Table 79. Beijing Vital River Laboratory Animal Technology Co., Ltd. Business Overview
Table 80. Beijing Vital River Laboratory Animal Technology Co., Ltd. Genetically Modified Experimental Animal Model Product
Table 81. Beijing Vital River Laboratory Animal Technology Co., Ltd. Revenue in Genetically Modified Experimental Animal Model Business (2020-2025) & (US$ Million)
Table 82. Beijing Vital River Laboratory Animal Technology Co., Ltd. Recent Development
Table 83. Biocytogen Pharmaceuticals (Beijing) Co., Ltd. Company Details
Table 84. Biocytogen Pharmaceuticals (Beijing) Co., Ltd. Business Overview
Table 85. Biocytogen Pharmaceuticals (Beijing) Co., Ltd. Genetically Modified Experimental Animal Model Product
Table 86. Biocytogen Pharmaceuticals (Beijing) Co., Ltd. Revenue in Genetically Modified Experimental Animal Model Business (2020-2025) & (US$ Million)
Table 87. Biocytogen Pharmaceuticals (Beijing) Co., Ltd. Recent Development
Table 88. Jackson Laboratory Company Details
Table 89. Jackson Laboratory Business Overview
Table 90. Jackson Laboratory Genetically Modified Experimental Animal Model Product
Table 91. Jackson Laboratory Revenue in Genetically Modified Experimental Animal Model Business (2020-2025) & (US$ Million)
Table 92. Jackson Laboratory Recent Development
Table 93. Hainan Jinlinggang Biotechnology Co., Ltd. Company Details
Table 94. Hainan Jinlinggang Biotechnology Co., Ltd. Business Overview
Table 95. Hainan Jinlinggang Biotechnology Co., Ltd. Genetically Modified Experimental Animal Model Product
Table 96. Hainan Jinlinggang Biotechnology Co., Ltd. Revenue in Genetically Modified Experimental Animal Model Business (2020-2025) & (US$ Million)
Table 97. Hainan Jinlinggang Biotechnology Co., Ltd. Recent Development
Table 98. Guangdong Landau Biotechnology Co. Ltd. Company Details
Table 99. Guangdong Landau Biotechnology Co. Ltd. Business Overview
Table 100. Guangdong Landau Biotechnology Co. Ltd. Genetically Modified Experimental Animal Model Product
Table 101. Guangdong Landau Biotechnology Co. Ltd. Revenue in Genetically Modified Experimental Animal Model Business (2020-2025) & (US$ Million)
Table 102. Guangdong Landau Biotechnology Co. Ltd. Recent Development
Table 103. Hubei Topgene Biotechnology Co., Ltd. Company Details
Table 104. Hubei Topgene Biotechnology Co., Ltd. Business Overview
Table 105. Hubei Topgene Biotechnology Co., Ltd. Genetically Modified Experimental Animal Model Product
Table 106. Hubei Topgene Biotechnology Co., Ltd. Revenue in Genetically Modified Experimental Animal Model Business (2020-2025) & (US$ Million)
Table 107. Hubei Topgene Biotechnology Co., Ltd. Recent Development
Table 108. Envigo Company Details
Table 109. Envigo Business Overview
Table 110. Envigo Genetically Modified Experimental Animal Model Product
Table 111. Envigo Revenue in Genetically Modified Experimental Animal Model Business (2020-2025) & (US$ Million)
Table 112. Envigo Recent Development
Table 113. Shanghai Slack Experimental Animal Co., Ltd. Company Details
Table 114. Shanghai Slack Experimental Animal Co., Ltd. Business Overview
Table 115. Shanghai Slack Experimental Animal Co., Ltd. Genetically Modified Experimental Animal Model Product
Table 116. Shanghai Slack Experimental Animal Co., Ltd. Revenue in Genetically Modified Experimental Animal Model Business (2020-2025) & (US$ Million)
Table 117. Shanghai Slack Experimental Animal Co., Ltd. Recent Development
Table 118. Janvier Labs Company Details
Table 119. Janvier Labs Business Overview
Table 120. Janvier Labs Genetically Modified Experimental Animal Model Product
Table 121. Janvier Labs Revenue in Genetically Modified Experimental Animal Model Business (2020-2025) & (US$ Million)
Table 122. Janvier Labs Recent Development
Table 123. Taconic Biosciences Company Details
Table 124. Taconic Biosciences Business Overview
Table 125. Taconic Biosciences Genetically Modified Experimental Animal Model Product
Table 126. Taconic Biosciences Revenue in Genetically Modified Experimental Animal Model Business (2020-2025) & (US$ Million)
Table 127. Taconic Biosciences Recent Development
Table 128. Charles River Laboratories Company Details
Table 129. Charles River Laboratories Business Overview
Table 130. Charles River Laboratories Genetically Modified Experimental Animal Model Product
Table 131. Charles River Laboratories Revenue in Genetically Modified Experimental Animal Model Business (2020-2025) & (US$ Million)
Table 132. Charles River Laboratories Recent Development
Table 133. Institute Of Beijing Xieerxin Biology Resource Co.ltd Company Details
Table 134. Institute Of Beijing Xieerxin Biology Resource Co.ltd Business Overview
Table 135. Institute Of Beijing Xieerxin Biology Resource Co.ltd Genetically Modified Experimental Animal Model Product
Table 136. Institute Of Beijing Xieerxin Biology Resource Co.ltd Revenue in Genetically Modified Experimental Animal Model Business (2020-2025) & (US$ Million)
Table 137. Institute Of Beijing Xieerxin Biology Resource Co.ltd Recent Development
Table 138. PolyGene Company Details
Table 139. PolyGene Business Overview
Table 140. PolyGene Genetically Modified Experimental Animal Model Product
Table 141. PolyGene Revenue in Genetically Modified Experimental Animal Model Business (2020-2025) & (US$ Million)
Table 142. PolyGene Recent Development
Table 143. Cyagen Biosciences Company Details
Table 144. Cyagen Biosciences Business Overview
Table 145. Cyagen Biosciences Genetically Modified Experimental Animal Model Product
Table 146. Cyagen Biosciences Revenue in Genetically Modified Experimental Animal Model Business (2020-2025) & (US$ Million)
Table 147. Cyagen Biosciences Recent Development
Table 148. Biocytogen Company Details
Table 149. Biocytogen Business Overview
Table 150. Biocytogen Genetically Modified Experimental Animal Model Product
Table 151. Biocytogen Revenue in Genetically Modified Experimental Animal Model Business (2020-2025) & (US$ Million)
Table 152. Biocytogen Recent Development
Table 153. Hera BioLabs Company Details
Table 154. Hera BioLabs Business Overview
Table 155. Hera BioLabs Genetically Modified Experimental Animal Model Product
Table 156. Hera BioLabs Revenue in Genetically Modified Experimental Animal Model Business (2020-2025) & (US$ Million)
Table 157. Hera BioLabs Recent Development
Table 158. Ozgene Company Details
Table 159. Ozgene Business Overview
Table 160. Ozgene Genetically Modified Experimental Animal Model Product
Table 161. Ozgene Revenue in Genetically Modified Experimental Animal Model Business (2020-2025) & (US$ Million)
Table 162. Ozgene Recent Development
Table 163. Research Programs/Design for This Report
Table 164. Key Data Information from Secondary Sources
Table 165. Key Data Information from Primary Sources
Table 166. Authors List of This Report
List of Figures
Figure 1. Genetically Modified Experimental Animal Model Picture
Figure 2. Global Genetically Modified Experimental Animal Model Market Size Comparison by Type (2020-2031) & (US$ Million)
Figure 3. Global Genetically Modified Experimental Animal Model Market Share by Type: 2024 VS 2031
Figure 4. Genetically Modified Mice Features
Figure 5. Genetically Modified Rats Features
Figure 6. Genetically Modified Zebrafish Features
Figure 7. Others Features
Figure 8. Global Genetically Modified Experimental Animal Model Market Size by Application (2020-2031) & (US$ Million)
Figure 9. Global Genetically Modified Experimental Animal Model Market Share by Application: 2024 VS 2031
Figure 10. Pharmaceutical Case Studies
Figure 11. Scientific Research Case Studies
Figure 12. Education Case Studies
Figure 13. Other Case Studies
Figure 14. Genetically Modified Experimental Animal Model Report Years Considered
Figure 15. Global Genetically Modified Experimental Animal Model Market Size (US$ Million), Year-over-Year: 2020-2031
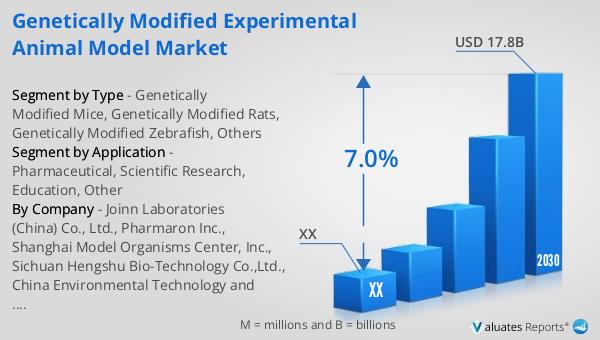
Figure 16. Global Genetically Modified Experimental Animal Model Market Size, (US$ Million), 2020 VS 2024 VS 2031
Figure 17. Global Genetically Modified Experimental Animal Model Market Share by Region: 2024 VS 2031
Figure 18. Global Genetically Modified Experimental Animal Model Market Share by Players in 2024
Figure 19. Global Top Genetically Modified Experimental Animal Model Players by Company Type (Tier 1, Tier 2, and Tier 3) & (based on the Revenue in Genetically Modified Experimental Animal Model as of 2024)
Figure 20. The Top 10 and 5 Players Market Share by Genetically Modified Experimental Animal Model Revenue in 2024
Figure 21. North America Genetically Modified Experimental Animal Model Market Size YoY Growth (2020-2031) & (US$ Million)
Figure 22. North America Genetically Modified Experimental Animal Model Market Share by Country (2020-2031)
Figure 23. United States Genetically Modified Experimental Animal Model Market Size YoY Growth (2020-2031) & (US$ Million)
Figure 24. Canada Genetically Modified Experimental Animal Model Market Size YoY Growth (2020-2031) & (US$ Million)
Figure 25. Europe Genetically Modified Experimental Animal Model Market Size YoY Growth (2020-2031) & (US$ Million)
Figure 26. Europe Genetically Modified Experimental Animal Model Market Share by Country (2020-2031)
Figure 27. Germany Genetically Modified Experimental Animal Model Market Size YoY Growth (2020-2031) & (US$ Million)
Figure 28. France Genetically Modified Experimental Animal Model Market Size YoY Growth (2020-2031) & (US$ Million)
Figure 29. U.K. Genetically Modified Experimental Animal Model Market Size YoY Growth (2020-2031) & (US$ Million)
Figure 30. Italy Genetically Modified Experimental Animal Model Market Size YoY Growth (2020-2031) & (US$ Million)
Figure 31. Russia Genetically Modified Experimental Animal Model Market Size YoY Growth (2020-2031) & (US$ Million)
Figure 32. Nordic Countries Genetically Modified Experimental Animal Model Market Size YoY Growth (2020-2031) & (US$ Million)
Figure 33. Asia-Pacific Genetically Modified Experimental Animal Model Market Size YoY Growth (2020-2031) & (US$ Million)
Figure 34. Asia-Pacific Genetically Modified Experimental Animal Model Market Share by Region (2020-2031)
Figure 35. China Genetically Modified Experimental Animal Model Market Size YoY Growth (2020-2031) & (US$ Million)
Figure 36. Japan Genetically Modified Experimental Animal Model Market Size YoY Growth (2020-2031) & (US$ Million)
Figure 37. South Korea Genetically Modified Experimental Animal Model Market Size YoY Growth (2020-2031) & (US$ Million)
Figure 38. Southeast Asia Genetically Modified Experimental Animal Model Market Size YoY Growth (2020-2031) & (US$ Million)
Figure 39. India Genetically Modified Experimental Animal Model Market Size YoY Growth (2020-2031) & (US$ Million)
Figure 40. Australia Genetically Modified Experimental Animal Model Market Size YoY Growth (2020-2031) & (US$ Million)
Figure 41. Latin America Genetically Modified Experimental Animal Model Market Size YoY Growth (2020-2031) & (US$ Million)
Figure 42. Latin America Genetically Modified Experimental Animal Model Market Share by Country (2020-2031)
Figure 43. Mexico Genetically Modified Experimental Animal Model Market Size YoY Growth (2020-2031) & (US$ Million)
Figure 44. Brazil Genetically Modified Experimental Animal Model Market Size YoY Growth (2020-2031) & (US$ Million)
Figure 45. Middle East & Africa Genetically Modified Experimental Animal Model Market Size YoY Growth (2020-2031) & (US$ Million)
Figure 46. Middle East & Africa Genetically Modified Experimental Animal Model Market Share by Country (2020-2031)
Figure 47. Turkey Genetically Modified Experimental Animal Model Market Size YoY Growth (2020-2031) & (US$ Million)
Figure 48. Saudi Arabia Genetically Modified Experimental Animal Model Market Size YoY Growth (2020-2031) & (US$ Million)
Figure 49. UAE Genetically Modified Experimental Animal Model Market Size YoY Growth (2020-2031) & (US$ Million)
Figure 50. Joinn Laboratories (China) Co., Ltd. Revenue Growth Rate in Genetically Modified Experimental Animal Model Business (2020-2025)
Figure 51. Pharmaron Inc. Revenue Growth Rate in Genetically Modified Experimental Animal Model Business (2020-2025)
Figure 52. Shanghai Model Organisms Center, Inc. Revenue Growth Rate in Genetically Modified Experimental Animal Model Business (2020-2025)
Figure 53. Sichuan Hengshu Bio-Technology Co.,Ltd. Revenue Growth Rate in Genetically Modified Experimental Animal Model Business (2020-2025)
Figure 54. China Environmental Technology and Bioenergy Holdings Limited Revenue Growth Rate in Genetically Modified Experimental Animal Model Business (2020-2025)
Figure 55. GemPharmatech Co., Ltd. Revenue Growth Rate in Genetically Modified Experimental Animal Model Business (2020-2025)
Figure 56. Beijing Vital River Laboratory Animal Technology Co., Ltd. Revenue Growth Rate in Genetically Modified Experimental Animal Model Business (2020-2025)
Figure 57. Biocytogen Pharmaceuticals (Beijing) Co., Ltd. Revenue Growth Rate in Genetically Modified Experimental Animal Model Business (2020-2025)
Figure 58. Jackson Laboratory Revenue Growth Rate in Genetically Modified Experimental Animal Model Business (2020-2025)
Figure 59. Hainan Jinlinggang Biotechnology Co., Ltd. Revenue Growth Rate in Genetically Modified Experimental Animal Model Business (2020-2025)
Figure 60. Guangdong Landau Biotechnology Co. Ltd. Revenue Growth Rate in Genetically Modified Experimental Animal Model Business (2020-2025)
Figure 61. Hubei Topgene Biotechnology Co., Ltd. Revenue Growth Rate in Genetically Modified Experimental Animal Model Business (2020-2025)
Figure 62. Envigo Revenue Growth Rate in Genetically Modified Experimental Animal Model Business (2020-2025)
Figure 63. Shanghai Slack Experimental Animal Co., Ltd. Revenue Growth Rate in Genetically Modified Experimental Animal Model Business (2020-2025)
Figure 64. Janvier Labs Revenue Growth Rate in Genetically Modified Experimental Animal Model Business (2020-2025)
Figure 65. Taconic Biosciences Revenue Growth Rate in Genetically Modified Experimental Animal Model Business (2020-2025)
Figure 66. Charles River Laboratories Revenue Growth Rate in Genetically Modified Experimental Animal Model Business (2020-2025)
Figure 67. Institute Of Beijing Xieerxin Biology Resource Co.ltd Revenue Growth Rate in Genetically Modified Experimental Animal Model Business (2020-2025)
Figure 68. PolyGene Revenue Growth Rate in Genetically Modified Experimental Animal Model Business (2020-2025)
Figure 69. Cyagen Biosciences Revenue Growth Rate in Genetically Modified Experimental Animal Model Business (2020-2025)
Figure 70. Biocytogen Revenue Growth Rate in Genetically Modified Experimental Animal Model Business (2020-2025)
Figure 71. Hera BioLabs Revenue Growth Rate in Genetically Modified Experimental Animal Model Business (2020-2025)
Figure 72. Ozgene Revenue Growth Rate in Genetically Modified Experimental Animal Model Business (2020-2025)
Figure 73. Bottom-up and Top-down Approaches for This Report
Figure 74. Data Triangulation
Figure 75. Key Executives Interviewed