0
U.S. (TOLL FREE)
+1 (315) 215-3225
Automative

0
U.S. (TOLL FREE)
+1 (315) 215-3225
Global Code Quality Tools Market Research Report 2025
Published Date: November 2025
|
Report Code: QYRE-Auto-13Z20191
Home | Market Reports | Computers & Electronics| Enterprise Technology
Global Code Quality Tools Market Research Report 2025
BUY CHAPTERS

Global Code Quality Tools Market Research Report 2025

Code: QYRE-Auto-13Z20191
Report
November 2025
Pages:78
QYResearch
Buy Now with 15% Discount
DESCRIPTION
TABLE OF CONTENT
TABLES & FIGURES

Code Quality Tools Market Size

The global market for Code Quality Tools was valued at US$ 1824 million in the year 2024 and is projected to reach a revised size of US$ 3063 million by 2031, growing at a CAGR of 8.2% during the forecast period.

Code Quality Tools Market

Code Quality Tools Market

Code quality tools are software applications that help developers analyze, assess, and improve the quality, maintainability, and reliability of source code. They provide functionalities such as static code analysis, code metrics evaluation, bug detection, vulnerability scanning, duplication checks, and adherence to coding standards. These tools aim to reduce errors, optimize performance, improve software maintainability, and ensure compliance with industry best practices and security standards. Code quality tools are widely integrated into development environments, CI/CD pipelines, and DevOps workflows, serving individual developers, enterprise software teams, and educational institutions focused on improving software quality and productivity.
Upstream includes AI and algorithm developers, dataset curators, programming language standards organizations, and cloud infrastructure providers supplying analysis engines, code datasets, and computational resources. Midstream consists of software companies producing code quality tools, integrating static/dynamic analysis engines, CI/CD compatibility, dashboards, and reporting features, while ensuring licensing, security, and version control compliance. Downstream includes developers, enterprise software teams, IT consultancies, educational institutions, and open-source project maintainers using these tools to improve software quality, reduce bugs, enforce coding standards, and maintain security. Supporting services involve training, technical support, API integration, and software validation for continuous code quality improvement.
In 2024, leading code quality tool developers are expanding cloud-based platforms and enterprise SaaS offerings to support multi-language code analysis and real-time collaboration. Projects include AI-driven vulnerability detection, automated refactoring, integration with GitHub Actions, GitLab CI/CD, and Jira. New initiatives focus on developer training modules, enhanced dashboards, and low-latency processing for large enterprise repositories. Expansion projects in North America, Europe, and Asia aim to strengthen infrastructure, provide regional support, and increase adoption in fintech, healthcare, and embedded systems industries. Open-source community collaboration programs are also being scaled.
2024 Global Market Average Gross Profit Margin: 48%.
North American market for Code Quality Tools is estimated to increase from $ million in 2024 to reach $ million by 2031, at a CAGR of % during the forecast period of 2025 through 2031.
Asia-Pacific market for Code Quality Tools is estimated to increase from $ million in 2024 to reach $ million by 2031, at a CAGR of % during the forecast period of 2025 through 2031.
The global market for Code Quality Tools in Web and Mobile App Development is estimated to increase from $ million in 2024 to $ million by 2031, at a CAGR of % during the forecast period of 2025 through 2031.
The major global companies of Code Quality Tools include ESLint, SonarQube, ReSharper, PVS-Studio, Checkmarx, SpotBugs, Coverity, etc. In 2024, the world's top three vendors accounted for approximately % of the revenue.
This report aims to provide a comprehensive presentation of the global market for Code Quality Tools, with both quantitative and qualitative analysis, to help readers develop business/growth strategies, assess the market competitive situation, analyze their position in the current marketplace, and make informed business decisions regarding Code Quality Tools.
The Code Quality Tools market size, estimations, and forecasts are provided in terms of and revenue ($ millions), considering 2024 as the base year, with history and forecast data for the period from 2020 to 2031. This report segments the global Code Quality Tools market comprehensively. Regional market sizes, concerning products by Type, by Application, by Integration Type and by players, are also provided.
For a more in-depth understanding of the market, the report provides profiles of the competitive landscape, key competitors, and their respective market ranks. The report also discusses technological trends and new product developments.
The report will help the Code Quality Tools companies, new entrants, and industry chain related companies in this market with information on the revenues for the overall market and the sub-segments across the different segments, by company, by Type, by Application, and by regions.
Market Segmentation

Scope of Code Quality Tools Market Report

Report Metric Details
Report Name Code Quality Tools Market
Accounted market size in year US$ 1824 million
Forecasted market size in 2031 US$ 3063 million
CAGR 8.2%
Base Year year
Forecasted years 2025 - 2031
Segment by Type
  • Static Code Analysis Tools
  • Dynamic Code Analysis Tools
  • Hybrid Analysis Tools
Segment by Integration Type
  • IDE-Integrated Tools
  • Standalone Desktop Applications
  • Cloud-Based SaaS Tools
Segment by Programming Language Support
  • Multi-Language
  • Single-Language
Segment by Functionality
  • Bug Detection and Debugging
  • Code Metrics and Maintainability Assessment
  • Security Vulnerability Scanning
  • Automated Refactoring/Suggestion Tools
Segment by Application
  • Web and Mobile App Development
  • Enterprise Software Engineering
  • Others
By Region
  • North America (United States, Canada)
  • Europe (Germany, France, UK, Italy, Russia) Rest of Europe
  • Nordic Countries
  • Asia-Pacific (China, Japan, South Korea)
  • Southeast Asia (India, Australia)
  • Rest of Asia
  • Latin America (Mexico, Brazil)
  • Rest of Latin America
  • Middle East & Africa (Turkey, Saudi Arabia, UAE, Rest of MEA)
By Company ESLint, SonarQube, ReSharper, PVS-Studio, Checkmarx, SpotBugs, Coverity
Forecast units USD million in value
Report coverage Revenue and volume forecast, company share, competitive landscape, growth factors and trends

Chapter Outline

  • Chapter 1: Introduces the report scope of the report, executive summary of different market segments (by Type, by Application, by Integration Type etc), including the market size of each market segment, future development potential, and so on. It offers a high-level view of the current state of the market and its likely evolution in the short to mid-term, and long term.
  • Chapter 2: Introduces executive summary of global market size, regional market size, this section also introduces the market dynamics, latest developments of the market, the driving factors and restrictive factors of the market, the challenges and risks faced by companies in the industry, and the analysis of relevant policies in the industry.
  • Chapter 3: Detailed analysis of Code Quality Tools company competitive landscape, revenue market share, latest development plan, merger, and acquisition information, etc.
  • Chapter 4: Provides the analysis of various market segments by Type, covering the market size and development potential of each market segment, to help readers find the blue ocean market in different market segments.
  • Chapter 5: Provides the analysis of various market segments by Application, covering the market size and development potential of each market segment, to help readers find the blue ocean market in different downstream markets.
  • Chapter 6, 7, 8, 9, 10: North America, Europe, Asia Pacific, Latin America, Middle East and Africa segment by country. It provides a quantitative analysis of the market size and development potential of each region and its main countries and introduces the market development, future development prospects, market space, and capacity of each country in the world.
  • Chapter 11: Provides profiles of key players, introducing the basic situation of the main companies in the market in detail, including product sales, revenue, price, gross margin, product introduction, recent development, etc.
  • Chapter 12: The main points and conclusions of the report.

FAQ for this report

How fast is Code Quality Tools Market growing?

Ans: The Code Quality Tools Market witnessing a CAGR of 8.2% during the forecast period 2025-2031.

What is the Code Quality Tools Market size in 2031?

Ans: The Code Quality Tools Market size in 2031 will be US$ 3063 million.

Who are the main players in the Code Quality Tools Market report?

Ans: The main players in the Code Quality Tools Market are ESLint, SonarQube, ReSharper, PVS-Studio, Checkmarx, SpotBugs, Coverity

What are the Application segmentation covered in the Code Quality Tools Market report?

Ans: The Applications covered in the Code Quality Tools Market report are Web and Mobile App Development, Enterprise Software Engineering, Others

What are the Type segmentation covered in the Code Quality Tools Market report?

Ans: The Types covered in the Code Quality Tools Market report are IDE-Integrated Tools, Standalone Desktop Applications, Cloud-Based SaaS Tools

1 Report Overview
1.1 Study Scope
1.2 Market Analysis by Type
1.2.1 Global Code Quality Tools Market Size Growth Rate by Type: 2020 VS 2024 VS 2031
1.2.2 Static Code Analysis Tools
1.2.3 Dynamic Code Analysis Tools
1.2.4 Hybrid Analysis Tools
1.3 Market by Integration Type
1.3.1 Global Code Quality Tools Market Size Growth Rate by Integration Type: 2020 VS 2024 VS 2031
1.3.2 IDE-Integrated Tools
1.3.3 Standalone Desktop Applications
1.3.4 Cloud-Based SaaS Tools
1.4 Market by Programming Language Support
1.4.1 Global Code Quality Tools Market Size Growth Rate by Programming Language Support: 2020 VS 2024 VS 2031
1.4.2 Multi-Language
1.4.3 Single-Language
1.5 Market by Functionality
1.5.1 Global Code Quality Tools Market Size Growth Rate by Functionality: 2020 VS 2024 VS 2031
1.5.2 Bug Detection and Debugging
1.5.3 Code Metrics and Maintainability Assessment
1.5.4 Security Vulnerability Scanning
1.5.5 Automated Refactoring/Suggestion Tools
1.6 Market by Application
1.6.1 Global Code Quality Tools Market Growth by Application: 2020 VS 2024 VS 2031
1.6.2 Web and Mobile App Development
1.6.3 Enterprise Software Engineering
1.6.4 Others
1.7 Assumptions and Limitations
1.8 Study Objectives
1.9 Years Considered
2 Global Growth Trends
2.1 Global Code Quality Tools Market Perspective (2020-2031)
2.2 Global Code Quality Tools Growth Trends by Region
2.2.1 Global Code Quality Tools Market Size by Region: 2020 VS 2024 VS 2031
2.2.2 Code Quality Tools Historic Market Size by Region (2020-2025)
2.2.3 Code Quality Tools Forecasted Market Size by Region (2026-2031)
2.3 Code Quality Tools Market Dynamics
2.3.1 Code Quality Tools Industry Trends
2.3.2 Code Quality Tools Market Drivers
2.3.3 Code Quality Tools Market Challenges
2.3.4 Code Quality Tools Market Restraints
3 Competition Landscape by Key Players
3.1 Global Top Code Quality Tools Players by Revenue
3.1.1 Global Top Code Quality Tools Players by Revenue (2020-2025)
3.1.2 Global Code Quality Tools Revenue Market Share by Players (2020-2025)
3.2 Global Top Code Quality Tools Players by Company Type and Market Share by Company Type (Tier 1, Tier 2, and Tier 3)
3.3 Global Key Players Ranking by Code Quality Tools Revenue
3.4 Global Code Quality Tools Market Concentration Ratio
3.4.1 Global Code Quality Tools Market Concentration Ratio (CR5 and HHI)
3.4.2 Global Top 10 and Top 5 Companies by Code Quality Tools Revenue in 2024
3.5 Global Key Players of Code Quality Tools Head office and Area Served
3.6 Global Key Players of Code Quality Tools, Product and Application
3.7 Global Key Players of Code Quality Tools, Date of Enter into This Industry
3.8 Mergers & Acquisitions, Expansion Plans
4 Code Quality Tools Breakdown Data by Type
4.1 Global Code Quality Tools Historic Market Size by Type (2020-2025)
4.2 Global Code Quality Tools Forecasted Market Size by Type (2026-2031)
5 Code Quality Tools Breakdown Data by Application
5.1 Global Code Quality Tools Historic Market Size by Application (2020-2025)
5.2 Global Code Quality Tools Forecasted Market Size by Application (2026-2031)
6 North America
6.1 North America Code Quality Tools Market Size (2020-2031)
6.2 North America Code Quality Tools Market Growth Rate by Country: 2020 VS 2024 VS 2031
6.3 North America Code Quality Tools Market Size by Country (2020-2025)
6.4 North America Code Quality Tools Market Size by Country (2026-2031)
6.5 United States
6.6 Canada
7 Europe
7.1 Europe Code Quality Tools Market Size (2020-2031)
7.2 Europe Code Quality Tools Market Growth Rate by Country: 2020 VS 2024 VS 2031
7.3 Europe Code Quality Tools Market Size by Country (2020-2025)
7.4 Europe Code Quality Tools Market Size by Country (2026-2031)
7.5 Germany
7.6 France
7.7 U.K.
7.8 Italy
7.9 Russia
7.10 Ireland
8 Asia-Pacific
8.1 Asia-Pacific Code Quality Tools Market Size (2020-2031)
8.2 Asia-Pacific Code Quality Tools Market Growth Rate by Region: 2020 VS 2024 VS 2031
8.3 Asia-Pacific Code Quality Tools Market Size by Region (2020-2025)
8.4 Asia-Pacific Code Quality Tools Market Size by Region (2026-2031)
8.5 China
8.6 Japan
8.7 South Korea
8.8 Southeast Asia
8.9 India
8.10 Australia & New Zealand
9 Latin America
9.1 Latin America Code Quality Tools Market Size (2020-2031)
9.2 Latin America Code Quality Tools Market Growth Rate by Country: 2020 VS 2024 VS 2031
9.3 Latin America Code Quality Tools Market Size by Country (2020-2025)
9.4 Latin America Code Quality Tools Market Size by Country (2026-2031)
9.5 Mexico
9.6 Brazil
10 Middle East & Africa
10.1 Middle East & Africa Code Quality Tools Market Size (2020-2031)
10.2 Middle East & Africa Code Quality Tools Market Growth Rate by Country: 2020 VS 2024 VS 2031
10.3 Middle East & Africa Code Quality Tools Market Size by Country (2020-2025)
10.4 Middle East & Africa Code Quality Tools Market Size by Country (2026-2031)
10.5 Israel
10.6 Saudi Arabia
10.7 UAE
11 Key Players Profiles
11.1 ESLint
11.1.1 ESLint Company Details
11.1.2 ESLint Business Overview
11.1.3 ESLint Code Quality Tools Introduction
11.1.4 ESLint Revenue in Code Quality Tools Business (2020-2025)
11.1.5 ESLint Recent Development
11.2 SonarQube
11.2.1 SonarQube Company Details
11.2.2 SonarQube Business Overview
11.2.3 SonarQube Code Quality Tools Introduction
11.2.4 SonarQube Revenue in Code Quality Tools Business (2020-2025)
11.2.5 SonarQube Recent Development
11.3 ReSharper
11.3.1 ReSharper Company Details
11.3.2 ReSharper Business Overview
11.3.3 ReSharper Code Quality Tools Introduction
11.3.4 ReSharper Revenue in Code Quality Tools Business (2020-2025)
11.3.5 ReSharper Recent Development
11.4 PVS-Studio
11.4.1 PVS-Studio Company Details
11.4.2 PVS-Studio Business Overview
11.4.3 PVS-Studio Code Quality Tools Introduction
11.4.4 PVS-Studio Revenue in Code Quality Tools Business (2020-2025)
11.4.5 PVS-Studio Recent Development
11.5 Checkmarx
11.5.1 Checkmarx Company Details
11.5.2 Checkmarx Business Overview
11.5.3 Checkmarx Code Quality Tools Introduction
11.5.4 Checkmarx Revenue in Code Quality Tools Business (2020-2025)
11.5.5 Checkmarx Recent Development
11.6 SpotBugs
11.6.1 SpotBugs Company Details
11.6.2 SpotBugs Business Overview
11.6.3 SpotBugs Code Quality Tools Introduction
11.6.4 SpotBugs Revenue in Code Quality Tools Business (2020-2025)
11.6.5 SpotBugs Recent Development
11.7 Coverity
11.7.1 Coverity Company Details
11.7.2 Coverity Business Overview
11.7.3 Coverity Code Quality Tools Introduction
11.7.4 Coverity Revenue in Code Quality Tools Business (2020-2025)
11.7.5 Coverity Recent Development
12 Analyst's Viewpoints/Conclusions
13 Appendix
13.1 Research Methodology
13.1.1 Methodology/Research Approach
13.1.1.1 Research Programs/Design
13.1.1.2 Market Size Estimation
13.1.1.3 Market Breakdown and Data Triangulation
13.1.2 Data Source
13.1.2.1 Secondary Sources
13.1.2.2 Primary Sources
13.2 Author Details
13.3 Disclaimer
List of Tables
 Table 1. Global Code Quality Tools Market Size Growth Rate by Type (US$ Million): 2020 VS 2024 VS 2031
 Table 2. Key Players of Static Code Analysis Tools
 Table 3. Key Players of Dynamic Code Analysis Tools
 Table 4. Key Players of Hybrid Analysis Tools
 Table 5. Global Code Quality Tools Market Size Growth Rate by Integration Type (US$ Million): 2020 VS 2024 VS 2031
 Table 6. Key Players of IDE-Integrated Tools
 Table 7. Key Players of Standalone Desktop Applications
 Table 8. Key Players of Cloud-Based SaaS Tools
 Table 9. Global Code Quality Tools Market Size Growth Rate by Programming Language Support (US$ Million): 2020 VS 2024 VS 2031
 Table 10. Key Players of Multi-Language
 Table 11. Key Players of Single-Language
 Table 12. Global Code Quality Tools Market Size Growth Rate by Functionality (US$ Million): 2020 VS 2024 VS 2031
 Table 13. Key Players of Bug Detection and Debugging
 Table 14. Key Players of Code Metrics and Maintainability Assessment
 Table 15. Key Players of Security Vulnerability Scanning
 Table 16. Key Players of Automated Refactoring/Suggestion Tools
 Table 17. Global Code Quality Tools Market Size Growth by Application (US$ Million): 2020 VS 2024 VS 2031
 Table 18. Global Code Quality Tools Market Size by Region (US$ Million): 2020 VS 2024 VS 2031
 Table 19. Global Code Quality Tools Market Size by Region (2020-2025) & (US$ Million)
 Table 20. Global Code Quality Tools Market Share by Region (2020-2025)
 Table 21. Global Code Quality Tools Forecasted Market Size by Region (2026-2031) & (US$ Million)
 Table 22. Global Code Quality Tools Market Share by Region (2026-2031)
 Table 23. Code Quality Tools Market Trends
 Table 24. Code Quality Tools Market Drivers
 Table 25. Code Quality Tools Market Challenges
 Table 26. Code Quality Tools Market Restraints
 Table 27. Global Code Quality Tools Revenue by Players (2020-2025) & (US$ Million)
 Table 28. Global Code Quality Tools Market Share by Players (2020-2025)
 Table 29. Global Top Code Quality Tools Players by Company Type (Tier 1, Tier 2, and Tier 3) & (based on the Revenue in Code Quality Tools as of 2024)
 Table 30. Ranking of Global Top Code Quality Tools Companies by Revenue (US$ Million) in 2024
 Table 31. Global 5 Largest Players Market Share by Code Quality Tools Revenue (CR5 and HHI) & (2020-2025)
 Table 32. Global Key Players of Code Quality Tools, Headquarters and Area Served
 Table 33. Global Key Players of Code Quality Tools, Product and Application
 Table 34. Global Key Players of Code Quality Tools, Date of Enter into This Industry
 Table 35. Mergers & Acquisitions, Expansion Plans
 Table 36. Global Code Quality Tools Market Size by Type (2020-2025) & (US$ Million)
 Table 37. Global Code Quality Tools Revenue Market Share by Type (2020-2025)
 Table 38. Global Code Quality Tools Forecasted Market Size by Type (2026-2031) & (US$ Million)
 Table 39. Global Code Quality Tools Revenue Market Share by Type (2026-2031)
 Table 40. Global Code Quality Tools Market Size by Application (2020-2025) & (US$ Million)
 Table 41. Global Code Quality Tools Revenue Market Share by Application (2020-2025)
 Table 42. Global Code Quality Tools Forecasted Market Size by Application (2026-2031) & (US$ Million)
 Table 43. Global Code Quality Tools Revenue Market Share by Application (2026-2031)
 Table 44. North America Code Quality Tools Market Size Growth Rate by Country (US$ Million): 2020 VS 2024 VS 2031
 Table 45. North America Code Quality Tools Market Size by Country (2020-2025) & (US$ Million)
 Table 46. North America Code Quality Tools Market Size by Country (2026-2031) & (US$ Million)
 Table 47. Europe Code Quality Tools Market Size Growth Rate by Country (US$ Million): 2020 VS 2024 VS 2031
 Table 48. Europe Code Quality Tools Market Size by Country (2020-2025) & (US$ Million)
 Table 49. Europe Code Quality Tools Market Size by Country (2026-2031) & (US$ Million)
 Table 50. Asia-Pacific Code Quality Tools Market Size Growth Rate by Region (US$ Million): 2020 VS 2024 VS 2031
 Table 51. Asia-Pacific Code Quality Tools Market Size by Region (2020-2025) & (US$ Million)
 Table 52. Asia-Pacific Code Quality Tools Market Size by Region (2026-2031) & (US$ Million)
 Table 53. Latin America Code Quality Tools Market Size Growth Rate by Country (US$ Million): 2020 VS 2024 VS 2031
 Table 54. Latin America Code Quality Tools Market Size by Country (2020-2025) & (US$ Million)
 Table 55. Latin America Code Quality Tools Market Size by Country (2026-2031) & (US$ Million)
 Table 56. Middle East & Africa Code Quality Tools Market Size Growth Rate by Country (US$ Million): 2020 VS 2024 VS 2031
 Table 57. Middle East & Africa Code Quality Tools Market Size by Country (2020-2025) & (US$ Million)
 Table 58. Middle East & Africa Code Quality Tools Market Size by Country (2026-2031) & (US$ Million)
 Table 59. ESLint Company Details
 Table 60. ESLint Business Overview
 Table 61. ESLint Code Quality Tools Product
 Table 62. ESLint Revenue in Code Quality Tools Business (2020-2025) & (US$ Million)
 Table 63. ESLint Recent Development
 Table 64. SonarQube Company Details
 Table 65. SonarQube Business Overview
 Table 66. SonarQube Code Quality Tools Product
 Table 67. SonarQube Revenue in Code Quality Tools Business (2020-2025) & (US$ Million)
 Table 68. SonarQube Recent Development
 Table 69. ReSharper Company Details
 Table 70. ReSharper Business Overview
 Table 71. ReSharper Code Quality Tools Product
 Table 72. ReSharper Revenue in Code Quality Tools Business (2020-2025) & (US$ Million)
 Table 73. ReSharper Recent Development
 Table 74. PVS-Studio Company Details
 Table 75. PVS-Studio Business Overview
 Table 76. PVS-Studio Code Quality Tools Product
 Table 77. PVS-Studio Revenue in Code Quality Tools Business (2020-2025) & (US$ Million)
 Table 78. PVS-Studio Recent Development
 Table 79. Checkmarx Company Details
 Table 80. Checkmarx Business Overview
 Table 81. Checkmarx Code Quality Tools Product
 Table 82. Checkmarx Revenue in Code Quality Tools Business (2020-2025) & (US$ Million)
 Table 83. Checkmarx Recent Development
 Table 84. SpotBugs Company Details
 Table 85. SpotBugs Business Overview
 Table 86. SpotBugs Code Quality Tools Product
 Table 87. SpotBugs Revenue in Code Quality Tools Business (2020-2025) & (US$ Million)
 Table 88. SpotBugs Recent Development
 Table 89. Coverity Company Details
 Table 90. Coverity Business Overview
 Table 91. Coverity Code Quality Tools Product
 Table 92. Coverity Revenue in Code Quality Tools Business (2020-2025) & (US$ Million)
 Table 93. Coverity Recent Development
 Table 94. Research Programs/Design for This Report
 Table 95. Key Data Information from Secondary Sources
 Table 96. Key Data Information from Primary Sources
 Table 97. Authors List of This Report


List of Figures
 Figure 1. Code Quality Tools Picture
 Figure 2. Global Code Quality Tools Market Size Comparison by Type (2020-2031) & (US$ Million)
 Figure 3. Global Code Quality Tools Market Share by Type: 2024 VS 2031
 Figure 4. Static Code Analysis Tools Features
 Figure 5. Dynamic Code Analysis Tools Features
 Figure 6. Hybrid Analysis Tools Features
 Figure 7. Global Code Quality Tools Market Size Comparison by Integration Type (2020-2031) & (US$ Million)
 Figure 8. IDE-Integrated Tools Features
 Figure 9. Standalone Desktop Applications Features
 Figure 10. Cloud-Based SaaS Tools Features
 Figure 11. Global Code Quality Tools Market Size Comparison by Programming Language Support (2020-2031) & (US$ Million)
 Figure 12. Multi-Language Features
 Figure 13. Single-Language Features
 Figure 14. Global Code Quality Tools Market Size Comparison by Functionality (2020-2031) & (US$ Million)
 Figure 15. Bug Detection and Debugging Features
 Figure 16. Code Metrics and Maintainability Assessment Features
 Figure 17. Security Vulnerability Scanning Features
 Figure 18. Automated Refactoring/Suggestion Tools Features
 Figure 19. Global Code Quality Tools Market Size by Application (2020-2031) & (US$ Million)
 Figure 20. Global Code Quality Tools Market Share by Application: 2024 VS 2031
 Figure 21. Web and Mobile App Development Case Studies
 Figure 22. Enterprise Software Engineering Case Studies
 Figure 23. Others Case Studies
 Figure 24. Code Quality Tools Report Years Considered
 Figure 25. Global Code Quality Tools Market Size (US$ Million), Year-over-Year: 2020-2031
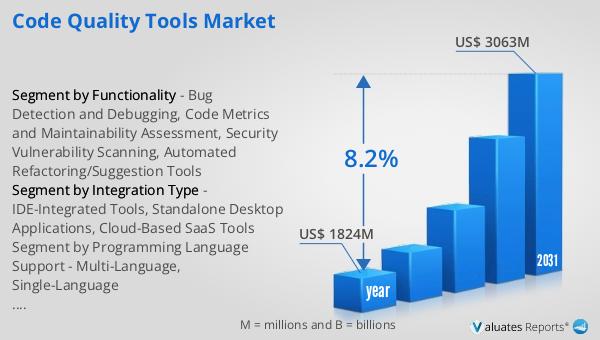
 Figure 26. Global Code Quality Tools Market Size, (US$ Million), 2020 VS 2024 VS 2031
 Figure 27. Global Code Quality Tools Market Share by Region: 2024 VS 2031
 Figure 28. Global Code Quality Tools Market Share by Players in 2024
 Figure 29. Global Code Quality Tools Market Share by Company Type (Tier 1, Tier 2, and Tier 3)
 Figure 30. The Top 10 and 5 Players Market Share by Code Quality Tools Revenue in 2024
 Figure 31. North America Code Quality Tools Market Size YoY Growth (2020-2031) & (US$ Million)
 Figure 32. North America Code Quality Tools Market Share by Country (2020-2031)
 Figure 33. United States Code Quality Tools Market Size YoY Growth (2020-2031) & (US$ Million)
 Figure 34. Canada Code Quality Tools Market Size YoY Growth (2020-2031) & (US$ Million)
 Figure 35. Europe Code Quality Tools Market Size YoY Growth (2020-2031) & (US$ Million)
 Figure 36. Europe Code Quality Tools Market Share by Country (2020-2031)
 Figure 37. Germany Code Quality Tools Market Size YoY Growth (2020-2031) & (US$ Million)
 Figure 38. France Code Quality Tools Market Size YoY Growth (2020-2031) & (US$ Million)
 Figure 39. U.K. Code Quality Tools Market Size YoY Growth (2020-2031) & (US$ Million)
 Figure 40. Italy Code Quality Tools Market Size YoY Growth (2020-2031) & (US$ Million)
 Figure 41. Russia Code Quality Tools Market Size YoY Growth (2020-2031) & (US$ Million)
 Figure 42. Ireland Code Quality Tools Market Size YoY Growth (2020-2031) & (US$ Million)
 Figure 43. Asia-Pacific Code Quality Tools Market Size YoY Growth (2020-2031) & (US$ Million)
 Figure 44. Asia-Pacific Code Quality Tools Market Share by Region (2020-2031)
 Figure 45. China Code Quality Tools Market Size YoY Growth (2020-2031) & (US$ Million)
 Figure 46. Japan Code Quality Tools Market Size YoY Growth (2020-2031) & (US$ Million)
 Figure 47. South Korea Code Quality Tools Market Size YoY Growth (2020-2031) & (US$ Million)
 Figure 48. Southeast Asia Code Quality Tools Market Size YoY Growth (2020-2031) & (US$ Million)
 Figure 49. India Code Quality Tools Market Size YoY Growth (2020-2031) & (US$ Million)
 Figure 50. Australia & New Zealand Code Quality Tools Market Size YoY Growth (2020-2031) & (US$ Million)
 Figure 51. Latin America Code Quality Tools Market Size YoY Growth (2020-2031) & (US$ Million)
 Figure 52. Latin America Code Quality Tools Market Share by Country (2020-2031)
 Figure 53. Mexico Code Quality Tools Market Size YoY Growth (2020-2031) & (US$ Million)
 Figure 54. Brazil Code Quality Tools Market Size YoY Growth (2020-2031) & (US$ Million)
 Figure 55. Middle East & Africa Code Quality Tools Market Size YoY Growth (2020-2031) & (US$ Million)
 Figure 56. Middle East & Africa Code Quality Tools Market Share by Country (2020-2031)
 Figure 57. Israel Code Quality Tools Market Size YoY Growth (2020-2031) & (US$ Million)
 Figure 58. Saudi Arabia Code Quality Tools Market Size YoY Growth (2020-2031) & (US$ Million)
 Figure 59. UAE Code Quality Tools Market Size YoY Growth (2020-2031) & (US$ Million)
 Figure 60. ESLint Revenue Growth Rate in Code Quality Tools Business (2020-2025)
 Figure 61. SonarQube Revenue Growth Rate in Code Quality Tools Business (2020-2025)
 Figure 62. ReSharper Revenue Growth Rate in Code Quality Tools Business (2020-2025)
 Figure 63. PVS-Studio Revenue Growth Rate in Code Quality Tools Business (2020-2025)
 Figure 64. Checkmarx Revenue Growth Rate in Code Quality Tools Business (2020-2025)
 Figure 65. SpotBugs Revenue Growth Rate in Code Quality Tools Business (2020-2025)
 Figure 66. Coverity Revenue Growth Rate in Code Quality Tools Business (2020-2025)
 Figure 67. Bottom-up and Top-down Approaches for This Report
 Figure 68. Data Triangulation
 Figure 69. Key Executives Interviewed
SELECT A FORMAT
Added to Cart
Electronic (PDF)

$2900

This license allows only one user to access the PDF.
Electronic (PDF)

$4350

This license allows 1 - 5 user to access the PDF, license is suitable for small groups of 5 users working together
Electronic (PDF)

$5800

This license allows users/teams in a same Enterprise to use this report, various departments within an enterpise can use this report
Add to Cart
Buy Now (15% Discount)

OUR CUSTOMER

Leap India

SIMILAR REPORTS