
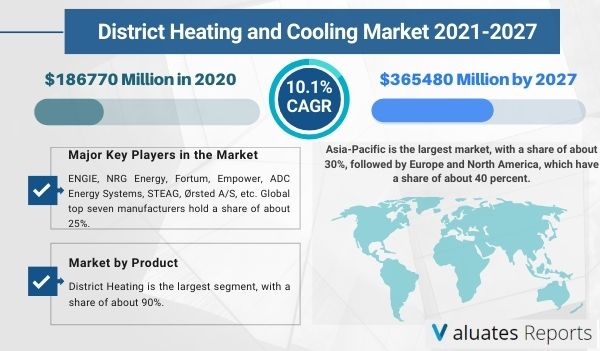
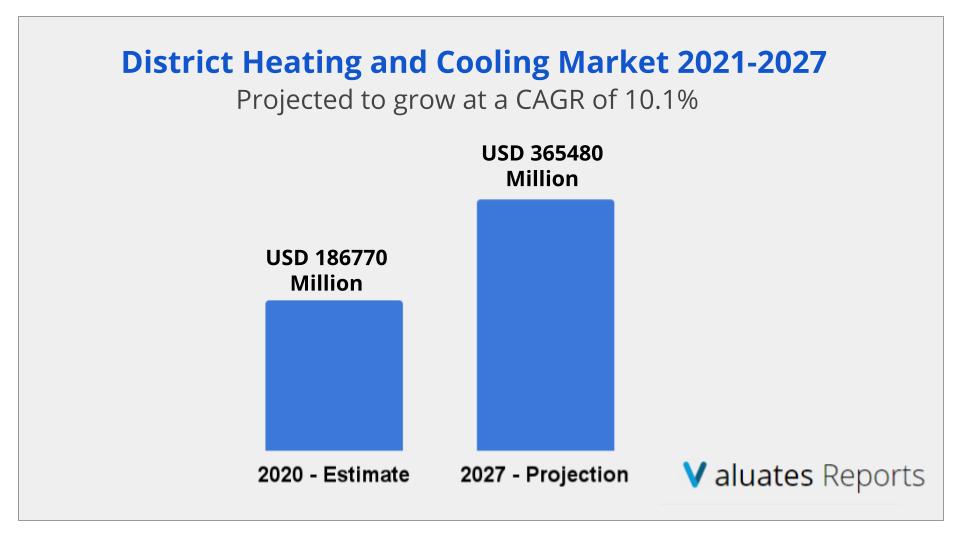
In 2020, the global District Heating and Cooling market size was US$ 186770 million and it is expected to reach US$ 365480 million by the end of 2027, with a CAGR of 10.1% during the forecast period 2021-2027.
District energy, both heating and cooling, tie together the energy generating sources in a city with buildings and facilities having a need for heating and/or cooling. Instead of each building having its own heating or cooling system, the energy is delivered to several buildings in a larger area from a central plant. The water-based distribution system guarantees that heat and cooling arrive safely to the end-users.
With district heating, energy is saved overall, as it takes advantage of resources that would otherwise not be have been used, making it an efficient and sustainable solution to satisfy the local heat and cooling demand in a city.
In terms of product, District Heating is the largest segment, with a share of about 90%. And in terms of application, the largest application is Residential, followed by Commercial, Industrial.
Global District Heating and Cooling key players include ENGIE, NRG Energy, Fortum, Empower, ADC Energy Systems, STEAG, Ørsted A/S, etc. Global top seven manufacturers hold a share of about 25%.
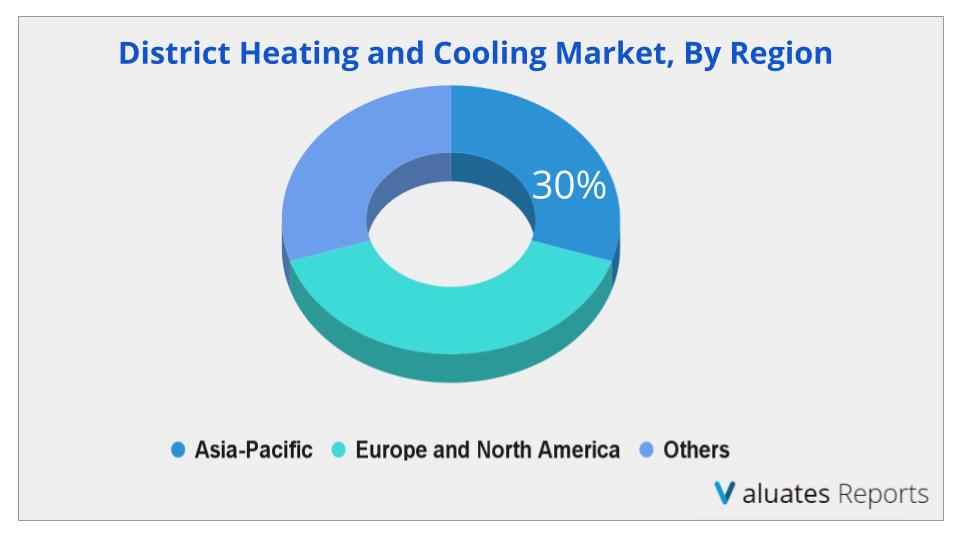
Asia-Pacific is the largest market, with a share of about 30%, followed by Europe and North America, which have a share of about 40 percent.
District Heating and Cooling market is segmented by region, by country, company, type, application, and by sales channels. Players, stakeholders, and other participants in the global District Heating and Cooling market will be able to gain the upper hand as they use the report as a powerful resource. The segmental analysis focuses on sales, revenue and forecast by region, by country, company, type, application and by sales channels for the period 2016-2027.
|
Report Metric |
Details |
|
Report Name |
District Heating and Cooling Market |
|
The market size in 2020 |
USD 186770 Million |
|
The revenue forecast in 2027 |
USD 365480 Million |
|
Growth Rate |
CAGR of 10.1% from 2021 to 2027 |
|
Base year considered |
2019 |
|
Forecast period |
2021-2027 |
|
Forecast units |
Value (USD) |
|
Segments covered |
Type, End-User, Offerings, and Region |
|
Market by Type |
District Heating, District Cooling |
|
Market by Applications/Enduser |
Residential, Commercial, Industrial |
|
Report coverage |
Revenue & volume forecast, company share, competitive landscape, growth factors, and trends |
|
Key Companies Covered |
ENGIE, NRG Energy, Fortum, Empower, ADC Energy Systems, STEAG, Ørsted A/S, Tabreed, Vattenfall, RWE AG, Goteborg Energi, Logstor, Shinryo, Emicool, Keppel DHCS, Statkraft, Ramboll |
|
Geographic regions covered |
North America, Europe, Asia Pacific, Latin America, Middle East & Africa |
Ans. In 2020, the global District Heating and Cooling market size was US$ 186770 million and it is expected to reach US$ 365480 million by the end of 2027, with a CAGR of 10.1% during 2021-2027.
Ans. Asia-Pacific is the largest market, with a share of about 30%, followed by Europe and North America, which have a share of about 40 percent.
Ans. In terms of product, District Heating is the largest segment, with a share of about 90%. And in terms of application, the largest application is Residential, followed by Commercial, Industrial.
Ans. The forecast period considered for the global district heating and cooling market is 2021 to 2027
Ans. The major players operating in the district heating and cooling market are ENGIE, NRG Energy, Fortum, Empower, ADC Energy Systems, STEAG, Ørsted A/S, Tabreed, Vattenfall, RWE AG, Goteborg Energi, Logstor, Shinryo, Emicool, Keppel DHCS, Statkraft, Ramboll
Ans. The major vendors operating in the self-checkout system market include NCR, Toshiba, Diebold Nixdorf, Fujitsu, ITAB, Pan-Oston, IBM, Grupo Digicon, Hisense, Modern-Expo Group, HP, Inc.
Table 1. Global District Heating and Cooling Market Size Growth Rate by Type (US$ Million): 2021 VS 2027
Table 2. Major Manufacturers of District Heating
Table 3. Major Manufacturers of District Cooling
Table 4. Global District Heating and Cooling Market Size Growth by Application (US$ Million): 2021 VS 2027
Table 5. Global District Heating and Cooling Market Size by Region (US$ Million): 2021 VS 2027
Table 6. Global District Heating and Cooling Sales by Region (2016-2021) & (T Wh)
Table 7. Global District Heating and Cooling Sales Forecast by Region (2022-2027) & (T Wh)
Table 8. Global District Heating and Cooling Revenue by Region (2016-2021) & (US$ Million)
Table 9. Global District Heating and Cooling Revenue Forecast by Region (2022-2027) & (US$ Million)
Table 10. Global District Heating and Cooling Sales by Manufacturer (2016-2021) & (T Wh)
Table 11. Global District Heating and Cooling Sales Share by Manufacturer (2016-2021)
Table 12. District Heating and Cooling Revenue by Manufacturer (2016-2021) & (US$ Million)
Table 13. District Heating and Cooling Revenue Share by Manufacturer (2016-2021)
Table 14. Key Manufacturers District Heating and Cooling Price (2016-2021) & (USD/MWh)
Table 15. Ranking of Global Top District Heating and Cooling Manufacturers by Revenue (US$ Million) in 2020
Table 16. Global District Heating and Cooling Manufacturers Market Concentration Ratio (CR5 and HHI) & (2016-2021)
Table 17. Global District Heating and Cooling by Company Type (Tier 1, Tier 2 and Tier 3) & (based on the Revenue in District Heating and Cooling as of 2020)
Table 18. District Heating and Cooling Manufacturers Manufacturing Base Distribution and Headquarters
Table 19. Manufacturers District Heating and Cooling Product Type
Table 20. Date of International Manufacturers Enter into District Heating and Cooling Market
Table 21. Manufacturers Mergers & Acquisitions, Expansion Plans
Table 22. ENGIE Corporation Information
Table 23. ENGIE Description and Business Overview
Table 24. ENGIE District Heating and Cooling Sales (T Wh), Revenue (US$ Million), Price (USD/MWh) and Gross Margin (2016-2021)
Table 25. ENGIE District Heating and Cooling Product
Table 26. ENGIE District Heating and Cooling Revenue (US$ Million) and Market Share by Product
Table 27. ENGIE District Heating and Cooling Revenue (US$ Million) and Market Share by Application
Table 28. ENGIE District Heating and Cooling Revenue (US$ Million) and Market Share by Geographic Area
Table 29. ENGIE District Heating and Cooling Revenue (US$ Million) and Market Share by Sales Channel
Table 30. ENGIE Recent Development
Table 31. NRG Energy Corporation Information
Table 32. NRG Energy Description and Business Overview
Table 33. NRG Energy District Heating and Cooling Sales (T Wh), Revenue (US$ Million), Price (USD/MWh) and Gross Margin (2016-2021)
Table 34. NRG Energy District Heating and Cooling Product
Table 35. NRG Energy District Heating and Cooling Revenue (US$ Million) and Market Share by Product
Table 36. NRG Energy District Heating and Cooling Revenue (US$ Million) and Market Share by Application
Table 37. NRG Energy District Heating and Cooling Revenue (US$ Million) and Market Share by Geographic Area
Table 38. NRG Energy District Heating and Cooling Revenue (US$ Million) and Market Share by Sales Channel
Table 39. NRG Energy Recent Development
Table 40. Fortum Corporation Information
Table 41. Fortum Description and Business Overview
Table 42. Fortum District Heating and Cooling Sales (T Wh), Revenue (US$ Million), Price (USD/MWh) and Gross Margin (2016-2021)
Table 43. Fortum District Heating and Cooling Product
Table 44. Fortum District Heating and Cooling Revenue (US$ Million) and Market Share by Product
Table 45. Fortum District Heating and Cooling Revenue (US$ Million) and Market Share by Application
Table 46. Fortum District Heating and Cooling Revenue (US$ Million) and Market Share by Geographic Area
Table 47. Fortum District Heating and Cooling Revenue (US$ Million) and Market Share by Sales Channel
Table 48. Fortum Recent Development
Table 49. Empower Corporation Information
Table 50. Empower Description and Business Overview
Table 51. Empower District Heating and Cooling Sales (T Wh), Revenue (US$ Million), Price (USD/MWh) and Gross Margin (2016-2021)
Table 52. Empower District Heating and Cooling Product
Table 53. Empower District Heating and Cooling Revenue (US$ Million) and Market Share by Product
Table 54. Empower District Heating and Cooling Revenue (US$ Million) and Market Share by Application
Table 55. Empower District Heating and Cooling Revenue (US$ Million) and Market Share by Geographic Area
Table 56. Empower District Heating and Cooling Revenue (US$ Million) and Market Share by Sales Channel
Table 57. Empower Recent Development
Table 58. ADC Energy Systems Corporation Information
Table 59. ADC Energy Systems Description and Business Overview
Table 60. ADC Energy Systems District Heating and Cooling Sales (T Wh), Revenue (US$ Million), Price (USD/MWh) and Gross Margin (2016-2021)
Table 61. ADC Energy Systems District Heating and Cooling Product
Table 62. ADC Energy Systems District Heating and Cooling Revenue (US$ Million) and Market Share by Product
Table 63. ADC Energy Systems District Heating and Cooling Revenue (US$ Million) and Market Share by Application
Table 64. ADC Energy Systems District Heating and Cooling Revenue (US$ Million) and Market Share by Geographic Area
Table 65. ADC Energy Systems District Heating and Cooling Revenue (US$ Million) and Market Share by Sales Channel
Table 66. ADC Energy Systems Recent Development
Table 67. STEAG Corporation Information
Table 68. STEAG Description and Business Overview
Table 69. STEAG District Heating and Cooling Sales (T Wh), Revenue (US$ Million), Price (USD/MWh) and Gross Margin (2016-2021)
Table 70. STEAG District Heating and Cooling Product
Table 71. STEAG District Heating and Cooling Revenue (US$ Million) and Market Share by Product
Table 72. STEAG District Heating and Cooling Revenue (US$ Million) and Market Share by Application
Table 73. STEAG District Heating and Cooling Revenue (US$ Million) and Market Share by Geographic Area
Table 74. STEAG Recent Development
Table 75. Ørsted A/S Corporation Information
Table 76. Ørsted A/S Description and Business Overview
Table 77. Ørsted A/S District Heating and Cooling Sales (T Wh), Revenue (US$ Million), Price (USD/MWh) and Gross Margin (2016-2021)
Table 78. Ørsted A/S District Heating and Cooling Product
Table 79. Ørsted A/S District Heating and Cooling Revenue (US$ Million) and Market Share by Product
Table 80. Ørsted A/S District Heating and Cooling Revenue (US$ Million) and Market Share by Application
Table 81. Ørsted A/S District Heating and Cooling Revenue (US$ Million) and Market Share by Geographic Area
Table 82. Ørsted A/S Recent Development
Table 83. Tabreed Corporation Information
Table 84. Tabreed Description and Business Overview
Table 85. Tabreed District Heating and Cooling Sales (T Wh), Revenue (US$ Million), Price (USD/MWh) and Gross Margin (2016-2021)
Table 86. Tabreed District Heating and Cooling Product
Table 87. Tabreed District Heating and Cooling Revenue (US$ Million) and Market Share by Product
Table 88. Tabreed District Heating and Cooling Revenue (US$ Million) and Market Share by Application
Table 89. Tabreed District Heating and Cooling Revenue (US$ Million) and Market Share by Geographic Area
Table 90. Tabreed Recent Development
Table 91. Vattenfall Corporation Information
Table 92. Vattenfall Description and Business Overview
Table 93. Vattenfall District Heating and Cooling Sales (T Wh), Revenue (US$ Million), Price (USD/MWh) and Gross Margin (2016-2021)
Table 94. Vattenfall District Heating and Cooling Product
Table 95. Vattenfall District Heating and Cooling Revenue (US$ Million) and Market Share by Product
Table 96. Vattenfall District Heating and Cooling Revenue (US$ Million) and Market Share by Application
Table 97. Vattenfall District Heating and Cooling Revenue (US$ Million) and Market Share by Geographic Area
Table 98. Vattenfall Recent Development
Table 99. RWE AG Corporation Information
Table 100. RWE AG Description and Business Overview
Table 101. RWE AG District Heating and Cooling Sales (T Wh), Revenue (US$ Million), Price (USD/MWh) and Gross Margin (2016-2021)
Table 102. RWE AG District Heating and Cooling Product
Table 103. RWE AG District Heating and Cooling Revenue (US$ Million) and Market Share by Product
Table 104. RWE AG District Heating and Cooling Revenue (US$ Million) and Market Share by Application
Table 105. RWE AG District Heating and Cooling Revenue (US$ Million) and Market Share by Geographic Area
Table 106. RWE AG Recent Development
Table 107. Goteborg Energi Corporation Information
Table 108. Goteborg Energi Description and Business Overview
Table 109. Goteborg Energi District Heating and Cooling Sales (T Wh), Revenue (US$ Million), Price (USD/MWh) and Gross Margin (2016-2021)
Table 110. Goteborg Energi District Heating and Cooling Product
Table 111. Goteborg Energi District Heating and Cooling Revenue (US$ Million) and Market Share by Product
Table 112. Goteborg Energi District Heating and Cooling Revenue (US$ Million) and Market Share by Application
Table 113. Goteborg Energi District Heating and Cooling Revenue (US$ Million) and Market Share by Geographic Area
Table 114. Goteborg Energi Recent Development
Table 115. Logstor Corporation Information
Table 116. Logstor Description and Business Overview
Table 117. Logstor District Heating and Cooling Sales (T Wh), Revenue (US$ Million), Price (USD/MWh) and Gross Margin (2016-2021)
Table 118. Logstor District Heating and Cooling Product
Table 119. Logstor District Heating and Cooling Revenue (US$ Million) and Market Share by Product
Table 120. Logstor District Heating and Cooling Revenue (US$ Million) and Market Share by Application
Table 121. Logstor District Heating and Cooling Revenue (US$ Million) and Market Share by Geographic Area
Table 122. Logstor Recent Development
Table 123. Shinryo Corporation Information
Table 124. Shinryo Description and Business Overview
Table 125. Shinryo District Heating and Cooling Sales (T Wh), Revenue (US$ Million), Price (USD/MWh) and Gross Margin (2016-2021)
Table 126. Shinryo District Heating and Cooling Product
Table 127. Shinryo District Heating and Cooling Revenue (US$ Million) and Market Share by Product
Table 128. Shinryo District Heating and Cooling Revenue (US$ Million) and Market Share by Application
Table 129. Shinryo District Heating and Cooling Revenue (US$ Million) and Market Share by Geographic Area
Table 130. Shinryo Recent Development
Table 131. Emicool Corporation Information
Table 132. Emicool Description and Business Overview
Table 133. Emicool District Heating and Cooling Sales (T Wh), Revenue (US$ Million), Price (USD/MWh) and Gross Margin (2016-2021)
Table 134. Emicool District Heating and Cooling Product
Table 135. Emicool District Heating and Cooling Revenue (US$ Million) and Market Share by Product
Table 136. Emicool District Heating and Cooling Revenue (US$ Million) and Market Share by Application
Table 137. Emicool District Heating and Cooling Revenue (US$ Million) and Market Share by Geographic Area
Table 138. Emicool Recent Development
Table 139. Keppel DHCS Corporation Information
Table 140. Keppel DHCS Description and Business Overview
Table 141. Keppel DHCS District Heating and Cooling Sales (T Wh), Revenue (US$ Million), Price (USD/MWh) and Gross Margin (2016-2021)
Table 142. Keppel DHCS District Heating and Cooling Product
Table 143. Keppel DHCS District Heating and Cooling Revenue (US$ Million) and Market Share by Product
Table 144. Keppel DHCS District Heating and Cooling Revenue (US$ Million) and Market Share by Application
Table 145. Keppel DHCS District Heating and Cooling Revenue (US$ Million) and Market Share by Geographic Area
Table 146. Keppel DHCS Recent Development
Table 147. Statkraft Corporation Information
Table 148. Statkraft Description and Business Overview
Table 149. Statkraft District Heating and Cooling Sales (T Wh), Revenue (US$ Million), Price (USD/MWh) and Gross Margin (2016-2021)
Table 150. Statkraft District Heating and Cooling Product
Table 151. Statkraft District Heating and Cooling Revenue (US$ Million) and Market Share by Product
Table 152. Statkraft District Heating and Cooling Revenue (US$ Million) and Market Share by Application
Table 153. Statkraft District Heating and Cooling Revenue (US$ Million) and Market Share by Geographic Area
Table 154. Statkraft Recent Development
Table 155. Ramboll Corporation Information
Table 156. Ramboll Description and Business Overview
Table 157. Ramboll District Heating and Cooling Sales (T Wh), Revenue (US$ Million), Price (USD/MWh) and Gross Margin (2016-2021)
Table 158. Ramboll District Heating and Cooling Product
Table 159. Ramboll District Heating and Cooling Revenue (US$ Million) and Market Share by Product
Table 160. Ramboll District Heating and Cooling Revenue (US$ Million) and Market Share by Application
Table 161. Ramboll District Heating and Cooling Revenue (US$ Million) and Market Share by Geographic Area
Table 162. Ramboll Recent Development
Table 163. Global District Heating and Cooling Sales by Type (2016-2021) & (T Wh)
Table 164. Global District Heating and Cooling Sales Forecast by Type (2022-2027) & (T Wh)
Table 165. Global District Heating and Cooling Revenue by Type (2016-2021) & (US$ Million)
Table 166. Global District Heating and Cooling Revenue Forecast by Type (2022-2027) & (US$ Million)
Table 167. Global District Heating and Cooling Sales by Application (2016-2021) & (T Wh)
Table 168. Global District Heating and Cooling Sales Forecast by Application (2022-2027) & (T Wh)
Table 169. Global District Heating and Cooling Revenue by Application (2016-2021) & (US$ Million)
Table 170. Global District Heating and Cooling Revenue Forecast by Application (2022-2027) & (US$ Million)
Table 171. North America District Heating and Cooling Sales by Country (2016-2021) & (T Wh)
Table 172. North America District Heating and Cooling Sales by Country (2022-2027) & (T Wh)
Table 173. North America District Heating and Cooling Revenue by Country (2016-2021) & (US$ Million)
Table 174. North America District Heating and Cooling Revenue by Country (2022-2027) & (US$ Million)
Table 175. North America District Heating and Cooling Sales by Type (2016-2021) & (T Wh)
Table 176. North America District Heating and Cooling Sales by Application (2016-2021) & (T Wh)
Table 177. Asia-Pacific District Heating and Cooling Sales by Region (2016-2021) & (T Wh)
Table 178. Asia-Pacific District Heating and Cooling Sales by Region (2022-2027) & (T Wh)
Table 179. Asia-Pacific District Heating and Cooling Revenue by Region (2016-2027) & (US$ Million)
Table 180. Asia-Pacific District Heating and Cooling Revenue by Region (2022-2027) & (US$ Million)
Table 181. Asia-Pacific District Heating and Cooling Sales by Type (2016-2021) & (T Wh)
Table 182. Asia-Pacific District Heating and Cooling Sales by Application (2016-2021) & (T Wh)
Table 183. Europe District Heating and Cooling Sales by Country (2016-2021) & (T Wh)
Table 184. Europe District Heating and Cooling Sales by Country (2022-2027) & (T Wh)
Table 185. Europe District Heating and Cooling Revenue by Country (2016-2021) & (US$ Million)
Table 186. Europe District Heating and Cooling Revenue by Country (2022-2027) & (US$ Million)
Table 187. Europe District Heating and Cooling Sales by Type (2016-2021) & (T Wh)
Table 188. Europe District Heating and Cooling Sales by Application (2016-2021) & (T Wh)
Table 189. Latin America District Heating and Cooling Sales by Country (2016-2021) & (T Wh)
Table 190. Latin America District Heating and Cooling Sales by Country (2022-2027) & (T Wh)
Table 191. Latin America District Heating and Cooling Revenue by Country (2016-2021) & (US$ Million)
Table 192. Latin America District Heating and Cooling Revenue by Country (2022-2027) & (US$ Million)
Table 193. Latin America District Heating and Cooling Sales by Type (2016-2021) & (T Wh)
Table 194. Latin America District Heating and Cooling Sales by Application (2016-2021) & (T Wh)
Table 195. Middle East and Africa District Heating and Cooling Sales by Country (2016-2021) & (T Wh)
Table 196. Middle East and Africa District Heating and Cooling Sales by Country (2022-2027) & (T Wh)
Table 197. Middle East and Africa District Heating and Cooling Revenue by Country (2016-2021) & (US$ Million)
Table 198. Middle East and Africa District Heating and Cooling Revenue by Country (2022-2027) & (US$ Million)
Table 199. Middle East and Africa District Heating and Cooling Sales by Type (2016-2021) & (T Wh)
Table 200. Middle East and Africa District Heating and Cooling Sales by Application (2016-2021) & (T Wh)
Table 201. District Heating and Cooling Key Raw Materials, Industry Status and Trend
Table 202. District Heating and Cooling Key Raw Materials and Upstream Suppliers
Table 203. District Heating and Cooling Clients Status and Trend
Table 204. District Heating and Cooling Typical Clients
Table 205. District Heating and Cooling Distributors
Table 206. Key Drivers: Impact Analysis (2022-2027)
Table 207. District Heating and Cooling Market Drivers
Table 208. District Heating and Cooling Market Opportunities
Table 209. District Heating and Cooling Market Challenges
Table 210. District Heating and Cooling Market Restraints
Table 211. District Heating and Cooling Porter’s Five Forces Analysis
Table 212. Research Programs/Design for This Report
Table 213. Key Data Information from Secondary Sources
Table 214. Key Data Information from Primary Sources
List of Figures
Figure 1. District Heating and Cooling Product Picture
Figure 2. Global District Heating and Cooling Sales Market Share by Type in 2021 & 2027
Figure 3. District Heating Product Picture
Figure 4. District Cooling Product Picture
Figure 5. Global District Heating and Cooling Sales Market Share by Application in 2021 & 2027
Figure 6. Residential Examples
Figure 7. Commercial Examples
Figure 8. Industrial Examples
Figure 9. District Heating and Cooling Report Years Considered
Figure 10. Global District Heating and Cooling Market Size, (US$ Million), 2016 VS 2021 VS 2027
Figure 11. Global District Heating and Cooling Market Size 2016-2027 (US$ Million)
Figure 12. Global District Heating and Cooling Sales 2016-2027 (K Units)
Figure 13. Global District Heating and Cooling Market Size Market Share by Region: 2021 Versus 2027
Figure 14. Global District Heating and Cooling Sales Market Share Forecast by Region (2016-2027)
Figure 15. Global District Heating and Cooling Revenue Market Share by Region (2016-2027)
Figure 16. Global District Heating and Cooling Sales Share by Manufacturer in 2020
Figure 17. District Heating and Cooling Market Share by Company Type (Tier 1, Tier 2 and Tier 3): 2016 VS 2020
Figure 18. Global District Heating and Cooling Sales Market Share Forecast by Type (2016-2027)
Figure 19. Global District Heating and Cooling Revenue Market Share Forecast by Type (2016-2027)
Figure 20. District Heating and Cooling Average Selling Price (ASP) by Type (2016-2021) & (USD/Unit)
Figure 21. Global District Heating and Cooling Sales Market Share Forecast by Application (2016-2027)
Figure 22. Global District Heating and Cooling Revenue Market Share Forecast by Application (2016-2027)
Figure 23. District Heating and Cooling Average Selling Price (ASP) by Application (2016-2021) & (USD/Unit)
Figure 24. North America District Heating and Cooling Revenue 2016-2027 (US$ Million)
Figure 25. North America District Heating and Cooling Sales Market Share by Type (2016-2021)
Figure 26. North America District Heating and Cooling Sales Market Share by Application (2016-2021)
Figure 27. Asia-Pacific District Heating and Cooling Revenue 2016-2027 (US$ Million)
Figure 28. Asia-Pacific District Heating and Cooling Sales Market Share by Region (2016-2027)
Figure 29. Asia-Pacific District Heating and Cooling Revenue Market Share by Region (2016-2027)
Figure 30. Asia-Pacific District Heating and Cooling Sales Market Share by Type (2016-2021)
Figure 31. Asia-Pacific District Heating and Cooling Sales Market Share by Application (2016-2021)
Figure 32. Europe District Heating and Cooling Revenue Growth Rate 2016-2027 (US$ Million)
Figure 33. Europe District Heating and Cooling Sales Market Share by Country (2016-2027)
Figure 34. Europe District Heating and Cooling Revenue Market Share by Country (2016-2027)
Figure 35. Europe District Heating and Cooling Sales Market Share by Type (2016-2021)
Figure 36. Europe District Heating and Cooling Sales Market Share by Application (2016-2021)
Figure 37. Latin America District Heating and Cooling Revenue Growth Rate 2016-2027 (US$ Million)
Figure 38. Latin America District Heating and Cooling Sales Market Share by Country (2016-2027)
Figure 39. Latin America District Heating and Cooling Revenue Market Share by Country (2016-2021)
Figure 40. Latin America District Heating and Cooling Sales Market Share by Type (2016-2021)
Figure 41. Latin America District Heating and Cooling Sales Market Share by Application (2016-2021)
Figure 42. Middle East and Africa District Heating and Cooling Revenue Growth Rate 2016-2027 (US$ Million)
Figure 43. Middle East and Africa District Heating and Cooling Sales Market Share by Country (2016-2027)
Figure 44. Middle East and Africa District Heating and Cooling Revenue Market Share by Country (2016-2027)
Figure 45. Middle East and Africa District Heating and Cooling Sales Market Share by Type (2016-2021)
Figure 46. Middle East and Africa District Heating and Cooling Sales Market Share by Application (2016-2021)
Figure 47. District Heating and Cooling Supply Chain (Upstream and Downstream Market)
Figure 48. Global Production Market Share of District Heating and Cooling Raw Materials by Region in 2020
Figure 49. District Heating and Cooling Distribution Channels
Figure 50. Global District Heating and Cooling Percentage 2016-2027: Indirect Sales VS Direct Sales
Figure 51. Global District Heating and Cooling Percentage 2016-2027: Online Sales VS Offline Sales
Figure 52. Porter's Five Forces Analysis
Figure 53. Bottom-up and Top-down Approaches for This Report
Figure 54. Data Triangulation
Figure 55. Key Executives Interviewed
$4900
$9800
HAVE A QUERY?
OUR CUSTOMER
