Bottom Anti-Reflective Coatings (BARC) Market Size
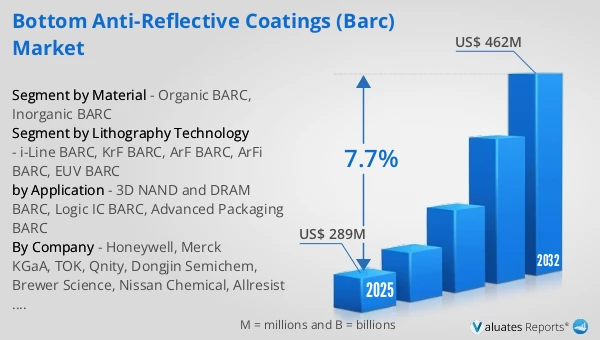
The global Bottom Anti-Reflective Coatings (BARC) market was valued at US$ 289 million in 2025 and is anticipated to reach US$ 462 million by 2032, at a CAGR of 7.7% from 2026 to 2032.
Bottom Anti-Reflective Coatings (BARC) Market
The 2025 U.S. tariff policies introduce profound uncertainty into the global economic landscape. This report critically examines the implications of recent tariff adjustments and international strategic countermeasures on Bottom Anti-Reflective Coatings (BARC) competitive dynamics, regional economic interdependencies, and supply chain reconfigurations.
BARC (Bottom Anti-Reflective Coatings) is a lithography material applied between the substrate/film stack and the photoresist, engineered to control reflectivity via optical constants (n, k), thickness, and absorption, thereby suppressing standing waves and swing-curve effects caused by substrate reflections and improving CD control and pattern fidelity. In industry practice, BARC is most commonly supplied as spin-on organic BARC, while inorganic / silicon-containing BARCs exist for more complex stack integration and etch/hardmask synergies. BARC is typically positioned as part of the broader lithography “reflective multilayer / ancillary materials” portfolio alongside TARCs and other support chemistries.
From a process/technology and application perspective, BARC provides more than reflectivity control: it supports vertical profile, expands process latitude, and helps mitigate topography-related lithography issues, with some products positioned for gap fill and planarization. The mainstream wavelength coverage is commonly framed by lithography generations—i-line, KrF, and ArF (including 193nm immersion); suppliers explicitly target logic and memory across i-line/KrF/ArF. Key integration requirements include resist compatibility (avoiding intermixing), low outgassing, thermal crosslink/bake behavior and solvent systems, and removability—either via plasma etch transfer or via developable BARC (DBARC) approaches that can reduce or eliminate additional etch steps in selected flows.
Competitively, BARC is a qualification-intensive, sticky ancillary-material segment, concentrated among a small set of global leaders and specialists, frequently sold and qualified as part of a complete lithography material stack. Representative suppliers include Brewer Science (positioning ARC® as the benchmark “original BARC” line spanning i-line to 193nm immersion) , Merck KGaA (BARC for reflectivity control, standing-wave suppression, and topography issues, targeting i-line/KrF/ArF for logic/memory) , TOK (TARC/BARC offerings with explicit statements on PFOS/PFOA-free formulations) , Qnity (organic, thermally cross-linking KrF BARC offerings) , and Honeywell’s historical inorganic BARC path (e.g., DUO inorganic BARC distribution via JSR). Forward trends/drivers include tighter CD/defect requirements as film stacks become more complex, multi-patterning and reflectivity challenges across layers, and sustainability/compliance pressures (PFOS/PFOA/PFAS-related) accelerating formulation evolution and substitution.
This report delivers a comprehensive overview of the global Bottom Anti-Reflective Coatings (BARC) market, with both quantitative and qualitative analyses, to help readers develop growth strategies, assess the competitive landscape, evaluate their position in the current market, and make informed business decisions regarding Bottom Anti-Reflective Coatings (BARC). The Bottom Anti-Reflective Coatings (BARC) market size, estimates, and forecasts are provided in terms of output/shipments (Tons) and revenue (US$ millions), with 2025 as the base year and historical and forecast data for 2021–2032.
The report segments the global Bottom Anti-Reflective Coatings (BARC) market comprehensively. Regional market sizes by Lithography Technology, by Application, by Material, and by company are also provided. For deeper insight, the report profiles the competitive landscape, key competitors, and their respective market rankings, and discusses technological trends and new product developments.
This report will assist Bottom Anti-Reflective Coatings (BARC) manufacturers, new entrants, and companies across the industry value chain with information on revenues, production, and average prices for the overall market and its sub-segments, by company, by Lithography Technology, by Application, and by region.
Market Segmentation
Scope of Bottom Anti-Reflective Coatings (BARC) Market Report
| Report Metric |
Details |
| Report Name |
Bottom Anti-Reflective Coatings (BARC) Market |
| Accounted market size in 2025 |
US$ 289 million |
| Forecasted market size in 2032 |
US$ 462 million |
| CAGR |
7.7% |
| Base Year |
2025 |
| Forecasted years |
2026 - 2032 |
| Segment by Lithography Technology |
- i-Line BARC
- KrF BARC
- ArF BARC
- ArFi BARC
- EUV BARC
|
| Segment by Material |
- Organic BARC
- Inorganic BARC
|
| by Application |
- 3D NAND and DRAM BARC
- Logic IC BARC
- Advanced Packaging BARC
|
| Production by Region |
- North America
- Europe
- China
- Japan
- South Korea
|
| Consumption by Region |
- North America (United States, Canada)
- Europe (Germany, France, UK, Italy, Russia)
- Asia-Pacific (China, Japan, South Korea, Taiwan)
- Southeast Asia (India)
- Latin America (Mexico, Brazil)
|
| By Company |
Honeywell, Merck KGaA, TOK, Qnity, Dongjin Semichem, Brewer Science, Nissan Chemical, Allresist GmbH, YCCHEM Co., Ltd, SK Materials Performance (SKMP), Red Avenue, Xiamen Hengkun New Material Technology, PhiChem |
| Forecast units |
USD million in value |
| Report coverage |
Revenue and volume forecast, company share, competitive landscape, growth factors and trends |
Chapter Outline
- Chapter 1: Defines the scope of the report and presents an executive summary of market segments (by Lithography Technology, by Application, by Material, etc.), including the size of each segment and its future growth potential. It offers a high-level view of the current market and its likely evolution in the short, medium, and long term.
- Chapter 2: Provides a detailed analysis of the competitive landscape for Bottom Anti-Reflective Coatings (BARC) manufacturers, including prices, production, value-based market shares, latest development plans, and information on mergers and acquisitions.
- Chapter 3: Examines Bottom Anti-Reflective Coatings (BARC) production/output and value by region and country, providing a quantitative assessment of market size and growth potential for each region over the next six years.
- Chapter 4: Analyzes Bottom Anti-Reflective Coatings (BARC) consumption at the regional and country levels. It quantifies market size and growth potential for each region and its key countries, and outlines market development, outlook, addressable space, and national production.
- Chapter 5: Analyzes market segments by Lithography Technology, covering the size and growth potential of each segment to help readers identify “blue ocean” opportunities.
- Chapter 6: Analyzes market segments by Application, covering the size and growth potential of each segment to help readers identify “blue ocean” opportunities in downstream markets.
- Chapter 7: Profiles key players, detailing the fundamentals of major companies, including product production/output, value, price, gross margin, product portfolio/introductions, and recent developments.
- Chapter 8: Reviews the industry value chain, including upstream and downstream segments.
- Chapter 9: Discusses market dynamics and recent developments, including drivers, restraints, challenges and risks for manufacturers, U.S. Tariffs and relevant policy analysis.
- Chapter 10: Summarizes the key findings and conclusions of the report.
FAQ for this report
How fast is Bottom Anti-Reflective Coatings (BARC) Market growing?
Ans: The Bottom Anti-Reflective Coatings (BARC) Market witnessing a CAGR of 7.7% during the forecast period 2026-2032.
What is the Bottom Anti-Reflective Coatings (BARC) Market size in 2032?
Ans: The Bottom Anti-Reflective Coatings (BARC) Market size in 2032 will be US$ 462 million.
Who are the main players in the Bottom Anti-Reflective Coatings (BARC) Market report?
Ans: The main players in the Bottom Anti-Reflective Coatings (BARC) Market are Honeywell, Merck KGaA, TOK, Qnity, Dongjin Semichem, Brewer Science, Nissan Chemical, Allresist GmbH, YCCHEM Co., Ltd, SK Materials Performance (SKMP), Red Avenue, Xiamen Hengkun New Material Technology, PhiChem
What are the Application segmentation covered in the Bottom Anti-Reflective Coatings (BARC) Market report?
Ans: The Applications covered in the Bottom Anti-Reflective Coatings (BARC) Market report are 3D NAND and DRAM BARC, Logic IC BARC, Advanced Packaging BARC

