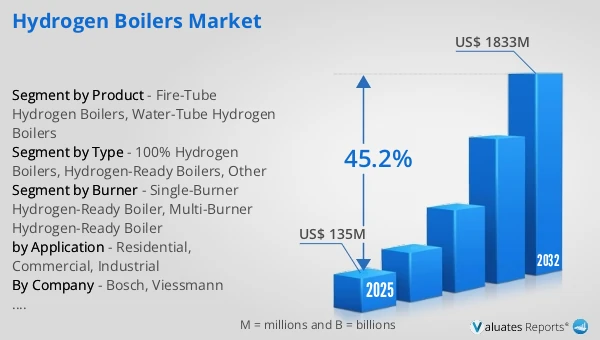
The global Hydrogen Boilers market was valued at US$ 135 million in 2025 and is anticipated to reach US$ 1833 million by 2032, at a CAGR of 45.2% from 2026 to 2032.
Hydrogen Boilers Market
The 2025 U.S. tariff policies introduce profound uncertainty into the global economic landscape. This report critically examines the implications of recent tariff adjustments and international strategic countermeasures on Hydrogen Boilers competitive dynamics, regional economic interdependencies, and supply chain reconfigurations.
Hydrogen boilers are heat-generation systems designed to produce steam or hot water by burning hydrogen (pure hydrogen or hydrogen-blended fuels) instead of conventional fossil fuels such as natural gas or oil. They are used in industrial, commercial, and district-heating applications where thermal energy is required for space heating, process heat, or steam generation. In operation, hydrogen boilers work on the same thermodynamic principles as gas boilers, but their combustion systems, burners, control logic, materials, and safety designs are specifically engineered to handle hydrogen’s distinct properties—such as higher flame speed, wider flammability range, lower ignition energy, and different NOx formation behavior. When hydrogen is combusted, the primary by-product is water vapor, enabling hydrogen boilers to significantly reduce or eliminate CO₂ emissions at the point of use. From a market perspective, hydrogen boilers are increasingly positioned as a decarbonization solution for hard-to-electrify heat demand, especially in industries that rely on continuous or high-temperature thermal processes, and they are commonly categorized into hydrogen-ready (convertible) boilers and 100% hydrogen-firing boilers depending on fuel capability and infrastructure readiness.
In 2025, global Hydrogen Boilers sales volume reached approximately 482 units, with an average global market price of around k US$ 280 per unit.
1. Global Decarbonization and Net-Zero Commitments
Government-led decarbonization strategies are the primary driver of the hydrogen boiler market. Many countries have committed to net-zero CO₂ targets, creating strong pressure to decarbonize heat generation, which accounts for a large share of industrial and commercial emissions. Hydrogen boilers enable near-zero-carbon heat at the point of use, making them a favored solution in policy roadmaps for low-carbon industrial energy systems.
2. Difficulty of Electrifying Industrial Heat
A large portion of industrial heat demand—especially medium- and high-temperature process heat—is difficult or uneconomical to electrify using heat pumps or electric boilers. Hydrogen boilers provide a drop-in or near-drop-in alternative to gas boilers, allowing industries such as chemicals, food & beverage, refining, paper, and pharmaceuticals to decarbonize without redesigning core thermal processes.
3. Expansion of Hydrogen Infrastructure and Supply
The accelerating development of green and low-carbon hydrogen production, hydrogen pipelines, blending projects, and hydrogen hubs is directly supporting boiler adoption. As hydrogen availability improves, end users gain confidence in fuel security, driving investment in hydrogen-capable boilers rather than conventional fossil-fuel systems.
4. Rising Carbon Pricing and Emissions Regulation
Carbon taxes, emissions trading systems (ETS), and stricter industrial emissions regulations are increasing the operating cost of fossil-fuel boilers. Hydrogen boilers help industrial users mitigate long-term carbon cost exposure, making them increasingly attractive from a total cost of ownership (TCO) perspective, especially in regions with aggressive carbon pricing.
This report delivers a comprehensive overview of the global Hydrogen Boilers market, with both quantitative and qualitative analyses, to help readers develop growth strategies, assess the competitive landscape, evaluate their position in the current market, and make informed business decisions regarding Hydrogen Boilers. The Hydrogen Boilers market size, estimates, and forecasts are provided in terms of output/shipments (Units) and revenue (US$ millions), with 2025 as the base year and historical and forecast data for 2021–2032.
The report segments the global Hydrogen Boilers market comprehensively. Regional market sizes by Type, by Application, by Product, and by company are also provided. For deeper insight, the report profiles the competitive landscape, key competitors, and their respective market rankings, and discusses technological trends and new product developments.
This report will assist Hydrogen Boilers manufacturers, new entrants, and companies across the industry value chain with information on revenues, production, and average prices for the overall market and its sub-segments, by company, by Type, by Application, and by region.
Market Segmentation
Scope of Hydrogen Boilers Market Report
| Report Metric |
Details |
| Report Name |
Hydrogen Boilers Market |
| Accounted market size in 2025 |
US$ 135 million |
| Forecasted market size in 2032 |
US$ 1833 million |
| CAGR |
45.2% |
| Base Year |
2025 |
| Forecasted years |
2026 - 2032 |
| Segment by Type |
- 100% Hydrogen Boilers
- Hydrogen-Ready Boilers
- Other
|
| Segment by Product |
- Fire-Tube Hydrogen Boilers
- Water-Tube Hydrogen Boilers
|
| Segment by Burner |
- Single-Burner Hydrogen-Ready Boiler
- Multi-Burner Hydrogen-Ready Boiler
|
| by Application |
- Residential
- Commercial
- Industrial
|
| Production by Region |
- North America
- Europe
- China
- Japan
|
| Consumption by Region |
- North America (United States, Canada)
- Europe (Germany, France, UK, Italy, Russia)
- Asia-Pacific (China, Japan, South Korea, Taiwan)
- Southeast Asia (India)
- Latin America (Mexico, Brazil)
|
| By Company |
Bosch, Viessmann Climate Solutions (Carrier), Cochran, Babcock & Wilcox, Miura |
| Forecast units |
USD million in value |
| Report coverage |
Revenue and volume forecast, company share, competitive landscape, growth factors and trends |
Chapter Outline
- Chapter 1: Defines the scope of the report and presents an executive summary of market segments (by Type, by Application, by Product, etc.), including the size of each segment and its future growth potential. It offers a high-level view of the current market and its likely evolution in the short, medium, and long term.
- Chapter 2: Provides a detailed analysis of the competitive landscape for Hydrogen Boilers manufacturers, including prices, production, value-based market shares, latest development plans, and information on mergers and acquisitions.
- Chapter 3: Examines Hydrogen Boilers production/output and value by region and country, providing a quantitative assessment of market size and growth potential for each region over the next six years.
- Chapter 4: Analyzes Hydrogen Boilers consumption at the regional and country levels. It quantifies market size and growth potential for each region and its key countries, and outlines market development, outlook, addressable space, and national production.
- Chapter 5: Analyzes market segments by Type, covering the size and growth potential of each segment to help readers identify “blue ocean” opportunities.
- Chapter 6: Analyzes market segments by Application, covering the size and growth potential of each segment to help readers identify “blue ocean” opportunities in downstream markets.
- Chapter 7: Profiles key players, detailing the fundamentals of major companies, including product production/output, value, price, gross margin, product portfolio/introductions, and recent developments.
- Chapter 8: Reviews the industry value chain, including upstream and downstream segments.
- Chapter 9: Discusses market dynamics and recent developments, including drivers, restraints, challenges and risks for manufacturers, U.S. Tariffs and relevant policy analysis.
- Chapter 10: Summarizes the key findings and conclusions of the report.
Ans: The Hydrogen Boilers Market witnessing a CAGR of 45.2% during the forecast period 2026-2032.
Ans: The Hydrogen Boilers Market size in 2032 will be US$ 1833 million.
Ans: The main players in the Hydrogen Boilers Market are Bosch, Viessmann Climate Solutions (Carrier), Cochran, Babcock & Wilcox, Miura
Ans: The Applications covered in the Hydrogen Boilers Market report are Residential, Commercial, Industrial
Ans: The Types covered in the Hydrogen Boilers Market report are 100% Hydrogen Boilers, Hydrogen-Ready Boilers, Other