List of Tables
Table 1. VOCs Gas Treatment Market Trends
Table 2. VOCs Gas Treatment Market Drivers & Opportunity
Table 3. VOCs Gas Treatment Market Challenges
Table 4. VOCs Gas Treatment Market Restraints
Table 5. Global VOCs Gas Treatment Revenue by Company (2019-2024) & (US$ Million)
Table 6. Global VOCs Gas Treatment Revenue Market Share by Company (2019-2024)
Table 7. Key Companies VOCs Gas Treatment Manufacturing Base Distribution and Headquarters
Table 8. Key Companies VOCs Gas Treatment Product Type
Table 9. Key Companies Time to Begin Mass Production of VOCs Gas Treatment
Table 10. Global VOCs Gas Treatment Companies Market Concentration Ratio (CR5 and HHI)
Table 11. Global Top Companies Market Share by Company Type (Tier 1, Tier 2, and Tier 3) & (based on the Revenue in VOCs Gas Treatment as of 2023)
Table 12. Mergers & Acquisitions, Expansion Plans
Table 13. Global VOCs Gas Treatment Sales Value by Type: 2019 VS 2023 VS 2030 (US$ Million)
Table 14. Global VOCs Gas Treatment Sales Value by Type (2019-2024) & (US$ Million)
Table 15. Global VOCs Gas Treatment Sales Value by Type (2025-2030) & (US$ Million)
Table 16. Global VOCs Gas Treatment Sales Market Share in Value by Type (2019-2024) & (%)
Table 17. Global VOCs Gas Treatment Sales Market Share in Value by Type (2025-2030) & (%)
Table 18. Global VOCs Gas Treatment Sales Value by Application: 2019 VS 2023 VS 2030 (US$ Million)
Table 19. Global VOCs Gas Treatment Sales Value by Application (2019-2024) & (US$ Million)
Table 20. Global VOCs Gas Treatment Sales Value by Application (2025-2030) & (US$ Million)
Table 21. Global VOCs Gas Treatment Sales Market Share in Value by Application (2019-2024) & (%)
Table 22. Global VOCs Gas Treatment Sales Market Share in Value by Application (2025-2030) & (%)
Table 23. Global VOCs Gas Treatment Sales Value by Region: 2019 VS 2023 VS 2030 (US$ Million)
Table 24. Global VOCs Gas Treatment Sales Value by Region (2019-2024) & (US$ Million)
Table 25. Global VOCs Gas Treatment Sales Value by Region (2025-2030) & (US$ Million)
Table 26. Global VOCs Gas Treatment Sales Value by Region (2019-2024) & (%)
Table 27. Global VOCs Gas Treatment Sales Value by Region (2025-2030) & (%)
Table 28. Key Countries/Regions VOCs Gas Treatment Sales Value Growth Trends, (US$ Million): 2019 VS 2023 VS 2030
Table 29. Key Countries/Regions VOCs Gas Treatment Sales Value, (2019-2024) & (US$ Million)
Table 30. Key Countries/Regions VOCs Gas Treatment Sales Value, (2025-2030) & (US$ Million)
Table 31. Air Products Basic Information List
Table 32. Air Products Description and Business Overview
Table 33. Air Products VOCs Gas Treatment Products, Services and Solutions
Table 34. Revenue (US$ Million) in VOCs Gas Treatment Business of Air Products (2019-2024)
Table 35. Air Products Recent Developments
Table 36. Linde (Praxair) Basic Information List
Table 37. Linde (Praxair) Description and Business Overview
Table 38. Linde (Praxair) VOCs Gas Treatment Products, Services and Solutions
Table 39. Revenue (US$ Million) in VOCs Gas Treatment Business of Linde (Praxair) (2019-2024)
Table 40. Linde (Praxair) Recent Developments
Table 41. Wärtsilä Basic Information List
Table 42. Wärtsilä Description and Business Overview
Table 43. Wärtsilä VOCs Gas Treatment Products, Services and Solutions
Table 44. Revenue (US$ Million) in VOCs Gas Treatment Business of Wärtsilä (2019-2024)
Table 45. Wärtsilä Recent Developments
Table 46. Munters Basic Information List
Table 47. Munters Description and Business Overview
Table 48. Munters VOCs Gas Treatment Products, Services and Solutions
Table 49. Revenue (US$ Million) in VOCs Gas Treatment Business of Munters (2019-2024)
Table 50. Munters Recent Developments
Table 51. TOYOBO Basic Information List
Table 52. TOYOBO Description and Business Overview
Table 53. TOYOBO VOCs Gas Treatment Products, Services and Solutions
Table 54. Revenue (US$ Million) in VOCs Gas Treatment Business of TOYOBO (2019-2024)
Table 55. TOYOBO Recent Developments
Table 56. Taikisha Basic Information List
Table 57. Taikisha Description and Business Overview
Table 58. Taikisha VOCs Gas Treatment Products, Services and Solutions
Table 59. Revenue (US$ Million) in VOCs Gas Treatment Business of Taikisha (2019-2024)
Table 60. Taikisha Recent Developments
Table 61. Nippon Gases Basic Information List
Table 62. Nippon Gases Description and Business Overview
Table 63. Nippon Gases VOCs Gas Treatment Products, Services and Solutions
Table 64. Revenue (US$ Million) in VOCs Gas Treatment Business of Nippon Gases (2019-2024)
Table 65. Nippon Gases Recent Developments
Table 66. Calgon Carbon Corporation Basic Information List
Table 67. Calgon Carbon Corporation Description and Business Overview
Table 68. Calgon Carbon Corporation VOCs Gas Treatment Products, Services and Solutions
Table 69. Revenue (US$ Million) in VOCs Gas Treatment Business of Calgon Carbon Corporation (2019-2024)
Table 70. Calgon Carbon Corporation Recent Developments
Table 71. Condorchem Envitech Basic Information List
Table 72. Condorchem Envitech Description and Business Overview
Table 73. Condorchem Envitech VOCs Gas Treatment Products, Services and Solutions
Table 74. Revenue (US$ Million) in VOCs Gas Treatment Business of Condorchem Envitech (2019-2024)
Table 75. Condorchem Envitech Recent Developments
Table 76. Anguil Basic Information List
Table 77. Anguil Description and Business Overview
Table 78. Anguil VOCs Gas Treatment Products, Services and Solutions
Table 79. Revenue (US$ Million) in VOCs Gas Treatment Business of Anguil (2019-2024)
Table 80. Anguil Recent Developments
Table 81. ComEnCo Systems Basic Information List
Table 82. ComEnCo Systems Description and Business Overview
Table 83. ComEnCo Systems VOCs Gas Treatment Products, Services and Solutions
Table 84. Revenue (US$ Million) in VOCs Gas Treatment Business of ComEnCo Systems (2019-2024)
Table 85. ComEnCo Systems Recent Developments
Table 86. POLARIS SRL Basic Information List
Table 87. POLARIS SRL Description and Business Overview
Table 88. POLARIS SRL VOCs Gas Treatment Products, Services and Solutions
Table 89. Revenue (US$ Million) in VOCs Gas Treatment Business of POLARIS SRL (2019-2024)
Table 90. POLARIS SRL Recent Developments
Table 91. Bay Environmental Technology Basic Information List
Table 92. Bay Environmental Technology Description and Business Overview
Table 93. Bay Environmental Technology VOCs Gas Treatment Products, Services and Solutions
Table 94. Revenue (US$ Million) in VOCs Gas Treatment Business of Bay Environmental Technology (2019-2024)
Table 95. Bay Environmental Technology Recent Developments
Table 96. KVT Process Technology Basic Information List
Table 97. KVT Process Technology Description and Business Overview
Table 98. KVT Process Technology VOCs Gas Treatment Products, Services and Solutions
Table 99. Revenue (US$ Million) in VOCs Gas Treatment Business of KVT Process Technology (2019-2024)
Table 100. KVT Process Technology Recent Developments
Table 101. CECO Environmental Basic Information List
Table 102. CECO Environmental Description and Business Overview
Table 103. CECO Environmental VOCs Gas Treatment Products, Services and Solutions
Table 104. Revenue (US$ Million) in VOCs Gas Treatment Business of CECO Environmental (2019-2024)
Table 105. CECO Environmental Recent Developments
Table 106. SINOPEC Qingdao Safety Engineering Basic Information List
Table 107. SINOPEC Qingdao Safety Engineering Description and Business Overview
Table 108. SINOPEC Qingdao Safety Engineering VOCs Gas Treatment Products, Services and Solutions
Table 109. Revenue (US$ Million) in VOCs Gas Treatment Business of SINOPEC Qingdao Safety Engineering (2019-2024)
Table 110. SINOPEC Qingdao Safety Engineering Recent Developments
Table 111. Naide Basic Information List
Table 112. Naide Description and Business Overview
Table 113. Naide VOCs Gas Treatment Products, Services and Solutions
Table 114. Revenue (US$ Million) in VOCs Gas Treatment Business of Naide (2019-2024)
Table 115. Naide Recent Developments
Table 116. ECOTEC Basic Information List
Table 117. ECOTEC Description and Business Overview
Table 118. ECOTEC VOCs Gas Treatment Products, Services and Solutions
Table 119. Revenue (US$ Million) in VOCs Gas Treatment Business of ECOTEC (2019-2024)
Table 120. ECOTEC Recent Developments
Table 121. Beijing CEC Environmental Engineering Basic Information List
Table 122. Beijing CEC Environmental Engineering Description and Business Overview
Table 123. Beijing CEC Environmental Engineering VOCs Gas Treatment Products, Services and Solutions
Table 124. Revenue (US$ Million) in VOCs Gas Treatment Business of Beijing CEC Environmental Engineering (2019-2024)
Table 125. Beijing CEC Environmental Engineering Recent Developments
Table 126. WELLE Environmental Group Basic Information List
Table 127. WELLE Environmental Group Description and Business Overview
Table 128. WELLE Environmental Group VOCs Gas Treatment Products, Services and Solutions
Table 129. Revenue (US$ Million) in VOCs Gas Treatment Business of WELLE Environmental Group (2019-2024)
Table 130. WELLE Environmental Group Recent Developments
Table 131. Key Raw Materials Lists
Table 132. Raw Materials Key Suppliers Lists
Table 133. VOCs Gas Treatment Downstream Customers
Table 134. VOCs Gas Treatment Distributors List
Table 135. Research Programs/Design for This Report
Table 136. Key Data Information from Secondary Sources
Table 137. Key Data Information from Primary Sources
Table 138. Business Unit and Senior & Team Lead Analysts
List of Figures
Figure 1. VOCs Gas Treatment Product Picture
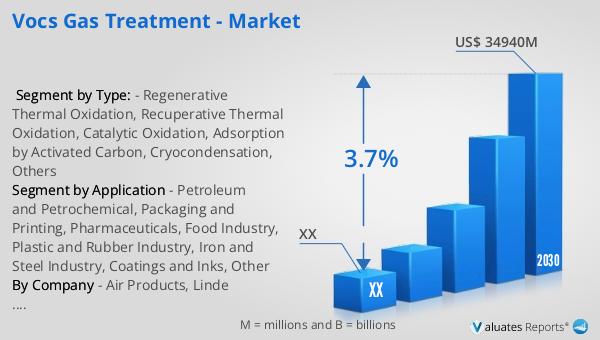
Figure 2. Global VOCs Gas Treatment Sales Value, 2019 VS 2023 VS 2030 (US$ Million)
Figure 3. Global VOCs Gas Treatment Sales Value (2019-2030) & (US$ Million)
Figure 4. VOCs Gas Treatment Report Years Considered
Figure 5. Global VOCs Gas Treatment Players Revenue Ranking (2023) & (US$ Million)
Figure 6. The 5 and 10 Largest Manufacturers in the World: Market Share by VOCs Gas Treatment Revenue in 2023
Figure 7. VOCs Gas Treatment Market Share by Company Type (Tier 1, Tier 2, and Tier 3): 2019 VS 2023
Figure 8. Regenerative Thermal Oxidation Picture
Figure 9. Recuperative Thermal Oxidation Picture
Figure 10. Catalytic Oxidation Picture
Figure 11. Adsorption by Activated Carbon Picture
Figure 12. Cryocondensation Picture
Figure 13. Others Picture
Figure 14. Global VOCs Gas Treatment Sales Value by Type (2019 VS 2023 VS 2030) & (US$ Million)
Figure 15. Global VOCs Gas Treatment Sales Value Market Share by Type, 2023 & 2030
Figure 16. Product Picture of Petroleum and Petrochemical
Figure 17. Product Picture of Packaging and Printing
Figure 18. Product Picture of Pharmaceuticals
Figure 19. Product Picture of Food Industry
Figure 20. Product Picture of Plastic and Rubber Industry
Figure 21. Product Picture of Iron and Steel Industry
Figure 22. Product Picture of Coatings and Inks
Figure 23. Product Picture of Other
Figure 24. Global VOCs Gas Treatment Sales Value by Application (2019 VS 2023 VS 2030) & (US$ Million)
Figure 25. Global VOCs Gas Treatment Sales Value Market Share by Application, 2023 & 2030
Figure 26. North America VOCs Gas Treatment Sales Value (2019-2030) & (US$ Million)
Figure 27. North America VOCs Gas Treatment Sales Value by Country (%), 2023 VS 2030
Figure 28. Europe VOCs Gas Treatment Sales Value (2019-2030) & (US$ Million)
Figure 29. Europe VOCs Gas Treatment Sales Value by Country (%), 2023 VS 2030
Figure 30. Asia Pacific VOCs Gas Treatment Sales Value (2019-2030) & (US$ Million)
Figure 31. Asia Pacific VOCs Gas Treatment Sales Value by Country (%), 2023 VS 2030
Figure 32. South America VOCs Gas Treatment Sales Value (2019-2030) & (US$ Million)
Figure 33. South America VOCs Gas Treatment Sales Value by Country (%), 2023 VS 2030
Figure 34. Middle East & Africa VOCs Gas Treatment Sales Value (2019-2030) & (US$ Million)
Figure 35. Middle East & Africa VOCs Gas Treatment Sales Value by Country (%), 2023 VS 2030
Figure 36. Key Countries/Regions VOCs Gas Treatment Sales Value (%), (2019-2030)
Figure 37. United States VOCs Gas Treatment Sales Value, (2019-2030) & (US$ Million)
Figure 38. United States VOCs Gas Treatment Sales Value by Type (%), 2023 VS 2030
Figure 39. United States VOCs Gas Treatment Sales Value by Application (%), 2023 VS 2030
Figure 40. Europe VOCs Gas Treatment Sales Value, (2019-2030) & (US$ Million)
Figure 41. Europe VOCs Gas Treatment Sales Value by Type (%), 2023 VS 2030
Figure 42. Europe VOCs Gas Treatment Sales Value by Application (%), 2023 VS 2030
Figure 43. China VOCs Gas Treatment Sales Value, (2019-2030) & (US$ Million)
Figure 44. China VOCs Gas Treatment Sales Value by Type (%), 2023 VS 2030
Figure 45. China VOCs Gas Treatment Sales Value by Application (%), 2023 VS 2030
Figure 46. Japan VOCs Gas Treatment Sales Value, (2019-2030) & (US$ Million)
Figure 47. Japan VOCs Gas Treatment Sales Value by Type (%), 2023 VS 2030
Figure 48. Japan VOCs Gas Treatment Sales Value by Application (%), 2023 VS 2030
Figure 49. South Korea VOCs Gas Treatment Sales Value, (2019-2030) & (US$ Million)
Figure 50. South Korea VOCs Gas Treatment Sales Value by Type (%), 2023 VS 2030
Figure 51. South Korea VOCs Gas Treatment Sales Value by Application (%), 2023 VS 2030
Figure 52. Southeast Asia VOCs Gas Treatment Sales Value, (2019-2030) & (US$ Million)
Figure 53. Southeast Asia VOCs Gas Treatment Sales Value by Type (%), 2023 VS 2030
Figure 54. Southeast Asia VOCs Gas Treatment Sales Value by Application (%), 2023 VS 2030
Figure 55. India VOCs Gas Treatment Sales Value, (2019-2030) & (US$ Million)
Figure 56. India VOCs Gas Treatment Sales Value by Type (%), 2023 VS 2030
Figure 57. India VOCs Gas Treatment Sales Value by Application (%), 2023 VS 2030
Figure 58. VOCs Gas Treatment Industrial Chain
Figure 59. VOCs Gas Treatment Manufacturing Cost Structure
Figure 60. Channels of Distribution (Direct Sales, and Distribution)
Figure 61. Bottom-up and Top-down Approaches for This Report
Figure 62. Data Triangulation