List of Tables
Table 1. Thermoplastic Elastomers (TPE) Compounds CAGR in Value, India VS Global, 2018 VS 2022 VS 2029
Table 2. Thermoplastic Elastomers (TPE) Compounds Market Trends
Table 3. Thermoplastic Elastomers (TPE) Compounds Market Drivers
Table 4. Thermoplastic Elastomers (TPE) Compounds Market Challenges
Table 5. Thermoplastic Elastomers (TPE) Compounds Market Restraints
Table 6. Global Thermoplastic Elastomers (TPE) Compounds Sales Growth Rate (CAGR) by Type: 2018 VS 2022 VS 2029 (US$ Million)
Table 7. India Thermoplastic Elastomers (TPE) Compounds Sales Growth Rate (CAGR) by Type: 2018 VS 2022 VS 2029 (US$ Million)
Table 8. Global Thermoplastic Elastomers (TPE) Compounds Sales Growth Rate (CAGR) by Application: 2018 VS 2022 VS 2029 (US$ Million)
Table 9. India Thermoplastic Elastomers (TPE) Compounds Sales Growth Rate (CAGR) by Application: 2018 VS 2022 VS 2029 (US$ Million)
Table 10. Global Key Manufacturers of Thermoplastic Elastomers (TPE) Compounds, Ranked by Revenue (2022) & (US$ Million)
Table 11. Global Thermoplastic Elastomers (TPE) Compounds Revenue by Manufacturer, (US$ Million), 2018-2023
Table 12. Global Thermoplastic Elastomers (TPE) Compounds Revenue Share by Manufacturer, 2018-2023
Table 13. Global Thermoplastic Elastomers (TPE) Compounds Sales by Manufacturer, (K MT), 2018-2023
Table 14. Global Thermoplastic Elastomers (TPE) Compounds Sales Share by Manufacturer, 2018-2023
Table 15. Global Thermoplastic Elastomers (TPE) Compounds Price by Manufacturer (2018-2023) & (USD/MT)
Table 16. Global Thermoplastic Elastomers (TPE) Compounds Manufacturers Market Concentration Ratio (CR5 and HHI)
Table 17. Global Thermoplastic Elastomers (TPE) Compounds by Company Type (Tier 1, Tier 2, and Tier 3) & (based on the Revenue in Thermoplastic Elastomers (TPE) Compounds as of 2022)
Table 18. Global Key Manufacturers of Thermoplastic Elastomers (TPE) Compounds, Manufacturing Base Distribution and Headquarters
Table 19. Global Key Manufacturers of Thermoplastic Elastomers (TPE) Compounds, Product Offered and Application
Table 20. Global Key Manufacturers of Thermoplastic Elastomers (TPE) Compounds, Date of Enter into This Industry
Table 21. Manufacturers Mergers & Acquisitions, Expansion Plans
Table 22. Key Players of Thermoplastic Elastomers (TPE) Compounds in India, Ranked by Revenue (2022) & (US$ million)
Table 23. India Thermoplastic Elastomers (TPE) Compounds Revenue by Players, (US$ Million), (2018-2023)
Table 24. India Thermoplastic Elastomers (TPE) Compounds Revenue Share by Players, (2018-2023)
Table 25. India Thermoplastic Elastomers (TPE) Compounds Sales by Players, (K MT), (2018-2023)
Table 26. India Thermoplastic Elastomers (TPE) Compounds Sales Share by Players, (2018-2023)
Table 27. Global Thermoplastic Elastomers (TPE) Compounds Market Size Growth Rate (CAGR) by Region (US$ Million): 2018 VS 2022 VS 2029
Table 28. Global Thermoplastic Elastomers (TPE) Compounds Sales in Volume by Region (2018-2023) & (K MT)
Table 29. Global Thermoplastic Elastomers (TPE) Compounds Sales in Volume Forecast by Region (2024-2029) & (K MT)
Table 30. Global Thermoplastic Elastomers (TPE) Compounds Sales in Value by Region (2018-2023) & (US$ Million)
Table 31. Global Thermoplastic Elastomers (TPE) Compounds Sales in Value Forecast by Region (2024-2029) & (US$ Million)
Table 32. Americas Thermoplastic Elastomers (TPE) Compounds Market Size Growth Rate (CAGR) by Country (US$ Million): 2018 VS 2022 VS 2029
Table 33. Americas Thermoplastic Elastomers (TPE) Compounds Sales in Value by Country (2018-2023) & (US$ Million)
Table 34. Americas Thermoplastic Elastomers (TPE) Compounds Sales in Value by Country (2024-2029) & (US$ Million)
Table 35. Americas Thermoplastic Elastomers (TPE) Compounds Sales in Volume by Country (2018-2023) & (K MT)
Table 36. Americas Thermoplastic Elastomers (TPE) Compounds Sales in Volume by Country (2024-2029) & (K MT)
Table 37. EMEA Thermoplastic Elastomers (TPE) Compounds Market Size Growth Rate (CAGR) by Country (US$ Million): 2018 VS 2022 VS 2029
Table 38. EMEA Thermoplastic Elastomers (TPE) Compounds Sales in Value by Country (2018-2023) & (US$ Million)
Table 39. EMEA Thermoplastic Elastomers (TPE) Compounds Sales in Value by Country (2024-2029) & (US$ Million)
Table 40. EMEA Thermoplastic Elastomers (TPE) Compounds Sales in Volume by Country (2018-2023) & (K MT)
Table 41. EMEA Thermoplastic Elastomers (TPE) Compounds Sales in Volume by Country (2024-2029) & (K MT)
Table 42. APAC Thermoplastic Elastomers (TPE) Compounds Market Size Growth Rate (CAGR) by Country (US$ Million): 2018 VS 2022 VS 2029
Table 43. APAC Thermoplastic Elastomers (TPE) Compounds Sales in Value by Country (2018-2023) & (US$ Million)
Table 44. APAC Thermoplastic Elastomers (TPE) Compounds Sales in Value by Country (2024-2029) & (US$ Million)
Table 45. APAC Thermoplastic Elastomers (TPE) Compounds Sales in Volume by Country (2018-2023) & (K MT)
Table 46. APAC Thermoplastic Elastomers (TPE) Compounds Sales in Volume by Country (2024-2029) & (K MT)
Table 47. Kraton Polymers Company Information
Table 48. Kraton Polymers Description and Business Overview
Table 49. Kraton Polymers Thermoplastic Elastomers (TPE) Compounds Sales (K MT), Revenue (US$ Million), Price (USD/MT) and Gross Margin (2018-2023)
Table 50. Kraton Polymers Thermoplastic Elastomers (TPE) Compounds Product
Table 51. Kraton Polymers Recent Development
Table 52. Dynasol Company Information
Table 53. Dynasol Description and Business Overview
Table 54. Dynasol Thermoplastic Elastomers (TPE) Compounds Sales (K MT), Revenue (US$ Million), Price (USD/MT) and Gross Margin (2018-2023)
Table 55. Dynasol Thermoplastic Elastomers (TPE) Compounds Product
Table 56. Dynasol Recent Development
Table 57. LG Chem Company Information
Table 58. LG Chem Description and Business Overview
Table 59. LG Chem Thermoplastic Elastomers (TPE) Compounds Sales (K MT), Revenue (US$ Million), Price (USD/MT) and Gross Margin (2018-2023)
Table 60. LG Chem Thermoplastic Elastomers (TPE) Compounds Product
Table 61. LG Chem Recent Development
Table 62. INEOS Styrolution Company Information
Table 63. INEOS Styrolution Description and Business Overview
Table 64. INEOS Styrolution Thermoplastic Elastomers (TPE) Compounds Sales (K MT), Revenue (US$ Million), Price (USD/MT) and Gross Margin (2018-2023)
Table 65. INEOS Styrolution Thermoplastic Elastomers (TPE) Compounds Product
Table 66. INEOS Styrolution Recent Development
Table 67. Avient Corporation Company Information
Table 68. Avient Corporation Description and Business Overview
Table 69. Avient Corporation Thermoplastic Elastomers (TPE) Compounds Sales (K MT), Revenue (US$ Million), Price (USD/MT) and Gross Margin (2018-2023)
Table 70. Avient Corporation Thermoplastic Elastomers (TPE) Compounds Product
Table 71. Avient Corporation Recent Development
Table 72. Asahi Chemical Company Information
Table 73. Asahi Chemical Description and Business Overview
Table 74. Asahi Chemical Thermoplastic Elastomers (TPE) Compounds Sales (K MT), Revenue (US$ Million), Price (USD/MT) and Gross Margin (2018-2023)
Table 75. Asahi Chemical Thermoplastic Elastomers (TPE) Compounds Product
Table 76. Asahi Chemical Recent Development
Table 77. Versalis Company Information
Table 78. Versalis Description and Business Overview
Table 79. Versalis Thermoplastic Elastomers (TPE) Compounds Sales (K MT), Revenue (US$ Million), Price (USD/MT) and Gross Margin (2018-2023)
Table 80. Versalis Thermoplastic Elastomers (TPE) Compounds Product
Table 81. Versalis Recent Development
Table 82. Mitsubishi Chemical Company Information
Table 83. Mitsubishi Chemical Description and Business Overview
Table 84. Mitsubishi Chemical Thermoplastic Elastomers (TPE) Compounds Sales (K MT), Revenue (US$ Million), Price (USD/MT) and Gross Margin (2018-2023)
Table 85. Mitsubishi Chemical Thermoplastic Elastomers (TPE) Compounds Product
Table 86. Mitsubishi Chemical Recent Development
Table 87. Sibur Company Information
Table 88. Sibur Description and Business Overview
Table 89. Sibur Thermoplastic Elastomers (TPE) Compounds Sales (K MT), Revenue (US$ Million), Price (USD/MT) and Gross Margin (2018-2023)
Table 90. Sibur Thermoplastic Elastomers (TPE) Compounds Product
Table 91. Sibur Recent Development
Table 92. Kumho Petrochemical Company Information
Table 93. Kumho Petrochemical Description and Business Overview
Table 94. Kumho Petrochemical Thermoplastic Elastomers (TPE) Compounds Sales (K MT), Revenue (US$ Million), Price (USD/MT) and Gross Margin (2018-2023)
Table 95. Kumho Petrochemical Thermoplastic Elastomers (TPE) Compounds Product
Table 96. Kumho Petrochemical Recent Development
Table 97. Celanese (ExxonMobil) Company Information
Table 98. Celanese (ExxonMobil) Description and Business Overview
Table 99. Celanese (ExxonMobil) Thermoplastic Elastomers (TPE) Compounds Sales (K MT), Revenue (US$ Million), Price (USD/MT) and Gross Margin (2018-2023)
Table 100. Celanese (ExxonMobil) Thermoplastic Elastomers (TPE) Compounds Product
Table 101. Celanese (ExxonMobil) Recent Development
Table 102. Eneos (JSR) Company Information
Table 103. Eneos (JSR) Description and Business Overview
Table 104. Eneos (JSR) Thermoplastic Elastomers (TPE) Compounds Sales (K MT), Revenue (US$ Million), Price (USD/MT) and Gross Margin (2018-2023)
Table 105. Eneos (JSR) Thermoplastic Elastomers (TPE) Compounds Product
Table 106. Eneos (JSR) Recent Development
Table 107. Kuraray Company Information
Table 108. Kuraray Description and Business Overview
Table 109. Kuraray Thermoplastic Elastomers (TPE) Compounds Sales (K MT), Revenue (US$ Million), Price (USD/MT) and Gross Margin (2018-2023)
Table 110. Kuraray Thermoplastic Elastomers (TPE) Compounds Product
Table 111. Kuraray Recent Development
Table 112. DuPont Company Information
Table 113. DuPont Description and Business Overview
Table 114. DuPont Thermoplastic Elastomers (TPE) Compounds Sales (K MT), Revenue (US$ Million), Price (USD/MT) and Gross Margin (2018-2023)
Table 115. DuPont Thermoplastic Elastomers (TPE) Compounds Product
Table 116. DuPont Recent Development
Table 117. HEXPOL Company Information
Table 118. HEXPOL Description and Business Overview
Table 119. HEXPOL Thermoplastic Elastomers (TPE) Compounds Sales (K MT), Revenue (US$ Million), Price (USD/MT) and Gross Margin (2018-2023)
Table 120. HEXPOL Thermoplastic Elastomers (TPE) Compounds Product
Table 121. HEXPOL Recent Development
Table 122. Sinopec Company Information
Table 123. Sinopec Description and Business Overview
Table 124. Sinopec Thermoplastic Elastomers (TPE) Compounds Sales (K MT), Revenue (US$ Million), Price (USD/MT) and Gross Margin (2018-2023)
Table 125. Sinopec Thermoplastic Elastomers (TPE) Compounds Product
Table 126. Sinopec Recent Development
Table 127. LCY Technology Corp Company Information
Table 128. LCY Technology Corp Description and Business Overview
Table 129. LCY Technology Corp Thermoplastic Elastomers (TPE) Compounds Sales (K MT), Revenue (US$ Million), Price (USD/MT) and Gross Margin (2018-2023)
Table 130. LCY Technology Corp Thermoplastic Elastomers (TPE) Compounds Product
Table 131. LCY Technology Corp Recent Development
Table 132. Taiwan Synthetic Rubber Corp Company Information
Table 133. Taiwan Synthetic Rubber Corp Description and Business Overview
Table 134. Taiwan Synthetic Rubber Corp Thermoplastic Elastomers (TPE) Compounds Sales (K MT), Revenue (US$ Million), Price (USD/MT) and Gross Margin (2018-2023)
Table 135. Taiwan Synthetic Rubber Corp Thermoplastic Elastomers (TPE) Compounds Product
Table 136. Taiwan Synthetic Rubber Corp Recent Development
Table 137. CNPC Company Information
Table 138. CNPC Description and Business Overview
Table 139. CNPC Thermoplastic Elastomers (TPE) Compounds Sales (K MT), Revenue (US$ Million), Price (USD/MT) and Gross Margin (2018-2023)
Table 140. CNPC Thermoplastic Elastomers (TPE) Compounds Product
Table 141. CNPC Recent Development
Table 142. CHIMEI Company Information
Table 143. CHIMEI Description and Business Overview
Table 144. CHIMEI Thermoplastic Elastomers (TPE) Compounds Sales (K MT), Revenue (US$ Million), Price (USD/MT) and Gross Margin (2018-2023)
Table 145. CHIMEI Thermoplastic Elastomers (TPE) Compounds Product
Table 146. CHIMEI Recent Development
Table 147. Ningbo Changhong Polymer Scientific & Technical Inc. Company Information
Table 148. Ningbo Changhong Polymer Scientific & Technical Inc. Description and Business Overview
Table 149. Ningbo Changhong Polymer Scientific & Technical Inc. Thermoplastic Elastomers (TPE) Compounds Sales (K MT), Revenue (US$ Million), Price (USD/MT) and Gross Margin (2018-2023)
Table 150. Ningbo Changhong Polymer Scientific & Technical Inc. Thermoplastic Elastomers (TPE) Compounds Product
Table 151. Ningbo Changhong Polymer Scientific & Technical Inc. Recent Development
Table 152. Key Raw Materials Lists
Table 153. Raw Materials Key Suppliers Lists
Table 154. Thermoplastic Elastomers (TPE) Compounds Customers List
Table 155. Thermoplastic Elastomers (TPE) Compounds Distributors List
Table 156. Research Programs/Design for This Report
Table 157. Key Data Information from Secondary Sources
Table 158. Key Data Information from Primary Sources
List of Figures
Figure 1. Thermoplastic Elastomers (TPE) Compounds Product Picture
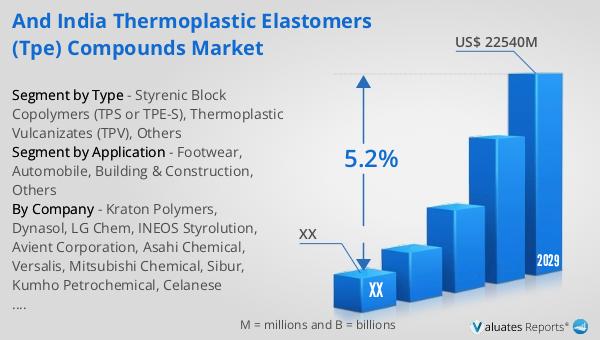
Figure 2. Global Thermoplastic Elastomers (TPE) Compounds Revenue, (US$ Million), 2018 VS 2022 VS 2029
Figure 3. Global Thermoplastic Elastomers (TPE) Compounds Market Size 2018-2029 (US$ Million)
Figure 4. Global Thermoplastic Elastomers (TPE) Compounds Sales 2018-2029 (K MT)
Figure 5. India Thermoplastic Elastomers (TPE) Compounds Revenue, (US$ Million), 2018 VS 2022 VS 2029
Figure 6. India Thermoplastic Elastomers (TPE) Compounds Market Size 2018-2029 (US$ Million)
Figure 7. India Thermoplastic Elastomers (TPE) Compounds Sales 2018-2029 (K MT)
Figure 8. India Thermoplastic Elastomers (TPE) Compounds Market Share in Global, in Value (US$ Million) 2018-2029
Figure 9. India Thermoplastic Elastomers (TPE) Compounds Market Share in Global, in Volume (K MT) 2018-2029
Figure 10. Thermoplastic Elastomers (TPE) Compounds Report Years Considered
Figure 11. Product Picture of Styrenic Block Copolymers (TPS or TPE-S)
Figure 12. Product Picture of Thermoplastic Vulcanizates (TPV)
Figure 13. Product Picture of Others
Figure 14. Global Thermoplastic Elastomers (TPE) Compounds Market Share by Type in 2022 & 2029
Figure 15. Global Thermoplastic Elastomers (TPE) Compounds Sales in Value by Type (2018-2029) & (US$ Million)
Figure 16. Global Thermoplastic Elastomers (TPE) Compounds Sales Market Share in Value by Type (2018-2029)
Figure 17. Global Thermoplastic Elastomers (TPE) Compounds Sales by Type (2018-2029) & (K MT)
Figure 18. Global Thermoplastic Elastomers (TPE) Compounds Sales Market Share in Volume by Type (2018-2029)
Figure 19. Global Thermoplastic Elastomers (TPE) Compounds Price by Type (2018-2029) & (USD/MT)
Figure 20. India Thermoplastic Elastomers (TPE) Compounds Market Share by Type in 2022 & 2029
Figure 21. India Thermoplastic Elastomers (TPE) Compounds Sales in Value by Type (2018-2029) & (US$ Million)
Figure 22. India Thermoplastic Elastomers (TPE) Compounds Sales Market Share in Value by Type (2018-2029)
Figure 23. India Thermoplastic Elastomers (TPE) Compounds Sales by Type (2018-2029) & (K MT)
Figure 24. India Thermoplastic Elastomers (TPE) Compounds Sales Market Share in Volume by Type (2018-2029)
Figure 25. India Thermoplastic Elastomers (TPE) Compounds Price by Type (2018-2029) & (USD/MT)
Figure 26. Product Picture of Footwear
Figure 27. Product Picture of Automobile
Figure 28. Product Picture of Building & Construction
Figure 29. Product Picture of Others
Figure 30. Global Thermoplastic Elastomers (TPE) Compounds Market Share by Application in 2022 & 2029
Figure 31. Global Thermoplastic Elastomers (TPE) Compounds Sales in Value by Application (2018-2029) & (US$ Million)
Figure 32. Global Thermoplastic Elastomers (TPE) Compounds Sales Market Share in Value by Application (2018-2029)
Figure 33. Global Thermoplastic Elastomers (TPE) Compounds Sales by Application (2018-2029) & (K MT)
Figure 34. Global Thermoplastic Elastomers (TPE) Compounds Sales Market Share in Volume by Application (2018-2029)
Figure 35. Global Thermoplastic Elastomers (TPE) Compounds Price by Application (2018-2029) & (USD/MT)
Figure 36. India Thermoplastic Elastomers (TPE) Compounds Market Share by Application in 2022 & 2029
Figure 37. India Thermoplastic Elastomers (TPE) Compounds Sales in Value by Application (2018-2029) & (US$ Million)
Figure 38. India Thermoplastic Elastomers (TPE) Compounds Sales Market Share in Value by Application (2018-2029)
Figure 39. India Thermoplastic Elastomers (TPE) Compounds Sales by Application (2018-2029) & (K MT)
Figure 40. India Thermoplastic Elastomers (TPE) Compounds Sales Market Share in Volume by Application (2018-2029)
Figure 41. India Thermoplastic Elastomers (TPE) Compounds Price by Application (2018-2029) & (USD/MT)
Figure 42. Americas Thermoplastic Elastomers (TPE) Compounds Sales in Volume Growth Rate 2018-2029 (K MT)
Figure 43. Americas Thermoplastic Elastomers (TPE) Compounds Sales in Value Growth Rate 2018-2029 (US$ Million)
Figure 44. Americas Thermoplastic Elastomers (TPE) Compounds Sales by Type (2018-2029) & (K MT)
Figure 45. Americas Thermoplastic Elastomers (TPE) Compounds Sales Market Share in Volume by Type (2018-2029)
Figure 46. Americas Thermoplastic Elastomers (TPE) Compounds Sales by Application (2018-2029) & (K MT)
Figure 47. Americas Thermoplastic Elastomers (TPE) Compounds Sales Market Share in Volume by Application (2018-2029)
Figure 48. United States Thermoplastic Elastomers (TPE) Compounds Sales in Value Growth Rate (2018-2029) & (US$ Million)
Figure 49. Canada Thermoplastic Elastomers (TPE) Compounds Sales in Value Growth Rate (2018-2029) & (US$ Million)
Figure 50. Mexico Thermoplastic Elastomers (TPE) Compounds Sales in Value Growth Rate (2018-2029) & (US$ Million)
Figure 51. Brazil Thermoplastic Elastomers (TPE) Compounds Sales in Value Growth Rate (2018-2029) & (US$ Million)
Figure 52. EMEA Thermoplastic Elastomers (TPE) Compounds Sales in Volume Growth Rate 2018-2029 (K MT)
Figure 53. EMEA Thermoplastic Elastomers (TPE) Compounds Sales in Value Growth Rate 2018-2029 (US$ Million)
Figure 54. EMEA Thermoplastic Elastomers (TPE) Compounds Sales by Type (2018-2029) & (K MT)
Figure 55. EMEA Thermoplastic Elastomers (TPE) Compounds Sales Market Share in Volume by Type (2018-2029)
Figure 56. EMEA Thermoplastic Elastomers (TPE) Compounds Sales by Application (2018-2029) & (K MT)
Figure 57. EMEA Thermoplastic Elastomers (TPE) Compounds Sales Market Share in Volume by Application (2018-2029)
Figure 58. Europe Thermoplastic Elastomers (TPE) Compounds Sales in Value Growth Rate (2018-2029) & (US$ Million)
Figure 59. Middle East Thermoplastic Elastomers (TPE) Compounds Sales in Value Growth Rate (2018-2029) & (US$ Million)
Figure 60. Africa Thermoplastic Elastomers (TPE) Compounds Sales in Value Growth Rate (2018-2029) & (US$ Million)
Figure 61. China Thermoplastic Elastomers (TPE) Compounds Sales in Volume Growth Rate 2018-2029 (K MT)
Figure 62. China Thermoplastic Elastomers (TPE) Compounds Sales in Value Growth Rate 2018-2029 (US$ Million)
Figure 63. China Thermoplastic Elastomers (TPE) Compounds Sales by Type (2018-2029) & (K MT)
Figure 64. China Thermoplastic Elastomers (TPE) Compounds Sales Market Share in Volume by Type (2018-2029)
Figure 65. China Thermoplastic Elastomers (TPE) Compounds Sales by Application (2018-2029) & (K MT)
Figure 66. China Thermoplastic Elastomers (TPE) Compounds Sales Market Share in Volume by Application (2018-2029)
Figure 67. APAC Thermoplastic Elastomers (TPE) Compounds Sales in Volume Growth Rate 2018-2029 (K MT)
Figure 68. APAC Thermoplastic Elastomers (TPE) Compounds Sales in Value Growth Rate 2018-2029 (US$ Million)
Figure 69. APAC Thermoplastic Elastomers (TPE) Compounds Sales by Type (2018-2029) & (K MT)
Figure 70. APAC Thermoplastic Elastomers (TPE) Compounds Sales Market Share in Volume by Type (2018-2029)
Figure 71. APAC Thermoplastic Elastomers (TPE) Compounds Sales by Application (2018-2029) & (K MT)
Figure 72. APAC Thermoplastic Elastomers (TPE) Compounds Sales Market Share in Volume by Application (2018-2029)
Figure 73. Japan Thermoplastic Elastomers (TPE) Compounds Sales in Value Growth Rate (2018-2029) & (US$ Million)
Figure 74. South Korea Thermoplastic Elastomers (TPE) Compounds Sales in Value Growth Rate (2018-2029) & (US$ Million)
Figure 75. China Taiwan Thermoplastic Elastomers (TPE) Compounds Sales in Value Growth Rate (2018-2029) & (US$ Million)
Figure 76. Southeast Asia Thermoplastic Elastomers (TPE) Compounds Sales in Value Growth Rate (2018-2029) & (US$ Million)
Figure 77. India Thermoplastic Elastomers (TPE) Compounds Sales in Value Growth Rate (2018-2029) & (US$ Million)
Figure 78. Thermoplastic Elastomers (TPE) Compounds Value Chain
Figure 79. Thermoplastic Elastomers (TPE) Compounds Production Process
Figure 80. Channels of Distribution
Figure 81. Distributors Profiles
Figure 82. Bottom-up and Top-down Approaches for This Report
Figure 83. Data Triangulation
Figure 84. Key Executives Interviewed