List of Tables
Table 1. Global Digital Farming Technology Market Size Growth Rate by Type (US$ Million): 2021 vs 2025 vs 2032
Table 2. Key Players of Hardware and Embedded Control
Table 3. Key Players of Software Platforms
Table 4. Key Players of Data Products
Table 5. Key Players of Others
Table 6. Global Digital Farming Technology Market Size Growth Rate by Solution (US$ Million): 2021 vs 2025 vs 2032
Table 7. Key Players of End To End Farm Digitalization
Table 8. Key Players of Field Operations Systems
Table 9. Key Players of Monitoring and Analytics Systems
Table 10. Key Players of Others
Table 11. Global Digital Farming Technology Market Size Growth Rate by Deployment Model (US$ Million): 2021 vs 2025 vs 2032
Table 12. Key Players of Cloud SaaS
Table 13. Key Players of Hybrid Cloud and Edge
Table 14. Key Players of On Premise
Table 15. Global Digital Farming Technology Market Size Growth Rate by Automation Level (US$ Million): 2021 vs 2025 vs 2032
Table 16. Key Players of Decision Support
Table 17. Key Players of Assisted Automation
Table 18. Key Players of Autonomous Operation
Table 19. Key Players of Others
Table 20. Global Digital Farming Technology Market Size Growth by Application (US$ Million): 2021 vs 2025 vs 2032
Table 21. Global Digital Farming Technology Market Size by Region (US$ Million): 2021 vs 2025 vs 2032
Table 22. Global Digital Farming Technology Market Size by Region (US$ Million), 2021–2026
Table 23. Global Digital Farming Technology Market Share by Region (2021–2026)
Table 24. Global Digital Farming Technology Forecasted Market Size by Region (US$ Million), 2027–2032
Table 25. Global Digital Farming Technology Market Share by Region (2027–2032)
Table 26. Digital Farming Technology Market Trends
Table 27. Digital Farming Technology Market Drivers
Table 28. Digital Farming Technology Market Challenges
Table 29. Digital Farming Technology Market Restraints
Table 30. Global Digital Farming Technology Revenue by Players (US$ Million), 2021–2026
Table 31. Global Digital Farming Technology Market Share by Players (2021–2026)
Table 32. Global Top Digital Farming Technology Players by Tier (Tier 1, Tier 2, and Tier 3), based on Digital Farming Technology Revenue, 2025
Table 33. Ranking of Global Top Digital Farming Technology Companies by Revenue (US$ Million) in 2025
Table 34. Global 5 Largest Players Market Share by Digital Farming Technology Revenue (CR5 and HHI), 2021–2026
Table 35. Global Key Players of Digital Farming Technology, Headquarters and Area Served
Table 36. Global Key Players of Digital Farming Technology, Products and Applications
Table 37. Global Key Players of Digital Farming Technology, Date of General Availability (GA)
Table 38. Mergers and Acquisitions, Expansion Plans
Table 39. Global Digital Farming Technology Market Size by Type (US$ Million), 2021–2026
Table 40. Global Digital Farming Technology Revenue Market Share by Type (2021–2026)
Table 41. Global Digital Farming Technology Forecasted Market Size by Type (US$ Million), 2027–2032
Table 42. Global Digital Farming Technology Revenue Market Share by Type (2027–2032)
Table 43. Global Digital Farming Technology Market Size by Application (US$ Million), 2021–2026
Table 44. Global Digital Farming Technology Revenue Market Share by Application (2021–2026)
Table 45. Global Digital Farming Technology Forecasted Market Size by Application (US$ Million), 2027–2032
Table 46. Global Digital Farming Technology Revenue Market Share by Application (2027–2032)
Table 47. North America Digital Farming Technology Market Size Growth Rate by Country (US$ Million): 2021 vs 2025 vs 2032
Table 48. North America Digital Farming Technology Market Size by Country (US$ Million), 2021–2026
Table 49. North America Digital Farming Technology Market Size by Country (US$ Million), 2027–2032
Table 50. Europe Digital Farming Technology Market Size Growth Rate by Country (US$ Million): 2021 vs 2025 vs 2032
Table 51. Europe Digital Farming Technology Market Size by Country (US$ Million), 2021–2026
Table 52. Europe Digital Farming Technology Market Size by Country (US$ Million), 2027–2032
Table 53. Asia-Pacific Digital Farming Technology Market Size Growth Rate by Region (US$ Million): 2021 vs 2025 vs 2032
Table 54. Asia-Pacific Digital Farming Technology Market Size by Region (US$ Million), 2021–2026
Table 55. Asia-Pacific Digital Farming Technology Market Size by Region (US$ Million), 2027–2032
Table 56. Latin America Digital Farming Technology Market Size Growth Rate by Country (US$ Million): 2021 vs 2025 vs 2032
Table 57. Latin America Digital Farming Technology Market Size by Country (US$ Million), 2021–2026
Table 58. Latin America Digital Farming Technology Market Size by Country (US$ Million), 2027–2032
Table 59. Middle East & Africa Digital Farming Technology Market Size Growth Rate by Country (US$ Million): 2021 vs 2025 vs 2032
Table 60. Middle East & Africa Digital Farming Technology Market Size by Country (US$ Million), 2021–2026
Table 61. Middle East & Africa Digital Farming Technology Market Size by Country (US$ Million), 2027–2032
Table 62. Deere & Company Company Details
Table 63. Deere & Company Business Overview
Table 64. Deere & Company Digital Farming Technology Product
Table 65. Deere & Company Revenue in Digital Farming Technology Business (US$ Million), 2021–2026
Table 66. Deere & Company Recent Development
Table 67. CNH Industrial N.V. Company Details
Table 68. CNH Industrial N.V. Business Overview
Table 69. CNH Industrial N.V. Digital Farming Technology Product
Table 70. CNH Industrial N.V. Revenue in Digital Farming Technology Business (US$ Million), 2021–2026
Table 71. CNH Industrial N.V. Recent Development
Table 72. AGCO Corporation Company Details
Table 73. AGCO Corporation Business Overview
Table 74. AGCO Corporation Digital Farming Technology Product
Table 75. AGCO Corporation Revenue in Digital Farming Technology Business (US$ Million), 2021–2026
Table 76. AGCO Corporation Recent Development
Table 77. Kubota Corporation Company Details
Table 78. Kubota Corporation Business Overview
Table 79. Kubota Corporation Digital Farming Technology Product
Table 80. Kubota Corporation Revenue in Digital Farming Technology Business (US$ Million), 2021–2026
Table 81. Kubota Corporation Recent Development
Table 82. Topcon Corporation Company Details
Table 83. Topcon Corporation Business Overview
Table 84. Topcon Corporation Digital Farming Technology Product
Table 85. Topcon Corporation Revenue in Digital Farming Technology Business (US$ Million), 2021–2026
Table 86. Topcon Corporation Recent Development
Table 87. CLAAS KGaA mbH Company Details
Table 88. CLAAS KGaA mbH Business Overview
Table 89. CLAAS KGaA mbH Digital Farming Technology Product
Table 90. CLAAS KGaA mbH Revenue in Digital Farming Technology Business (US$ Million), 2021–2026
Table 91. CLAAS KGaA mbH Recent Development
Table 92. BASF SE Company Details
Table 93. BASF SE Business Overview
Table 94. BASF SE Digital Farming Technology Product
Table 95. BASF SE Revenue in Digital Farming Technology Business (US$ Million), 2021–2026
Table 96. BASF SE Recent Development
Table 97. Bayer AG Company Details
Table 98. Bayer AG Business Overview
Table 99. Bayer AG Digital Farming Technology Product
Table 100. Bayer AG Revenue in Digital Farming Technology Business (US$ Million), 2021–2026
Table 101. Bayer AG Recent Development
Table 102. CORTEVA, INC. Company Details
Table 103. CORTEVA, INC. Business Overview
Table 104. CORTEVA, INC. Digital Farming Technology Product
Table 105. CORTEVA, INC. Revenue in Digital Farming Technology Business (US$ Million), 2021–2026
Table 106. CORTEVA, INC. Recent Development
Table 107. Syngenta Group Co., Ltd. Company Details
Table 108. Syngenta Group Co., Ltd. Business Overview
Table 109. Syngenta Group Co., Ltd. Digital Farming Technology Product
Table 110. Syngenta Group Co., Ltd. Revenue in Digital Farming Technology Business (US$ Million), 2021–2026
Table 111. Syngenta Group Co., Ltd. Recent Development
Table 112. KWS SAAT SE & Co. KGaA Company Details
Table 113. KWS SAAT SE & Co. KGaA Business Overview
Table 114. KWS SAAT SE & Co. KGaA Digital Farming Technology Product
Table 115. KWS SAAT SE & Co. KGaA Revenue in Digital Farming Technology Business (US$ Million), 2021–2026
Table 116. KWS SAAT SE & Co. KGaA Recent Development
Table 117. Yara International ASA Company Details
Table 118. Yara International ASA Business Overview
Table 119. Yara International ASA Digital Farming Technology Product
Table 120. Yara International ASA Revenue in Digital Farming Technology Business (US$ Million), 2021–2026
Table 121. Yara International ASA Recent Development
Table 122. Ag Leader Technology Company Details
Table 123. Ag Leader Technology Business Overview
Table 124. Ag Leader Technology Digital Farming Technology Product
Table 125. Ag Leader Technology Revenue in Digital Farming Technology Business (US$ Million), 2021–2026
Table 126. Ag Leader Technology Recent Development
Table 127. J.R. Simplot Company Company Details
Table 128. J.R. Simplot Company Business Overview
Table 129. J.R. Simplot Company Digital Farming Technology Product
Table 130. J.R. Simplot Company Revenue in Digital Farming Technology Business (US$ Million), 2021–2026
Table 131. J.R. Simplot Company Recent Development
Table 132. Orbia Advance Corporation, S.A.B. de C.V. Company Details
Table 133. Orbia Advance Corporation, S.A.B. de C.V. Business Overview
Table 134. Orbia Advance Corporation, S.A.B. de C.V. Digital Farming Technology Product
Table 135. Orbia Advance Corporation, S.A.B. de C.V. Revenue in Digital Farming Technology Business (US$ Million), 2021–2026
Table 136. Orbia Advance Corporation, S.A.B. de C.V. Recent Development
Table 137. SZ DJI Technology Co., Ltd. Company Details
Table 138. SZ DJI Technology Co., Ltd. Business Overview
Table 139. SZ DJI Technology Co., Ltd. Digital Farming Technology Product
Table 140. SZ DJI Technology Co., Ltd. Revenue in Digital Farming Technology Business (US$ Million), 2021–2026
Table 141. SZ DJI Technology Co., Ltd. Recent Development
Table 142. XAG Co., Ltd. Company Details
Table 143. XAG Co., Ltd. Business Overview
Table 144. XAG Co., Ltd. Digital Farming Technology Product
Table 145. XAG Co., Ltd. Revenue in Digital Farming Technology Business (US$ Million), 2021–2026
Table 146. XAG Co., Ltd. Recent Development
Table 147. Huawei Investment & Holding Co., Ltd. Company Details
Table 148. Huawei Investment & Holding Co., Ltd. Business Overview
Table 149. Huawei Investment & Holding Co., Ltd. Digital Farming Technology Product
Table 150. Huawei Investment & Holding Co., Ltd. Revenue in Digital Farming Technology Business (US$ Million), 2021–2026
Table 151. Huawei Investment & Holding Co., Ltd. Recent Development
Table 152. Zoomlion Heavy Industry Science & Technology Co., Ltd. Company Details
Table 153. Zoomlion Heavy Industry Science & Technology Co., Ltd. Business Overview
Table 154. Zoomlion Heavy Industry Science & Technology Co., Ltd. Digital Farming Technology Product
Table 155. Zoomlion Heavy Industry Science & Technology Co., Ltd. Revenue in Digital Farming Technology Business (US$ Million), 2021–2026
Table 156. Zoomlion Heavy Industry Science & Technology Co., Ltd. Recent Development
Table 157. Zhejiang Top Yunnong Technology Co., Ltd. Company Details
Table 158. Zhejiang Top Yunnong Technology Co., Ltd. Business Overview
Table 159. Zhejiang Top Yunnong Technology Co., Ltd. Digital Farming Technology Product
Table 160. Zhejiang Top Yunnong Technology Co., Ltd. Revenue in Digital Farming Technology Business (US$ Million), 2021–2026
Table 161. Zhejiang Top Yunnong Technology Co., Ltd. Recent Development
Table 162. Research Programs/Design for This Report
Table 163. Key Data Information from Secondary Sources
Table 164. Key Data Information from Primary Sources
Table 165. Authors List of This Report
List of Figures
Figure 1. Digital Farming Technology Picture
Figure 2. Global Digital Farming Technology Market Size Comparison by Type (US$ Million), 2021–2032
Figure 3. Global Digital Farming Technology Market Share by Type: 2025 vs 2032
Figure 4. Hardware and Embedded Control Features
Figure 5. Software Platforms Features
Figure 6. Data Products Features
Figure 7. Others Features
Figure 8. Global Digital Farming Technology Market Size Comparison by Solution (US$ Million), 2021–2032
Figure 9. End To End Farm Digitalization Features
Figure 10. Field Operations Systems Features
Figure 11. Monitoring and Analytics Systems Features
Figure 12. Others Features
Figure 13. Global Digital Farming Technology Market Size Comparison by Deployment Model (US$ Million), 2021–2032
Figure 14. Cloud SaaS Features
Figure 15. Hybrid Cloud and Edge Features
Figure 16. On Premise Features
Figure 17. Global Digital Farming Technology Market Size Comparison by Automation Level (US$ Million), 2021–2032
Figure 18. Decision Support Features
Figure 19. Assisted Automation Features
Figure 20. Autonomous Operation Features
Figure 21. Others Features
Figure 22. Global Digital Farming Technology Market Size by Application (US$ Million), 2021–2032
Figure 23. Global Digital Farming Technology Market Share by Application: 2025 vs 2032
Figure 24. Large Enterprise Farms Case Studies
Figure 25. Mid Size Commercial Farms Case Studies
Figure 26. Smallholders Case Studies
Figure 27. Others Case Studies
Figure 28. Digital Farming Technology Report Years Considered
Figure 29. Global Digital Farming Technology Market Size (US$ Million), Year-over-Year: 2021–2032
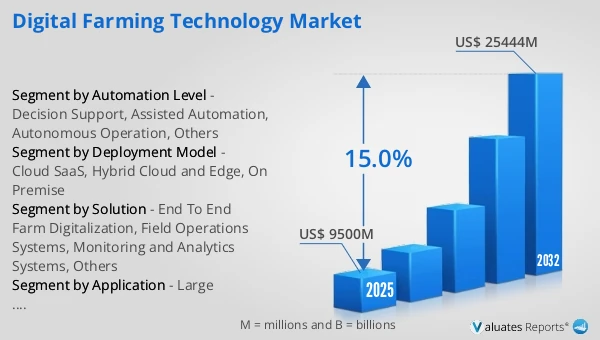
Figure 30. Global Digital Farming Technology Market Size, (US$ Million), 2021 vs 2025 vs 2032
Figure 31. Global Digital Farming Technology Market Share by Region: 2025 vs 2032
Figure 32. Global Digital Farming Technology Market Share by Players in 2025
Figure 33. Global Digital Farming Technology Market Share by Company Type (Tier 1, Tier 2, and Tier 3)
Figure 34. The Top 10 and 5 Players Market Share by Digital Farming Technology Revenue in 2025
Figure 35. North America Digital Farming Technology Market Size YoY Growth (US$ Million), 2021–2032
Figure 36. North America Digital Farming Technology Market Share by Country (2021–2032)
Figure 37. United States Digital Farming Technology Market Size YoY Growth (US$ Million), 2021–2032
Figure 38. Canada Digital Farming Technology Market Size YoY Growth (US$ Million), 2021–2032
Figure 39. Europe Digital Farming Technology Market Size YoY Growth (US$ Million), 2021–2032
Figure 40. Europe Digital Farming Technology Market Share by Country (2021–2032)
Figure 41. Germany Digital Farming Technology Market Size YoY Growth (US$ Million), 2021–2032
Figure 42. France Digital Farming Technology Market Size YoY Growth (US$ Million), 2021–2032
Figure 43. U.K. Digital Farming Technology Market Size YoY Growth (US$ Million), 2021–2032
Figure 44. Italy Digital Farming Technology Market Size YoY Growth (US$ Million), 2021–2032
Figure 45. Russia Digital Farming Technology Market Size YoY Growth (US$ Million), 2021–2032
Figure 46. Ireland Digital Farming Technology Market Size YoY Growth (US$ Million), 2021–2032
Figure 47. Asia-Pacific Digital Farming Technology Market Size YoY Growth (US$ Million), 2021–2032
Figure 48. Asia-Pacific Digital Farming Technology Market Share by Region (2021–2032)
Figure 49. China Digital Farming Technology Market Size YoY Growth (US$ Million), 2021–2032
Figure 50. Japan Digital Farming Technology Market Size YoY Growth (US$ Million), 2021–2032
Figure 51. South Korea Digital Farming Technology Market Size YoY Growth (US$ Million), 2021–2032
Figure 52. Southeast Asia Digital Farming Technology Market Size YoY Growth (US$ Million), 2021–2032
Figure 53. India Digital Farming Technology Market Size YoY Growth (US$ Million), 2021–2032
Figure 54. Australia & New Zealand Digital Farming Technology Market Size YoY Growth (US$ Million), 2021–2032
Figure 55. Latin America Digital Farming Technology Market Size YoY Growth (US$ Million), 2021–2032
Figure 56. Latin America Digital Farming Technology Market Share by Country (2021–2032)
Figure 57. Mexico Digital Farming Technology Market Size YoY Growth (US$ Million), 2021–2032
Figure 58. Brazil Digital Farming Technology Market Size YoY Growth (US$ Million), 2021–2032
Figure 59. Middle East & Africa Digital Farming Technology Market Size YoY Growth (US$ Million), 2021–2032
Figure 60. Middle East & Africa Digital Farming Technology Market Share by Country (2021–2032)
Figure 61. Israel Digital Farming Technology Market Size YoY Growth (US$ Million), 2021–2032
Figure 62. Saudi Arabia Digital Farming Technology Market Size YoY Growth (US$ Million), 2021–2032
Figure 63. UAE Digital Farming Technology Market Size YoY Growth (US$ Million), 2021–2032
Figure 64. Deere & Company Revenue Growth Rate in Digital Farming Technology Business (2021–2026)
Figure 65. CNH Industrial N.V. Revenue Growth Rate in Digital Farming Technology Business (2021–2026)
Figure 66. AGCO Corporation Revenue Growth Rate in Digital Farming Technology Business (2021–2026)
Figure 67. Kubota Corporation Revenue Growth Rate in Digital Farming Technology Business (2021–2026)
Figure 68. Topcon Corporation Revenue Growth Rate in Digital Farming Technology Business (2021–2026)
Figure 69. CLAAS KGaA mbH Revenue Growth Rate in Digital Farming Technology Business (2021–2026)
Figure 70. BASF SE Revenue Growth Rate in Digital Farming Technology Business (2021–2026)
Figure 71. Bayer AG Revenue Growth Rate in Digital Farming Technology Business (2021–2026)
Figure 72. CORTEVA, INC. Revenue Growth Rate in Digital Farming Technology Business (2021–2026)
Figure 73. Syngenta Group Co., Ltd. Revenue Growth Rate in Digital Farming Technology Business (2021–2026)
Figure 74. KWS SAAT SE & Co. KGaA Revenue Growth Rate in Digital Farming Technology Business (2021–2026)
Figure 75. Yara International ASA Revenue Growth Rate in Digital Farming Technology Business (2021–2026)
Figure 76. Ag Leader Technology Revenue Growth Rate in Digital Farming Technology Business (2021–2026)
Figure 77. J.R. Simplot Company Revenue Growth Rate in Digital Farming Technology Business (2021–2026)
Figure 78. Orbia Advance Corporation, S.A.B. de C.V. Revenue Growth Rate in Digital Farming Technology Business (2021–2026)
Figure 79. SZ DJI Technology Co., Ltd. Revenue Growth Rate in Digital Farming Technology Business (2021–2026)
Figure 80. XAG Co., Ltd. Revenue Growth Rate in Digital Farming Technology Business (2021–2026)
Figure 81. Huawei Investment & Holding Co., Ltd. Revenue Growth Rate in Digital Farming Technology Business (2021–2026)
Figure 82. Zoomlion Heavy Industry Science & Technology Co., Ltd. Revenue Growth Rate in Digital Farming Technology Business (2021–2026)
Figure 83. Zhejiang Top Yunnong Technology Co., Ltd. Revenue Growth Rate in Digital Farming Technology Business (2021–2026)
Figure 84. Bottom-up and Top-down Approaches for This Report
Figure 85. Data Triangulation
Figure 86. Key Executives Interviewed