0
U.S. (TOLL FREE)
+1 (315) 215-3225
Automative

0
U.S. (TOLL FREE)
+1 (315) 215-3225
Global Pet Tick Repellent Market Outlook, In‑Depth Analysis & Forecast to 2031
Published Date: November 2025
|
Report Code: QYRE-Auto-14N17447
Home | Market Reports | Pets & Animals
Global Pet Tick Repellent Market Research Report 2024
BUY CHAPTERS

Global Pet Tick Repellent Market Outlook, In‑Depth Analysis & Forecast to 2031

Code: QYRE-Auto-14N17447
Report
November 2025
Pages:133
QYResearch
Buy Now with 15% Discount
DESCRIPTION
TABLE OF CONTENT
TABLES & FIGURES

Pet Tick Repellent Market Size

According to Vetnosis, the value of the global animal health industry will increase by 12% to $38.3 billion in 2021.

Pet Tick Repellent Market

Pet Tick Repellent Market

The global Pet Tick Repellent market is projected to grow from US$ million in 2024 to US$ million by 2031, at a CAGR of %(2025-2031), driven by critical product segments and diverse end‑use applications.
Tick and flea prevention involves various measures aimed at protecting pets from infestations and potential diseases transmitted by ticks and fleas.
Pet medical care is the second largest segment in pet industry. In the UK, annual spending on veterinary and other pet services has risen from £2.6bn in 2015 to £4bn in 2021, a 54% increase in just six years. White Paper on China"s Pet Healthy Consumption of JD shows that in 2023, there are 13.09 million pets entering middle age and old age. And pet aging is expected to be seen in the next few years. Changes in the age structure of pets will further bring about the development of the pet medical industry. According to the data of the 2022 China Pet Medical Industry White Paper, from the perspective of market size, the scale of China"s pet medical market is about ¥67.5 billion, accounting for about 22.5% of the entire pet industry. From the perspective of hospital operation time, pet hospitals within 5 years accounted for about 73%. About 11% of the pet hospitals have been in operation for more than 10 years. From the perspective of hospital turnover, nearly 40% of the hospitals have increased their annual turnover year-on-year, and the growth rate is mainly within 345%.

Report Includes:

This definitive report equips CEOs, marketing directors, and investors with a 360° view of the global Pet Tick Repellent market across value chain. It analyzes historical revenue data (2020–2024) and delivers forecasts through 2031, illuminating demand trends and growth drivers.
By segmenting the market by Type and by Application, the study quantifies market size, growth rates, niche opportunities, and substitution risks, and analyzes downstream customers distribution pattern.
Granular regional insights cover five major markets—North America, Europe, APAC, South America, and MEA—with in‑depth analysis of 20+ countries, detailing dominant products, competitive landscape, and downstream demand trends.
Critical competitive intelligence profiles players—revenue, margins, pricing strategies, and major customers—and dissects the top-player positioning across product lines, applications, and regions to reveal strategic strengths.
A concise Industry‑chain overview maps upstream, middlestream, and downstream distribution dynamics to identify strategic gaps and unmet demand.
Market Segmentation

Scope of Pet Tick Repellent Market Report

Report Metric Details
Report Name Pet Tick Repellent Market
Accounted market size in 2021 $ 38.3 billion
Base Year 2021
Segment by Type
  • Oral Medication
  • Spray
  • Powder
  • Other
Segment by Application
  • Dogs
  • Cats
  • Other
Sales by Region
  • North America (United States, Canada)
  • Europe (Germany, France, UK, Italy, Russia) Rest of Europe
  • Nordic Countries
  • Asia-Pacific (China, Japan, South Korea)
  • Southeast Asia (India, Australia)
  • Rest of Asia
  • Latin America (Mexico, Brazil)
  • Rest of Latin America
  • Middle East & Africa (Turkey, Saudi Arabia, UAE, Rest of MEA)
By Company Boehringer Ingelheim, Ceva Sante Animale, Ecto Development, Eli Lilly and Company, Merck Animal Health, Sergeant’s Pet Care Products, The Hartz Mountain, Virbac Corporation, Wellmark International, Central Life Sciences, Penn Veterinary Supply, Petsburgh Pet Care, Pipestone Veterinary Services, Precious Pet Services, SPC Pet India
Forecast units USD million in value
Report coverage Revenue and volume forecast, company share, competitive landscape, growth factors and trends

Chapter Outline

  • Chapter 1: Defines the Pet Tick Repellent study scope, segments the market by Type and by Application, etc, highlights segment size and growth potential.
  • Chapter 2: Offers current market state, projects global revenue and sales to 2031, pinpointing high consumption regions and emerging market catalysts
  • Chapter 3: Dissects the player landscape—ranks by revenue and profitability, details Player performance by product type and evaluates concentration alongside M&A moves.
  • Chapter 4: Unlocks high margin product segments—compares revenue, ASP, and technology differentiators, highlighting growth niches and substitution risks
  • Chapter 5: Targets downstream market opportunities—evaluates market size by Application, identifies emerging use cases, and profiles leading customers by region and by Application.
  • Chapter 6: North America—breaks down market size by Type, by Application and country, profiles key players and assesses growth drivers and barriers.
  • Chapter 7: Europe—analyses regional market by Type, by Application and players, flagging drivers and barriers.
  • Chapter 8: Asia Pacific—quantifies market size by Type, by Application, and region/country, profiles top players, and uncovers high potential expansion areas.
  • Chapter 9: Central & South America—measures market size by Type, by Application, and country, profiles top players, and identifies investment opportunities and challenges.
  • Chapter 10: Middle East and Africa—evaluates market size by Type, by Application, and country, profiles key players, and outlines investment prospects and market hurdles
  • Chapter 11: Profiles players in depth—details product specs, revenue, margins; Top-tier players 2024 sales breakdowns by Product type, by Application, by region SWOT analysis, and recent strategic developments.
  • Chapter 12: Industry chain—analyses upstream, cost drivers, plus downstream channels.
  • Chapter 13: Market dynamics—explores drivers, restraints, regulatory impacts, and risk mitigation strategies.
  • Chapter 14: Actionable conclusions and strategic recommendations.
  • Why This Report:
  • Beyond standard market data, this analysis provides a clear profitability roadmap—empowering you to:
  • Allocate capital strategically to high growth regions (Chapters 6–10) and margin rich segments (Chapter 5).
  • Negotiate from strength with suppliers (Chapter 12) and customers (Chapter 5) using cost and demand intelligence.
  • Outmaneuver competitors with granular insights into their operations, margins, and strategies (Chapters 3 and 11).
  • Capitalize on the projected billion‑dollar opportunity with data‑driven regional and segment tactics (Chapter 12-14).
  • Leverage this 360° intelligence to turn market complexity into actionable competitive advantage.

FAQ for this report

What is the Pet Tick Repellent Market share by region?

Ans: According to the data of the 2022 China Pet Medical Industry White Paper, from the perspective of market size, the scale of China"s pet medical market is about ¥67.5 billion, accounting for about 22.5% of the entire pet industry.

Who are the main players in the Pet Tick Repellent Market report?

Ans: The main players in the Pet Tick Repellent Market are Boehringer Ingelheim, Ceva Sante Animale, Ecto Development, Eli Lilly and Company, Merck Animal Health, Sergeant’s Pet Care Products, The Hartz Mountain, Virbac Corporation, Wellmark International, Central Life Sciences, Penn Veterinary Supply, Petsburgh Pet Care, Pipestone Veterinary Services, Precious Pet Services, SPC Pet India

What are the Application segmentation covered in the Pet Tick Repellent Market report?

Ans: The Applications covered in the Pet Tick Repellent Market report are Dogs, Cats, Other

What are the Type segmentation covered in the Pet Tick Repellent Market report?

Ans: The Types covered in the Pet Tick Repellent Market report are Oral Medication, Spray, Powder, Other

1 Study Coverage
1.1 Introduction to Pet Tick Repellent: Definition, Properties, and Key Attributes
1.2 Market Segmentation by Type
1.2.1 Global Pet Tick Repellent Market Size by Type, 2020 VS 2024 VS 2031
1.2.2 Oral Medication
1.2.3 Spray
1.2.4 Powder
1.2.5 Other
1.3 Market Segmentation by Application
1.3.1 Global Pet Tick Repellent Market Size by Application, 2020 VS 2024 VS 2031
1.3.2 Dogs
1.3.3 Cats
1.3.4 Other
1.4 Assumptions and Limitations
1.5 Study Objectives
1.6 Years Considered
2 Executive Summary
2.1 Global Pet Tick Repellent Revenue Estimates and Forecasts 2020-2031
2.2 Global Pet Tick Repellent Revenue by Region
2.2.1 Revenue Comparison: 2020 VS 2024 VS 2031
2.2.2 Historical and Forecasted Revenue by Region (2020-2031)
2.2.3 Global Revenue Market Share by Region (2020-2031)
2.2.4 Emerging Market Focus: Growth Drivers & Investment Trends
3 Competition by Players
3.1 Global Pet Tick Repellent Player Revenue Rankings and Profitability
3.1.1 Global Revenue (Value) by Players (2020-2025)
3.1.2 Global Key Player Revenue Ranking (2023 vs. 2024)
3.1.3 Revenue-Based Tier Segmentation (Tier 1, Tier 2, and Tier 3)
3.1.4 Gross Margin by Top Player (2020 VS 2024)
3.2 Global Pet Tick Repellent Companies Headquarters and Service Footprint
3.3 Main Product Type Market Size by Players
3.3.1 Oral Medication Market Size by Players
3.3.2 Spray Market Size by Players
3.3.3 Powder Market Size by Players
3.3.4 Other Market Size by Players
3.4 Global Pet Tick Repellent Market Concentration and Dynamics
3.4.1 Global Market Concentration (CR5 and HHI)
3.4.2 Entrant/Exit Impact Analysis
3.4.3 Strategic Moves: M&A, Expansion, R&D Investment
4 Global Product Segmentation Analysis
4.1 Global Pet Tick Repellent Revenue Trends by Type
4.1.1 Global Historical and Forecasted Revenue by Type (2020-2031)
4.1.2 Global Revenue Market Share by Type (2020-2031)
4.2 Key Product Attributes and Differentiation
4.3 Subtype Dynamics: Growth Leaders, Profitability and Risk
4.3.1 High-Growth Niches and Adoption Drivers
4.3.2 Profitability Hotspots and Cost Drivers
4.3.3 Substitution Threats
5 Global Downstream Application Analysis
5.1 Global Pet Tick Repellent Revenue by Application
5.1.1 Global Historical and Forecasted Revenue by Application (2020-2031)
5.1.2 Revenue Market Share by Application (2020-2031)
5.1.3 High-Growth Application Identification
5.1.4 Emerging Application Case Studies
5.2 Downstream Customer Analysis
5.2.1 Top Customers by Region
5.2.2 Top Customers by Application
6 North America
6.1 North America Market Size (2020-2031)
6.2 North America Key Players Revenue in 2024
6.3 North America Pet Tick Repellent Market Size by Type (2020-2031)
6.4 North America Pet Tick Repellent Market Size by Application (2020-2031)
6.5 North America Growth Accelerators and Market Barriers
6.6 North America Pet Tick Repellent Market Size by Country
6.6.1 North America Revenue Trends by Country
6.6.2 US
6.6.3 Canada
6.6.4 Mexico
7 Europe
7.1 Europe Market Size (2020-2031)
7.2 Europe Key Players Revenue in 2024
7.3 Europe Pet Tick Repellent Market Size by Type (2020-2031)
7.4 Europe Pet Tick Repellent Market Size by Application (2020-2031)
7.5 Europe Growth Accelerators and Market Barriers
7.6 Europe Pet Tick Repellent Market Size by Country
7.6.1 Europe Revenue Trends by Country
7.6.2 Germany
7.6.3 France
7.6.4 U.K.
7.6.5 Italy
7.6.6 Russia
8 Asia-Pacific
8.1 Asia-Pacific Market Size (2020-2031)
8.2 Asia-Pacific Key Players Revenue in 2024
8.3 Asia-Pacific Pet Tick Repellent Market Size by Type (2020-2031)
8.4 Asia-Pacific Pet Tick Repellent Market Size by Application (2020-2031)
8.5 Asia-Pacific Growth Accelerators and Market Barriers
8.6 Asia-Pacific Pet Tick Repellent Market Size by Region
8.6.1 Asia-Pacific Revenue Trends by Region
8.7 China
8.8 Japan
8.9 South Korea
8.10 Australia
8.11 India
8.12 Southeast Asia
8.12.1 Indonesia
8.12.2 Vietnam
8.12.3 Malaysia
8.12.4 Philippines
8.12.5 Singapore
9 Central and South America
9.1 Central and South America Market Size (2020-2031)
9.2 Central and South America Key Players Revenue in 2024
9.3 Central and South America Pet Tick Repellent Market Size by Type (2020-2031)
9.4 Central and South America Pet Tick Repellent Market Size by Application (2020-2031)
9.5 Central and South America Investment Opportunities and Key Challenges
9.6 Central and South America Pet Tick Repellent Market Size by Country
9.6.1 Central and South America Revenue Trends by Country (2020 VS 2024 VS 2031)
9.6.2 Brazil
9.6.3 Argentina
10 Middle East and Africa
10.1 Middle East and Africa Market Size (2020-2031)
10.2 Middle East and Africa Key Players Revenue in 2024
10.3 Middle East and Africa Pet Tick Repellent Market Size by Type (2020-2031)
10.4 Middle East and Africa Pet Tick Repellent Market Size by Application (2020-2031)
10.5 Middle East and Africa Investment Opportunities and Key Challenges
10.6 Middle East and Africa Pet Tick Repellent Market Size by Country
10.6.1 Middle East and Africa Revenue Trends by Country (2020 VS 2024 VS 2031)
10.6.2 GCC Countries
10.6.3 Israel
10.6.4 Egypt
10.6.5 South Africa
11 Corporate Profile
11.1 Boehringer Ingelheim
11.1.1 Boehringer Ingelheim Corporation Information
11.1.2 Boehringer Ingelheim Business Overview
11.1.3 Boehringer Ingelheim Pet Tick Repellent Product Features and Attributes
11.1.4 Boehringer Ingelheim Pet Tick Repellent Revenue and Gross Margin (2020-2025)
11.1.5 Boehringer Ingelheim Pet Tick Repellent Revenue by Product in 2024
11.1.6 Boehringer Ingelheim Pet Tick Repellent Revenue by Application in 2024
11.1.7 Boehringer Ingelheim Pet Tick Repellent Revenue by Geographic Area in 2024
11.1.8 Boehringer Ingelheim Pet Tick Repellent SWOT Analysis
11.1.9 Boehringer Ingelheim Recent Developments
11.2 Ceva Sante Animale
11.2.1 Ceva Sante Animale Corporation Information
11.2.2 Ceva Sante Animale Business Overview
11.2.3 Ceva Sante Animale Pet Tick Repellent Product Features and Attributes
11.2.4 Ceva Sante Animale Pet Tick Repellent Revenue and Gross Margin (2020-2025)
11.2.5 Ceva Sante Animale Pet Tick Repellent Revenue by Product in 2024
11.2.6 Ceva Sante Animale Pet Tick Repellent Revenue by Application in 2024
11.2.7 Ceva Sante Animale Pet Tick Repellent Revenue by Geographic Area in 2024
11.2.8 Ceva Sante Animale Pet Tick Repellent SWOT Analysis
11.2.9 Ceva Sante Animale Recent Developments
11.3 Ecto Development
11.3.1 Ecto Development Corporation Information
11.3.2 Ecto Development Business Overview
11.3.3 Ecto Development Pet Tick Repellent Product Features and Attributes
11.3.4 Ecto Development Pet Tick Repellent Revenue and Gross Margin (2020-2025)
11.3.5 Ecto Development Pet Tick Repellent Revenue by Product in 2024
11.3.6 Ecto Development Pet Tick Repellent Revenue by Application in 2024
11.3.7 Ecto Development Pet Tick Repellent Revenue by Geographic Area in 2024
11.3.8 Ecto Development Pet Tick Repellent SWOT Analysis
11.3.9 Ecto Development Recent Developments
11.4 Eli Lilly and Company
11.4.1 Eli Lilly and Company Corporation Information
11.4.2 Eli Lilly and Company Business Overview
11.4.3 Eli Lilly and Company Pet Tick Repellent Product Features and Attributes
11.4.4 Eli Lilly and Company Pet Tick Repellent Revenue and Gross Margin (2020-2025)
11.4.5 Eli Lilly and Company Pet Tick Repellent Revenue by Product in 2024
11.4.6 Eli Lilly and Company Pet Tick Repellent Revenue by Application in 2024
11.4.7 Eli Lilly and Company Pet Tick Repellent Revenue by Geographic Area in 2024
11.4.8 Eli Lilly and Company Pet Tick Repellent SWOT Analysis
11.4.9 Eli Lilly and Company Recent Developments
11.5 Merck Animal Health
11.5.1 Merck Animal Health Corporation Information
11.5.2 Merck Animal Health Business Overview
11.5.3 Merck Animal Health Pet Tick Repellent Product Features and Attributes
11.5.4 Merck Animal Health Pet Tick Repellent Revenue and Gross Margin (2020-2025)
11.5.5 Merck Animal Health Pet Tick Repellent Revenue by Product in 2024
11.5.6 Merck Animal Health Pet Tick Repellent Revenue by Application in 2024
11.5.7 Merck Animal Health Pet Tick Repellent Revenue by Geographic Area in 2024
11.5.8 Merck Animal Health Pet Tick Repellent SWOT Analysis
11.5.9 Merck Animal Health Recent Developments
11.6 Sergeant’s Pet Care Products
11.6.1 Sergeant’s Pet Care Products Corporation Information
11.6.2 Sergeant’s Pet Care Products Business Overview
11.6.3 Sergeant’s Pet Care Products Pet Tick Repellent Product Features and Attributes
11.6.4 Sergeant’s Pet Care Products Pet Tick Repellent Revenue and Gross Margin (2020-2025)
11.6.5 Sergeant’s Pet Care Products Recent Developments
11.7 The Hartz Mountain
11.7.1 The Hartz Mountain Corporation Information
11.7.2 The Hartz Mountain Business Overview
11.7.3 The Hartz Mountain Pet Tick Repellent Product Features and Attributes
11.7.4 The Hartz Mountain Pet Tick Repellent Revenue and Gross Margin (2020-2025)
11.7.5 The Hartz Mountain Recent Developments
11.8 Virbac Corporation
11.8.1 Virbac Corporation Corporation Information
11.8.2 Virbac Corporation Business Overview
11.8.3 Virbac Corporation Pet Tick Repellent Product Features and Attributes
11.8.4 Virbac Corporation Pet Tick Repellent Revenue and Gross Margin (2020-2025)
11.8.5 Virbac Corporation Recent Developments
11.9 Wellmark International
11.9.1 Wellmark International Corporation Information
11.9.2 Wellmark International Business Overview
11.9.3 Wellmark International Pet Tick Repellent Product Features and Attributes
11.9.4 Wellmark International Pet Tick Repellent Revenue and Gross Margin (2020-2025)
11.9.5 Wellmark International Recent Developments
11.10 Central Life Sciences
11.10.1 Central Life Sciences Corporation Information
11.10.2 Central Life Sciences Business Overview
11.10.3 Central Life Sciences Pet Tick Repellent Product Features and Attributes
11.10.4 Central Life Sciences Pet Tick Repellent Revenue and Gross Margin (2020-2025)
11.10.5 Company Ten Recent Developments
11.11 Penn Veterinary Supply
11.11.1 Penn Veterinary Supply Corporation Information
11.11.2 Penn Veterinary Supply Business Overview
11.11.3 Penn Veterinary Supply Pet Tick Repellent Product Features and Attributes
11.11.4 Penn Veterinary Supply Pet Tick Repellent Revenue and Gross Margin (2020-2025)
11.11.5 Penn Veterinary Supply Recent Developments
11.12 Petsburgh Pet Care
11.12.1 Petsburgh Pet Care Corporation Information
11.12.2 Petsburgh Pet Care Business Overview
11.12.3 Petsburgh Pet Care Pet Tick Repellent Product Features and Attributes
11.12.4 Petsburgh Pet Care Pet Tick Repellent Revenue and Gross Margin (2020-2025)
11.12.5 Petsburgh Pet Care Recent Developments
11.13 Pipestone Veterinary Services
11.13.1 Pipestone Veterinary Services Corporation Information
11.13.2 Pipestone Veterinary Services Business Overview
11.13.3 Pipestone Veterinary Services Pet Tick Repellent Product Features and Attributes
11.13.4 Pipestone Veterinary Services Pet Tick Repellent Revenue and Gross Margin (2020-2025)
11.13.5 Pipestone Veterinary Services Recent Developments
11.14 Precious Pet Services
11.14.1 Precious Pet Services Corporation Information
11.14.2 Precious Pet Services Business Overview
11.14.3 Precious Pet Services Pet Tick Repellent Product Features and Attributes
11.14.4 Precious Pet Services Pet Tick Repellent Revenue and Gross Margin (2020-2025)
11.14.5 Precious Pet Services Recent Developments
11.15 SPC Pet India
11.15.1 SPC Pet India Corporation Information
11.15.2 SPC Pet India Business Overview
11.15.3 SPC Pet India Pet Tick Repellent Product Features and Attributes
11.15.4 SPC Pet India Pet Tick Repellent Revenue and Gross Margin (2020-2025)
11.15.5 SPC Pet India Recent Developments
12 Pet Tick RepellentIndustry Chain Analysis
12.1 Pet Tick Repellent Industry Chain
12.2 Upstream Analysis
12.2.1 Upstream Key Suppliers
12.3 Middlestream Analysis
12.4 Downstream Sales Model and Distribution Networks
12.4.1 Sales Channels
12.4.2 Distributors
13 Pet Tick Repellent Market Dynamics
13.1 Industry Trends and Evolution
13.2 Market Growth Drivers and Emerging Opportunities
13.3 Market Challenges, Risks, and Restraints
14 Key Findings in the Global Pet Tick Repellent Study
15 Appendix
15.1 Research Methodology
15.1.1 Methodology/Research Approach
15.1.1.1 Research Programs/Design
15.1.1.2 Market Size Estimation
15.1.1.3 Market Breakdown and Data Triangulation
15.1.2 Data Source
15.1.2.1 Secondary Sources
15.1.2.2 Primary Sources
15.2 Author Details
List of Tables
 Table 1. Global Pet Tick Repellent Market Size Growth Rate by Type, 2020 VS 2024 VS 2031 (US$ Million)
 Table 2. Global Pet Tick Repellent Market Size Growth Rate by Application, 2020 VS 2024 VS 2031 (US$ Million)
 Table 3. Global Pet Tick Repellent Revenue Grow Rate (CAGR) by Region: 2020 VS 2024 VS 2031 (US$ Million)
 Table 4. Global Pet Tick Repellent Revenue by Region (2020-2025) & (US$ Million)
 Table 5. Global Pet Tick Repellent Revenue by Region (2026-2031) & (US$ Million)
 Table 6. Emerging Market Revenue Grow Rate (CAGR) by Country (2020 VS 2024 VS 2031) (US$ Million)
 Table 7. Global Pet Tick Repellent Revenue by Players (2020-2025) & (US$ Million)
 Table 8. Global Pet Tick Repellent Revenue Market Share by Players (2020-2025)
 Table 9. Global Key Players’Ranking Shift (2023 vs. 2024) (Based on Revenue)
 Table 10. Global Pet Tick Repellent by Player Tier (Tier 1, Tier 2, and Tier 3) & (based on the Revenue in Pet Tick Repellent as of 2024)
 Table 11. Global Pet Tick Repellent Average Gross Margin (%) by Player (2020 VS 2024)
 Table 12. Global Pet Tick Repellent Companies Headquarters
 Table 13. Global Pet Tick Repellent Market Concentration Ratio (CR5 and HHI)
 Table 14. Key Market Entrant/Exit (2020-2024) – Drivers & Impact Analysis
 Table 15. Key Mergers & Acquisitions, Expansion Plans, R&D Investment
 Table 16. Global Pet Tick Repellent Revenue by Type (2020-2025) & (US$ Million)
 Table 17. Global Pet Tick Repellent Revenue by Type (2026-2031) & (US$ Million)
 Table 18. Key Product Attributes and Differentiation
 Table 19. Global Pet Tick Repellent Revenue by Application (2020-2025) & (US$ Million)
 Table 20. Global Pet Tick Repellent Revenue by Application (2026-2031) & (US$ Million)
 Table 21. Pet Tick Repellent High-Growth Sectors Demand CAGR (2024-2031)
 Table 22. Top Customers by Region
 Table 23. Top Customers by Application
 Table 24. North America Pet Tick Repellent Growth Accelerators and Market Barriers
 Table 25. North America Pet Tick Repellent Revenue Grow Rate (CAGR) by Country (2020 VS 2024 VS 2031) (US$ Million)
 Table 26. Europe Pet Tick Repellent Growth Accelerators and Market Barriers
 Table 27. Europe Pet Tick Repellent Revenue Grow Rate (CAGR) by Country: 2020 VS 2024 VS 2031 (US$ Million)
 Table 28. Asia-Pacific Pet Tick Repellent Growth Accelerators and Market Barriers
 Table 29. Asia-Pacific Pet Tick Repellent Revenue Grow Rate (CAGR) by Region: 2020 VS 2024 VS 2031 (US$ Million)
 Table 30. Central and South America Pet Tick Repellent Investment Opportunities and Key Challenges
 Table 31. Central and South America Pet Tick Repellent Revenue Grow Rate (CAGR) by Country (2020 VS 2024 VS 2031) (US$ Million)
 Table 32. Middle East and Africa Pet Tick Repellent Investment Opportunities and Key Challenges
 Table 33. Middle East and Africa Pet Tick Repellent Revenue Grow Rate (CAGR) by Country (2020 VS 2024 VS 2031) (US$ Million)
 Table 34. Boehringer Ingelheim Corporation Information
 Table 35. Boehringer Ingelheim Description and Major Businesses
 Table 36. Boehringer Ingelheim Product Features and Attributes
 Table 37. Boehringer Ingelheim Revenue (US$ Million) and Gross Margin (2020-2025)
 Table 38. Boehringer Ingelheim Revenue Proportion by Product in 2024
 Table 39. Boehringer Ingelheim Revenue Proportion by Application in 2024
 Table 40. Boehringer Ingelheim Revenue Proportion by Geographic Area in 2024
 Table 41. Boehringer Ingelheim Pet Tick Repellent SWOT Analysis
 Table 42. Boehringer Ingelheim Recent Developments
 Table 43. Ceva Sante Animale Corporation Information
 Table 44. Ceva Sante Animale Description and Major Businesses
 Table 45. Ceva Sante Animale Product Features and Attributes
 Table 46. Ceva Sante Animale Revenue (US$ Million) and Gross Margin (2020-2025)
 Table 47. Ceva Sante Animale Revenue Proportion by Product in 2024
 Table 48. Ceva Sante Animale Revenue Proportion by Application in 2024
 Table 49. Ceva Sante Animale Revenue Proportion by Geographic Area in 2024
 Table 50. Ceva Sante Animale Pet Tick Repellent SWOT Analysis
 Table 51. Ceva Sante Animale Recent Developments
 Table 52. Ecto Development Corporation Information
 Table 53. Ecto Development Description and Major Businesses
 Table 54. Ecto Development Product Features and Attributes
 Table 55. Ecto Development Revenue (US$ Million) and Gross Margin (2020-2025)
 Table 56. Ecto Development Revenue Proportion by Product in 2024
 Table 57. Ecto Development Revenue Proportion by Application in 2024
 Table 58. Ecto Development Revenue Proportion by Geographic Area in 2024
 Table 59. Ecto Development Pet Tick Repellent SWOT Analysis
 Table 60. Ecto Development Recent Developments
 Table 61. Eli Lilly and Company Corporation Information
 Table 62. Eli Lilly and Company Description and Major Businesses
 Table 63. Eli Lilly and Company Product Features and Attributes
 Table 64. Eli Lilly and Company Revenue (US$ Million) and Gross Margin (2020-2025)
 Table 65. Eli Lilly and Company Revenue Proportion by Product in 2024
 Table 66. Eli Lilly and Company Revenue Proportion by Application in 2024
 Table 67. Eli Lilly and Company Revenue Proportion by Geographic Area in 2024
 Table 68. Eli Lilly and Company Pet Tick Repellent SWOT Analysis
 Table 69. Eli Lilly and Company Recent Developments
 Table 70. Merck Animal Health Corporation Information
 Table 71. Merck Animal Health Description and Major Businesses
 Table 72. Merck Animal Health Product Features and Attributes
 Table 73. Merck Animal Health Revenue (US$ Million) and Gross Margin (2020-2025)
 Table 74. Merck Animal Health Revenue Proportion by Product in 2024
 Table 75. Merck Animal Health Revenue Proportion by Application in 2024
 Table 76. Merck Animal Health Revenue Proportion by Geographic Area in 2024
 Table 77. Merck Animal Health Pet Tick Repellent SWOT Analysis
 Table 78. Merck Animal Health Recent Developments
 Table 79. Sergeant’s Pet Care Products Corporation Information
 Table 80. Sergeant’s Pet Care Products Description and Major Businesses
 Table 81. Sergeant’s Pet Care Products Product Features and Attributes
 Table 82. Sergeant’s Pet Care Products Revenue (US$ Million) and Gross Margin (2020-2025)
 Table 83. Sergeant’s Pet Care Products Recent Developments
 Table 84. The Hartz Mountain Corporation Information
 Table 85. The Hartz Mountain Description and Major Businesses
 Table 86. The Hartz Mountain Product Features and Attributes
 Table 87. The Hartz Mountain Revenue (US$ Million) and Gross Margin (2020-2025)
 Table 88. The Hartz Mountain Recent Developments
 Table 89. Virbac Corporation Corporation Information
 Table 90. Virbac Corporation Description and Major Businesses
 Table 91. Virbac Corporation Product Features and Attributes
 Table 92. Virbac Corporation Revenue (US$ Million) and Gross Margin (2020-2025)
 Table 93. Virbac Corporation Recent Developments
 Table 94. Wellmark International Corporation Information
 Table 95. Wellmark International Description and Major Businesses
 Table 96. Wellmark International Product Features and Attributes
 Table 97. Wellmark International Revenue (US$ Million) and Gross Margin (2020-2025)
 Table 98. Wellmark International Recent Developments
 Table 99. Central Life Sciences Corporation Information
 Table 100. Central Life Sciences Description and Major Businesses
 Table 101. Central Life Sciences Product Features and Attributes
 Table 102. Central Life Sciences Revenue (US$ Million) and Gross Margin (2020-2025)
 Table 103. Central Life Sciences Recent Developments
 Table 104. Penn Veterinary Supply Corporation Information
 Table 105. Penn Veterinary Supply Description and Major Businesses
 Table 106. Penn Veterinary Supply Product Features and Attributes
 Table 107. Penn Veterinary Supply Revenue (US$ Million) and Gross Margin (2020-2025)
 Table 108. Penn Veterinary Supply Recent Developments
 Table 109. Petsburgh Pet Care Corporation Information
 Table 110. Petsburgh Pet Care Description and Major Businesses
 Table 111. Petsburgh Pet Care Product Features and Attributes
 Table 112. Petsburgh Pet Care Revenue (US$ Million) and Gross Margin (2020-2025)
 Table 113. Petsburgh Pet Care Recent Developments
 Table 114. Pipestone Veterinary Services Corporation Information
 Table 115. Pipestone Veterinary Services Description and Major Businesses
 Table 116. Pipestone Veterinary Services Product Features and Attributes
 Table 117. Pipestone Veterinary Services Revenue (US$ Million) and Gross Margin (2020-2025)
 Table 118. Pipestone Veterinary Services Recent Developments
 Table 119. Precious Pet Services Corporation Information
 Table 120. Precious Pet Services Description and Major Businesses
 Table 121. Precious Pet Services Product Features and Attributes
 Table 122. Precious Pet Services Revenue (US$ Million) and Gross Margin (2020-2025)
 Table 123. Precious Pet Services Recent Developments
 Table 124. SPC Pet India Corporation Information
 Table 125. SPC Pet India Description and Major Businesses
 Table 126. SPC Pet India Product Features and Attributes
 Table 127. SPC Pet India Revenue (US$ Million) and Gross Margin (2020-2025)
 Table 128. SPC Pet India Recent Developments
 Table 129. Raw Materials Key Suppliers
 Table 130. Distributors List
 Table 131. Market Trends and Market Evolution
 Table 132. Market Drivers and Opportunities
 Table 133. Market Challenges, Risks, and Restraints
 Table 134. Research Programs/Design for This Report
 Table 135. Key Data Information from Secondary Sources
 Table 136. Key Data Information from Primary Sources


List of Figures
 Figure 1. Pet Tick Repellent Product Picture
 Figure 2. Global Pet Tick Repellent Market Size Growth Rate by Type, 2020 VS 2024 VS 2031 (US$ Million)
 Figure 3. Oral Medication Product Picture
 Figure 4. Spray Product Picture
 Figure 5. Powder Product Picture
 Figure 6. Other Product Picture
 Figure 7. Global Pet Tick Repellent Market Size Growth Rate by Application, 2020 VS 2024 VS 2031 (US$ Million)
 Figure 8. Dogs
 Figure 9. Cats
 Figure 10. Other
 Figure 11. Pet Tick Repellent Report Years Considered
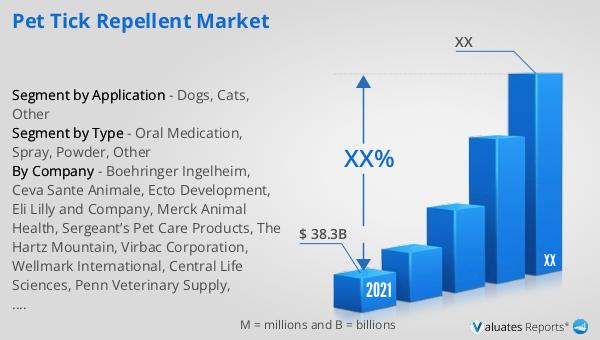
 Figure 12. Global Pet Tick Repellent Revenue, (US$ Million), 2020 VS 2024 VS 2031
 Figure 13. Global Pet Tick Repellent Revenue (2020-2031) & (US$ Million)
 Figure 14. Global Pet Tick Repellent Revenue (CAGR) by Region: 2020 VS 2024 VS 2031 (US$ Million)
 Figure 15. Global Pet Tick Repellent Revenue Market Share by Region (2020-2031)
 Figure 16. Global Pet Tick Repellent Revenue Market Share Ranking (2024)
 Figure 17. Tier Distribution by Revenue Contribution (2020 VS 2024)
 Figure 18. Oral Medication Revenue Market Share by Player in 2024
 Figure 19. Spray Revenue Market Share by Player in 2024
 Figure 20. Powder Revenue Market Share by Player in 2024
 Figure 21. Other Revenue Market Share by Player in 2024
 Figure 22. Global Pet Tick Repellent Revenue Market Share by Type (2020-2031)
 Figure 23. Global Pet Tick Repellent Revenue Market Share by Application (2020-2031)
 Figure 24. North America Pet Tick Repellent Revenue YoY (2020-2031) & (US$ Million)
 Figure 25. North America Top 5 Players Pet Tick Repellent Revenue (US$ Million) in 2024
 Figure 26. North America Pet Tick Repellent Revenue (US$ Million) by Type (2020 - 2031)
 Figure 27. North America Pet Tick Repellent Revenue (US$ Million) by Application (2020-2031)
 Figure 28. US Pet Tick Repellent Revenue (2020-2031) & (US$ Million)
 Figure 29. Canada Pet Tick Repellent Revenue (2020-2031) & (US$ Million)
 Figure 30. Mexico Pet Tick Repellent Revenue (2020-2031) & (US$ Million)
 Figure 31. Europe Pet Tick Repellent Revenue YoY (2020-2031) & (US$ Million)
 Figure 32. Europe Top 5 Players Pet Tick Repellent Revenue (US$ Million) in 2024
 Figure 33. Europe Pet Tick Repellent Revenue (US$ Million) by Type (2020-2031)
 Figure 34. Europe Pet Tick Repellent Revenue (US$ Million) by Application (2020-2031)
 Figure 35. Germany Pet Tick Repellent Revenue (2020-2031) & (US$ Million)
 Figure 36. France Pet Tick Repellent Revenue (2020-2031) & (US$ Million)
 Figure 37. U.K. Pet Tick Repellent Revenue (2020-2031) & (US$ Million)
 Figure 38. Italy Pet Tick Repellent Revenue (2020-2031) & (US$ Million)
 Figure 39. Russia Pet Tick Repellent Revenue (2020-2031) & (US$ Million)
 Figure 40. Asia-Pacific Pet Tick Repellent Revenue YoY (2020-2031) & (US$ Million)
 Figure 41. Asia-Pacific Top 8 Players Pet Tick Repellent Revenue (US$ Million) in 2024
 Figure 42. Asia-Pacific Pet Tick Repellent Revenue (US$ Million) by Type (2020-2031)
 Figure 43. Asia-Pacific Pet Tick Repellent Revenue (US$ Million) by Application (2020-2031)
 Figure 44. Indonesia Pet Tick Repellent Revenue (2020-2031) & (US$ Million)
 Figure 45. Japan Pet Tick Repellent Revenue (2020-2031) & (US$ Million)
 Figure 46. South Korea Pet Tick Repellent Revenue (2020-2031) & (US$ Million)
 Figure 47. Australia Pet Tick Repellent Revenue (2020-2031) & (US$ Million)
 Figure 48. India Pet Tick Repellent Revenue (2020-2031) & (US$ Million)
 Figure 49. Indonesia Pet Tick Repellent Revenue (2020-2031) & (US$ Million)
 Figure 50. Vietnam Pet Tick Repellent Revenue (2020-2031) & (US$ Million)
 Figure 51. Malaysia Pet Tick Repellent Revenue (2020-2031) & (US$ Million)
 Figure 52. Philippines Pet Tick Repellent Revenue (2020-2031) & (US$ Million)
 Figure 53. Singapore Pet Tick Repellent Revenue (2020-2031) & (US$ Million)
 Figure 54. Central and South America Pet Tick Repellent Revenue YoY (2020-2031) & (US$ Million)
 Figure 55. Central and South America Top 5 Players Pet Tick Repellent Revenue (US$ Million) in 2024
 Figure 56. Central and South America Pet Tick Repellent Revenue (US$ Million) by Type (2020-2031)
 Figure 57. Central and South America Pet Tick Repellent Revenue (US$ Million) by Application (2020-2031)
 Figure 58. Brazil Pet Tick Repellent Revenue (2020-2025) & (US$ Million)
 Figure 59. Argentina Pet Tick Repellent Revenue (2020-2025) & (US$ Million)
 Figure 60. Middle East and Africa Pet Tick Repellent Revenue YoY (2020-2031) & (US$ Million)
 Figure 61. Middle East and Africa Top 5 Players Pet Tick Repellent Revenue (US$ Million) in 2024
 Figure 62. South America Pet Tick Repellent Revenue (US$ Million) by Type (2020-2031)
 Figure 63. Middle East and Africa Pet Tick Repellent Revenue (US$ Million) by Application (2020-2031)
 Figure 64. GCC Countries Pet Tick Repellent Revenue (2020-2025) & (US$ Million)
 Figure 65. Israel Pet Tick Repellent Revenue (2020-2025) & (US$ Million)
 Figure 66. Egypt Pet Tick Repellent Revenue (2020-2025) & (US$ Million)
 Figure 67. South Africa Pet Tick Repellent Revenue (2020-2025) & (US$ Million)
 Figure 68. Pet Tick Repellent Industry Chain Mapping
 Figure 69. Channels of Distribution (Direct Vs Distribution)
 Figure 70. Bottom-up and Top-down Approaches for This Report
 Figure 71. Data Triangulation
 Figure 72. Key Executives Interviewed
SELECT A FORMAT
Added to Cart
Electronic (PDF)

$4900

This license allows only one user to access the PDF.
Electronic (PDF)

$7350

This license allows 1 - 5 user to access the PDF, license is suitable for small groups of 5 users working together
Electronic (PDF)

$9800

This license allows users/teams in a same Enterprise to use this report, various departments within an enterpise can use this report
Add to Cart
Buy Now (15% Discount)

OUR CUSTOMER

Bioinformatics Barcelona