0
U.S. (TOLL FREE)
+1 (315) 215-3225
Automative

0
U.S. (TOLL FREE)
+1 (315) 215-3225
Embedded Analytics Market by Deployment Model (On-premise and Cloud-based), Business Application (Sales & Marketing, Finance, Operations, and Human Resource), Analytics Tool (Dashboard and Data Visualization, Self-service Tools, Benchmarking, and Reporting), and Industry Vertical (BFSI, IT & Telecom, Public Sector, Manufacturing, Energy & Utilities, Retail and Healthcare) - Global Opportunity Analysis and Industry Forecast, 2016-2023
Published Date: November 2019
|
Report Code: ALLI-Auto-3C203
Home | Market Reports
Embedded Analytics Market by Deployment Model On premise and Cloud based Business Application Sales Marketing Finance Operations and Human Resource Analytics Tool Dashboard and Data Visualization Self service Tools Benchmarking and Reporting and Industry Vertical BFSI IT Telecom Public Sector Manufacturing Energy Utilities Retail and Healthcare Global Opportunity Analysis and Industry Forecast 2016 2023
BUY CHAPTERS

Embedded Analytics Market by Deployment Model (On-premise and Cloud-based), Business Application (Sales & Marketing, Finance, Operations, and Human Resource), Analytics Tool (Dashboard and Data Visualization, Self-service Tools, Benchmarking, and Reporting), and Industry Vertical (BFSI, IT & Telecom, Public Sector, Manufacturing, Energy & Utilities, Retail and Healthcare) - Global Opportunity Analysis and Industry Forecast, 2016-2023

Code: ALLI-Auto-3C203
Report
November 2019
Pages:140
Allied Market Research
Buy Now with 15% Discount
DESCRIPTION
TABLE OF CONTENT
TABLES & FIGURES

Embedded Analytics Market

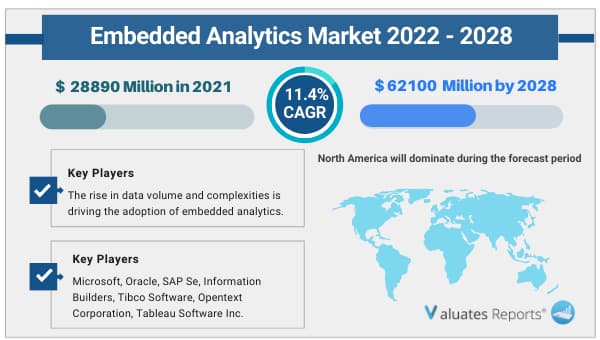
Embedded analytics market size was valued at USD 25,133 Million in 2016, and is projected to reach USD 60,281 Million by 2023, with a CAGR of 13.6% from 2017 to 2023. Embedded analytics market is the integration of data analytics capabilities within business applications, which include customer relationship management (CRM), marketing automation, enterprise resource planning (ERP), and financial systems. Such integration allows enterprises to easily access Business Intelligence (BI) tools while performing routine tasks, which helps in decision-making process
Packaging and Protective Packaging Market

Embedded analytics is a consumer-facing BI and analytics tool that is integrated into software applications of an enterprise and operates as a component of the innate application rather than a different platform. Analysis through this allows users to work with higher quality data and quick reporting. Analytics can be embedded into consumer portals, so that they can ask queries related to data with easy access to delivery tracking, invoices, and billing.

The global embedded analytics market is segmented based on deployment model, business application, analytics tool, industry vertical, and geography. Based on deployment model, it is bifurcated into on-premise and cloud-based. As per business application, the global industry is classified into sales & marketing, finance, operation, and human resource. Based on analytics tool, it is categorized into dashboards and data visualization, self-service tools, benchmarking, and reporting. Based on vertical, the global embedded analytics market is divided into banking, financial services, and insurance (BFSI); IT & telecom; public sector; manufacturing; retail; healthcare; energy & utilities; and others. Geographically, it is analyzed across North America, Europe, Asia-Pacific, and LAMEA.

The global market was valued at $25,133 million in 2016, and is expected to reach $60,281 million by 2023, growing at a CAGR of 13.6% from 2017 to 2023. The major factors that drive the embedded analytics market growth are emergence of big data and Internet of Technology (IoT) among organizations, increase in reliability on mobile devices and cloud technology, and rise in need to integrate data analytics with business applications to achieve optimum performance. Retail embedded analytics market is expected to witness second highest market growth, owing to surge in e-commerce data and large number of online transactions. BFSI is also one of the largest consumers of embedded analytics products, followed by IT & telecom vertical.

North America embedded analytics market generated highest revenue in 2016, attributed to adequate technology infrastructure, presence of large number of enterprises, and growth in demand for embedded analytics tools. The Asia-Pacific market is expected to grow at the highest CAGR, owing to enterprise mobility; rise in penetration of smartphones, laptops, and tablets; high penetration of internet; and surge in need of better data management.

The key players operating in the global industry include Birst, Inc., IBM Corporation, Information Builders, Logi Analytics, Microsoft Corporation, Microstrategy Inc., Opentext Corporation, Qlik Technologies, Inc., SAP SE, and TIBCO (The Information Bus Company) Software Inc. These players have expanded their market presence by adopting various business strategies such as acquisition, geographical expansion, product development, strategic alliance, and collaboration.

The following graph signifies the growth potential of the global embedded analytics market by industry vertical. It is observed that the market is driven by the BFSI vertical, which occupied the highest embedded analytics market share in 2016. The healthcare segment is expected to witness highest market growth, owing to rise in e-commerce data.

Embedded Analytics Market Trends

Emergence of Big Data and IoT Among Organizations

The importance of big data to enterprise executives is determined from the data collected. Initially, executives relied on structured data and stored such data in traditional databases. At present, information collected from social media and the Internet of Things (IoT) provides unstructured data that is constantly updated. Analysis of such huge data can provide new information for the enterprises that is expected to maintain a competitive environment in the business. This has urged the enterprises to embed analytics in the business applications.

Increase in Reliability On Mobile Devices and Cloud Technology

Cloud business analytics is implemented in numerous organizations as it offers scalable, elastic, and cost-efficient infrastructure without the need to maintain in-house infrastructure. Growing adoption of Big data and cloud computing has urged enterprises to implement a robust platform that can provide value for on-premise as well as hosted data.

High Investment Costs

Organizations using embedded analytics consider it as a major rising trend in business intelligence and analytics from the growing demand statistics. However, various costs associated with the implementation of embedded analytics in the enterprise hamper the growth of global market.

Embedded Analytics Market Segmentation

By Deployment Mode

    • On-premise
    • Cloud-based

By Business Application

    • SALES & MARKETING
    • FINANCE
    • OPERATIONS
    • HUMAN RESOURCE

By Analytics Tool

    • DASHBOARD AND DATA VISUALIZATION
    • SELF-SERVICE TOOLS
    • BENCHMARKING
    • REPORTING

By Industry Vertical

    • BANKING, FINANCIAL SERVICES, AND INSURANCE
    • IT & TELECOM
    • PUBLIC SECTOR
    • MANUFACTURING
    • RETAIL
    • HEALTHCARE
    • ENERGY & UTILITIES
    • OTHERS

By Geography

    • North America
      • U.S.
      • Canada
      • Mexico
    • Europe
      • UK
      • Germany
      • France
      • Italy
      • Rest of Europe
    • Asia-Pacific
      • Australia
      • China
      • India
      • Japan
      • Rest of Asia-Pacific
    • LAMEA
      • Latin America
      • Middle East
      • Africa

Key Players

  • BIRST, INC.
  • INTERNATIONAL BUSINESS MACHINES CORPORATION
  • INFORMATION BUILDERS
  • LOGI ANALYTICS
  • MICROSOFT CORPORATION
  • MICROSTRATEGY INC.
  • OPENTEXT CORPORATION
  • QLIK TECHNOLOGIES
  • SAP SE
  • TIBCO (THE INFORMATION BUS COMPANY) SOFTWARE INC.

Scope of Embedded Analytics Market Report

Report Metric

Details

Report Name

Embedded Analytics Market

Market size value in 2016

USD 25,133 Million

Revenue forecast in 2023

USD 60,281 Million

Growth Rate

13.6%

Base year considered

2016

Forecast Period

2017-2023

By Deployment Model

On-premise and Cloud-based

Business Application

Sales & Marketing, Finance, Operations, and Human Resource

By Analytics Tool

Dashboard and Data Visualization, Self-service Tools, Benchmarking, and Reporting

Industry Vertical

BFSI, IT & Telecom, Public Sector, Manufacturing, Energy & Utilities, Retail and Healthcare

Report Coverage

Revenue & volume forecast, company share, competitive landscape, growth factors, and trends

Segments Covered

By Type, Application, and Region

Geographic Regions Covered

North America, Europe, Asia Pacific, Latin America, Middle East & Africa

Frequently Asked Questions About This Report 

1. How big is the Embedded Analytics Market?

Ans. Embedded analytics market size was valued at $25,133 million in 2016, and is projected to reach $60,281million by 2023, with a CAGR of 13.6% from 2017 to 2023.

2. Who are the key players available in the Embedded Analytics Industry?

Ans. The key players operating in the global industry include Birst, Inc., IBM Corporation, Information Builders, Logi Analytics, Microsoft Corporation, Microstrategy Inc., Opentext Corporation, Qlik Technologies, Inc., SAP SE, and TIBCO (The Information Bus Company) Software Inc.

3. Does the report provides covid-19 impact analysis?

Ans. Yes, the report includes a COVID-19 impact analysis. Also, it is further extended into every individual segment of the report. 

TABLE OF CONTENT

 
CHAPTER 1 INTRODUCTION
1.1. REPORT DESCRIPTION
1.2. KEY BENEFITS
1.3. KEY MARKET SEGMENTS
1.4. RESEARCH METHODOLOGY
1.4.1. Primary research
1.4.2. Secondary research
1.4.3. Analyst tools and models
1.4.4. Market segmentation
 
CHAPTER 2 EXECUTIVE SUMMARY
2.1. CXO PERSPECTIVE
 
CHAPTER 3 MARKET OVERVIEW
3.1. MARKET DEFINITION AND SCOPE
3.2. KEY FINDINGS
3.2.1. Top winning strategies
3.2.2. Top investment pockets
3.2.3. Top impacting factors
3.3. PORTERS FIVE FORCES
3.3.1. Bargaining power of buyers
3.3.2. Bargaining power of suppliers
3.3.3. Degree of competition
3.3.4. Threat of new entrants
3.3.5. Threat of substitute
3.4. MARKET PLAYER POSITIONING
3.5. MARKET DYNAMICS
3.5.1. Drivers
3.5.1.1. Emergence of big data and IoT among organizations
3.5.1.2. Increase in reliability on mobile devices and cloud technology
3.5.1.3. Rising need of data integration with the business applications
3.5.2. Restraints
3.5.2.1. High investment costs
3.5.2.2. Lack of analytical knowledge among the enterprises
3.5.3. Opportunities
3.5.3.1. Rising demand for real-time visualization tools in business applications
3.5.3.2. High demand for standalone self-service analytics tools
 
CHAPTER 4 EMBEDDED ANALYTICS MARKET, BY DEPLOYMENT MODEL
4.1. OVERVIEW
4.2. ON-PREMISE
4.2.1. Key market trends
4.2.2. Key growth factors and opportunities
4.2.3. Market size and forecast
4.3. CLOUD-BASED
4.3.1. Key market trends
4.3.2. Key growth factors and opportunities
4.3.3. Market size and forecast
 
CHAPTER 5 EMBEDDED ANALYTICS MARKET, BY BUSINESS APPLICATION
5.1. OVERVIEW
5.2. SALES & MARKETING
5.2.1. Key market trends
5.2.2. Key growth factors and opportunities
5.2.3. Market size and forecast
5.3. FINANCE
5.3.1. Key market trends
5.3.2. Key growth factors and opportunities
5.3.3. Market size and forecast
5.4. OPERATIONS
5.4.1. Key market trends
5.4.2. Key growth factors and opportunities
5.4.3. Market size and forecast
5.5. HUMAN RESOURCE
5.5.1. Key market trends
5.5.2. Key growth factors and opportunities
5.5.3. Market size and forecast
 
CHAPTER 6 EMBEDDED ANALYTICS MARKET, BY ANALYTICS TOOL
6.1. OVERVIEW
6.2. DASHBOARD AND DATA VISUALIZATION
6.2.1. Key market trends
6.2.2. Key growth factors and opportunities
6.2.3. Market size and forecast
6.3. SELF-SERVICE TOOLS
6.3.1. Key market trends
6.3.2. Key growth factors and opportunities
6.3.3. Market size and forecast
6.4. BENCHMARKING
6.4.1. Key market trends
6.4.2. Key growth factors and opportunities
6.4.3. Market size and forecast
6.5. REPORTING
6.5.1. Key market trends
6.5.2. Key growth factors and opportunities
6.5.3. Market size and forecast
 
CHAPTER 7 EMBEDDED ANALYTICS MARKET, BY INDUSTRY VERTICAL
7.1. OVERVIEW
7.2. BANKING, FINANCIAL SERVICES, AND INSURANCE
7.2.1. Key market trends
7.2.2. Key growth factors and opportunities
7.2.3. Market size and forecast
7.3. IT & TELECOM
7.3.1. Key market trends
7.3.2. Key growth factors and opportunities
7.3.3. Market size and forecast
7.4. PUBLIC SECTOR
7.4.1. Key market trends
7.4.2. Key growth factors and opportunities
7.4.3. Market size and forecast
7.5. MANUFACTURING
7.5.1. Key market trends
7.5.2. Key growth factors and opportunities
7.5.3. Market size and forecast
7.6. RETAIL
7.6.1. Key market trends
7.6.2. Key growth factors and opportunities
7.6.3. Market size and forecast
7.7. HEALTHCARE
7.7.1. Key market trends
7.7.2. Key growth factors and opportunities
7.7.3. Market size and forecast
7.8. ENERGY & UTILITIES
7.8.1. Key market trends
7.8.2. Key growth factors and opportunities
7.8.3. Market size and forecast
7.9. OTHERS
7.9.1. Key market trends
7.9.2. Key growth factors and opportunities
7.9.3. Market size and forecast
 
CHAPTER 8 EMBEDDED ANALYTICS MARKET, BY GEOGRAPHY
8.1. OVERVIEW
8.2. NORTH AMERICA
8.2.1. Key trends
8.2.2. Key growth factors and opportunities
8.2.3. Market size and forecast
8.2.4. U.S.
8.2.4.1. Market size and forecast
8.2.5. Canada
8.2.5.1. Market size and forecast
8.2.6. Mexico
8.2.6.1. Market size and forecast
8.3. EUROPE
8.3.1. Key market trends
8.3.2. Key growth factors and opportunities
8.3.3. Market size and forecast
8.3.4. UK
8.3.4.1. Market size and forecast
8.3.5. Germany
8.3.5.1. Market size and forecast
8.3.6. France
8.3.6.1. Market size and forecast
8.3.7. Italy
8.3.7.1. Market size and forecast
8.3.8. Rest of Europe
8.3.8.1. Market size and forecast
8.4. ASIA-PACIFIC
8.4.1. Key market trends
8.4.2. Key growth factors and opportunities
8.4.3. Market size and forecast
8.4.4. Australia
8.4.4.1. Market size and forecast
8.4.5. China
8.4.5.1. Market size and forecast
8.4.6. India
8.4.6.1. Market size and forecast
8.4.7. Japan
8.4.7.1. Market size and forecast
8.4.8. Rest of Asia-Pacific
8.4.8.1. Market size and forecast
8.5. LAMEA
8.5.1. Key market trends
8.5.2. Key growth factors and opportunities
8.5.3. Market size and forecast
8.5.4. Latin America
8.5.4.1. Market size and forecast
8.5.5. Middle East
8.5.5.1. Market size and forecast
8.5.6. Africa
8.5.6.1. Market size and forecast
 
CHAPTER 9 COMPANY PROFILES
9.1. BIRST, INC.
9.1.1. Company overview
9.1.2. Company snapshot
9.1.3. Business performance
9.1.4. Key strategic moves and developments
9.2. INTERNATIONAL BUSINESS MACHINES CORPORATION
9.2.1. Company overview
9.2.2. Company snapshot
9.2.3. Business performance
9.2.4. Key strategic moves and developments
9.3. INFORMATION BUILDERS
9.3.1. Company overview
9.3.2. Company snapshot
9.3.3. Business performance
9.3.4. Key strategic moves and developments
9.4. LOGI ANALYTICS
9.4.1. Company overview
9.4.2. Company snapshot
9.4.3. Business performance
9.4.4. Key strategic moves and developments
9.5. MICROSOFT CORPORATION
9.5.1. Company overview
9.5.2. Company snapshot
9.5.3. Business performance
9.5.4. Key strategic moves and developments
9.6. MICROSTRATEGY INC.
9.6.1. Company overview
9.6.2. Company snapshot
9.6.3. Business performance
9.6.4. Key strategic moves and developments
9.7. OPENTEXT CORPORATION
9.7.1. Company overview
9.7.2. Company snapshot
9.7.3. Business performance
9.7.4. Key strategic moves and developments
9.8. QLIK TECHNOLOGIES
9.8.1. Company overview
9.8.2. Company snapshot
9.8.3. Business performance
9.8.4. Key strategic moves and developments
9.9. SAP SE
9.9.1. Company overview
9.9.2. Company snapshot
9.9.3. Business performance
9.9.4. Key strategic moves and developments
9.10. TIBCO (THE INFORMATION BUS COMPANY) SOFTWARE INC.
9.10.1. Company overview
9.10.2. Company snapshot
9.10.3. Business performance
9.10.4. Key strategic moves and development
TABLE 1. GLOBAL EMBEDDED ANALYTICS MARKET BY DEPLOYMENT MODEL, 2016-2023 ($MILLION)
TABLE 2. GLOBAL EMBEDDED ANALYTICS MARKET FOR ON-PREMISE DEPLOYMENT BY REGION, 2016-2023 ($MILLION)
TABLE 3. GLOBAL EMBEDDED ANALYTICS MARKET FOR CLOUD-BASED DEPLOYMENT BY REGION, 2016-2023 ($MILLION)
TABLE 4. GLOBAL EMBEDDED ANALYTICS MARKET BY BUSINESS APPLICATION, 2016-2023 ($MILLION)
TABLE 5. GLOBAL EMBEDDED ANALYTICS MARKET FOR SALES & MARKETING BY REGION, 2016-2023 ($MILLION)
TABLE 6. GLOBAL EMBEDDED ANALYTICS MARKET FOR FINANCE BY REGION, 2016-2023 ($MILLION)
TABLE 7. GLOBAL EMBEDDED ANALYTICS MARKET FOR OPERATIONS BY REGION, 2016-2023 ($MILLION)
TABLE 8. GLOBAL EMBEDDED ANALYTICS MARKET FOR HUMAN RESOURCE BY REGION, 2016-2023 ($MILLION)
TABLE 9. GLOBAL EMBEDDED ANALYTICS MARKET BY ANALYTICS TOOL, 2016-2023 ($MILLION)
TABLE 10. GLOBAL EMBEDDED ANALYTICS MARKET FOR DASHBOARD AND DATA VISUALIZATION BY REGION, 2016-2023 ($MILLION)
TABLE 11. GLOBAL EMBEDDED ANALYTICS MARKET FOR SELF-SERVICE TOOLS BY REGION, 2016-2023 ($MILLION)
TABLE 12. GLOBAL EMBEDDED ANALYTICS MARKET FOR BENCHMARKING BY REGION, 2016-2023 ($MILLION)
TABLE 13. GLOBAL EMBEDDED ANALYTICS MARKET FOR REPORTING BY REGION, 2016-2023 ($MILLION)
TABLE 14. GLOBAL EMBEDDED ANALYTICS MARKET BY INDUSTRY VERTICAL, 2016-2023 ($MILLION)
TABLE 15. GLOBAL EMBEDDED ANALYTICS MARKET FOR BFSI BY REGION, 2016-2023 ($MILLION)
TABLE 16. GLOBAL EMBEDDED ANALYTICS MARKET FOR IT & TELECOM BY REGION, 2016-2023 ($MILLION)
TABLE 17. GLOBAL EMBEDDED ANALYTICS MARKET FOR PUBLIC SECTOR BY REGION, 2016-2023 ($MILLION)
TABLE 18. GLOBAL EMBEDDED ANALYTICS MARKET FOR MANUFACTURING BY REGION, 2016-2023 ($MILLION)
TABLE 19. GLOBAL EMBEDDED ANALYTICS MARKET FOR RETAIL BY REGION, 2016-2023 ($MILLION)
TABLE 20. GLOBAL EMBEDDED ANALYTICS MARKET FOR HEALTHCARE BY REGION, 2016-2023 ($MILLION)
TABLE 21. GLOBAL EMBEDDED ANALYTICS MARKET FOR ENERGY & UTILITIES BY REGION, 2016-2023 ($MILLION)
TABLE 22. GLOBAL EMBEDDED ANALYTICS MARKET FOR OTHERS BY REGION, 2016-2023 ($MILLION)
TABLE 23. EMBEDDED ANALYTICS MARKET BY GEOGRAPHY, 2016-2023 ($MILLION)
TABLE 24. NORTH AMERICA EMBEDDED ANALYTICS MARKET BY COUNTRY, 2016-2023 ($MILLION)
TABLE 25. EUROPE EMBEDDED ANALYTICS MARKET BY COUNTRY, 2016-2023 ($MILLION)
TABLE 26. ASIA-PACIFIC EMBEDDED ANALYTICS MARKET BY COUNTRY, 2016-2023 ($MILLION)
TABLE 27. LAMEA EMBEDDED ANALYTICS MARKET BY COUNTRY, 2016-2023 ($MILLION)
TABLE 28. COMPANY SNAPSHOT: BIRST, INC.
TABLE 29. COMPANY SNAPSHOT: IBM CORPORATION
TABLE 30. COMPANY SNAPSHOT: INFORMATION BUILDERS
TABLE 31. COMPANY SNAPSHOT: LOGI ANALYTICS
TABLE 32. COMPANY SNAPSHOT: MICROSOFT CORPORATION
TABLE 33. COMPANY SNAPSHOT: MICROSTRATEGY, INC.
TABLE 34. COMPANY SNAPSHOT: OPENTEXT CORPORATION
TABLE 35. COMPANY SNAPSHOT: QLIK TECHNOLOGIES
TABLE 36. COMPANY SNAPSHOT: SAP SE
TABLE 37. COMPANY SNAPSHOT: TIBCO SOFTWARE INC. FIGURE 1. MARKET SEGMENTATION: EMBEDDED ANALYTICS MARKET
FIGURE 2. TOP WINNING STRATEGIES, 2013-2017 (%)
FIGURE 3. TOP WINNING STRATEGIES, 2013-2017
FIGURE 4. TOP INVESTMENT POCKETS
FIGURE 5. TOP IMPACTING FACTORS
FIGURE 6. PORTERS FIVE FORCES ANALYSIS
FIGURE 7. BARGAINING POWER OF BUYERS
FIGURE 8. BARGAINING POWER OF SUPPLIERS
FIGURE 9. DEGREE OF COMPETITION
FIGURE 10. THREAT OF NEW ENTRANTS
FIGURE 11. THREAT OF SUBSTITUTES
FIGURE 12. MARKET PLAYER POSITIONING, 2015
FIGURE 13. DRIVERS, RESTRAINTS, AND OPPORTUNITIES
FIGURE 14. GLOBAL EMBEDDED ANALYTICS MARKET FOR ON-PREMISE DEPLOYMENT, 2016-2023 ($MILLION)
FIGURE 15. GLOBAL EMBEDDED ANALYTICS MARKET FOR CLOUD-BASED DEPLOYMENT, 2016-2023 ($MILLION)
FIGURE 16. GLOBAL EMBEDDED ANALYTICS MARKET FOR SALES & MARKETING, 2016-2023 ($MILLION)
FIGURE 17. GLOBAL EMBEDDED ANALYTICS MARKET FOR FINANCE, 2016-2023 ($MILLION)
FIGURE 18. GLOBAL EMBEDDED ANLYTICS MARKET FOR OPERATIONS, 2016-2023 ($MILLION)
FIGURE 19. GLOBAL EMBEDDED ANLYTICS MARKET FOR HUMAN RESOURCE, 2016-2023 ($MILLION)
FIGURE 20. GLOBAL EMBEDDED ANALYTICS MARKET FOR DASHBOARD AND DATA VISUALIZATION, 2016-2023 ($MILLION)
FIGURE 21. GLOBAL EMBEDDED ANALYTICS MARKET FOR SELF-SERVICE TOOLS, 2016-2023 ($MILLION)
FIGURE 22. GLOBAL EMBEDDED ANLYTICS MARKET FOR BENCHMARKING, 2016-2023 ($MILLION)
FIGURE 23. GLOBAL EMBEDDED ANLYTICS MARKET FOR REPORTING, 2016-2023 ($MILLION)
FIGURE 24. GLOBAL EMBEDDED ANALYTICS MARKET FOR BFSI, 2016-2023 ($MILLION)
FIGURE 25. GLOBAL EMBEDDED ANALYTICS MARKET FOR IT & TELECOM, 2016-2023 ($MILLION)
FIGURE 26. GLOBAL EMBEDDED ANALYTICS MARKET FOR PUBLIC SECTOR, 2016-2023 ($MILLION)
FIGURE 27. GLOBAL EMBEDDED ANALYTICS MARKET FOR MANUFACTURING, 2016-2023 ($MILLION)
FIGURE 28. GLOBAL EMBEDDED ANALYTICS MARKET FOR RETAIL, 2016-2023 ($MILLION)
FIGURE 29. GLOBAL EMBEDDED ANALYTICS MARKET FOR HEALTHCARE, 2016-2023 ($MILLION)
FIGURE 30. GLOBAL EMBEDDED ANALYTICS MARKET FOR ENERGY & UTILITIES, 2016-2023 ($MILLION)
FIGURE 31. GLOBAL EMBEDDED ANALYTICS MARKET FOR OTHERS, 2016-2023 ($MILLION)
FIGURE 32. GLOBAL EMBEDDED ANALYTICS MARKET BY GEOGRAPHY, MARKET SHARE (2016) AND CAGR (2017-2023, %)
FIGURE 33. NORTH AMERICA EMBEDDED ANALYTICS MARKET, 2016-2023 ($MILLION)
FIGURE 34. U.S. EMBEDDED ANALYTICS MARKET, 2016-2023 ($MILLION)
FIGURE 35. CANADA EMBEDDED ANALYTICS MARKET, 2016-2023 ($MILLION)
FIGURE 36. MEXICO EMBEDDED ANALYTICS MARKET, 2016-2023 ($MILLION)
FIGURE 37. EUROPE EMBEDDED ANALYTICS MARKET, 2016-2023 ($MILLION)
FIGURE 38. UK EMBEDDED ANALYTICS MARKET, 2016-2023 ($MILLION)
FIGURE 39. GERMANY EMBEDDED ANALYTICS MARKET, 2016-2023 ($MILLION)
FIGURE 40. FRANCE EMBEDDED ANALYTICS MARKET, 2016-2023 ($MILLION)
FIGURE 41. ITALY EMBEDDED ANALYTICS MARKET, 2016-2023 ($MILLION)
FIGURE 42. REST OF EUROPE EMBEDDED ANALYTICS MARKET, 2016-2023 ($MILLION)
FIGURE 43. ASIA-PACIFIC EMBEDDED ANALYTICS MARKET, 2016-2023 ($MILLION)
FIGURE 44. AUSTRALIA EMBEDDED ANALYTICS MARKET, 2016-2023 ($MILLION)
FIGURE 45. CHINA EMBEDDED ANALYTICS MARKET, 2016-2023 ($MILLION)
FIGURE 46. INDIA EMBEDDED ANALYTICS MARKET, 2016-2023 ($MILLION)
FIGURE 47. JAPAN EMBEDDED ANALYTICS MARKET, 2016-2023 (MILLION)
FIGURE 48. REST OF ASIA-PACIFIC EMBEDDED ANALYTICS MARKET, 2016-2023 ($MILLION)
FIGURE 49. LAMEA EMBEDDED ANALYTICS MARKET, 2016-2023 ($MILLION)
FIGURE 50. LATIN AMERICA EMBEDDED ANALYTICS MARKET, 2016-2023 ($MILLION)
FIGURE 51. MIDDLE EAST EMBEDDED ANALYTICS MARKET, 2016-2023 ($MILLION)
FIGURE 52. AFRICA EMBEDDED ANALYTICS MARKET, 2016-2023 ($MILLION)
FIGURE 53. BIRST, INC.: FINANCIAL PERFORMANCE
FIGURE 54. IBM CORPORATION: FINANCIAL PERFORMANCE
FIGURE 55. INFORMATION BUILDERS: FINANCIAL PERFORMANCE
FIGURE 56. LOGI ANALYTICS: FINANCIAL PERFORMANCE
FIGURE 57. MICROSOFT CORPORATION: FINANCIAL PERFORMANCE
FIGURE 58. MICROSTRATEGY, INC.: FINANCIAL PERFORMANCE
FIGURE 59. OPENTEXT CORPORATION: FINANCIAL PERFORMANCE
FIGURE 60. QLIK TECHNOLOGIES: FINANCIAL PERFORMANCE
FIGURE 61. SAP SE: FINANCIAL PERFORMANCE
FIGURE 62. TIBCO SOFTWARE INC.: FINANCIAL PERFORMANC
SELECT A FORMAT
Added to Cart
Electronic (PDF)

$4588

This license allows only one user to access the PDF.
Electronic (PDF)

$7030

This license allows users/teams in a same Enterprise to use this report, various departments within an enterpise can use this report
Add to Cart
Buy Now (15% Discount)

OUR CUSTOMER

Seventh Sense AI