List of Tables
Table 1. Global Virus Transport and Preservation Medium Market Value by Type (US$ Million), 2025 vs 2032
Table 2. Global Virus Transport and Preservation Medium Market Value by Preservation Temperature Requirement (US$ Million), 2025 vs 2032
Table 3. Global Virus Transport and Preservation Medium Market Value by Application (US$ Million), 2025 vs 2032
Table 4. Global Virus Transport and Preservation Medium Market Competitive Situation by Manufacturers in 2025
Table 5. Global Virus Transport and Preservation Medium Sales (M Units) of Key Manufacturers (2021–2026)
Table 6. Global Virus Transport and Preservation Medium Sales Market Share by Manufacturers (2021–2026)
Table 7. Global Virus Transport and Preservation Medium Revenue (US$ Million) by Manufacturers (2021–2026)
Table 8. Global Virus Transport and Preservation Medium Revenue Share by Manufacturers (2021–2026)
Table 9. Global Market Virus Transport and Preservation Medium Average Price (US$/Unit) of Key Manufacturers (2021–2026)
Table 10. Global Key Players of Virus Transport and Preservation Medium, Industry Ranking, 2023 vs 2024 vs 2025
Table 11. Global Key Manufacturers of Virus Transport and Preservation Medium, Manufacturing Sites and Headquarters
Table 12. Global Key Manufacturers of Virus Transport and Preservation Medium, Product Types and Applications
Table 13. Global Key Manufacturers of Virus Transport and Preservation Medium, Date of Entry into the Industry
Table 14. Global Manufacturers Market Concentration Ratio (CR5 and HHI)
Table 15. Global Virus Transport and Preservation Medium Companies by Tier (Tier 1, Tier 2, Tier 3), based on Virus Transport and Preservation Medium Revenue, 2025
Table 16. Manufacturers Mergers & Acquisitions, Expansion Plans
Table 17. Global Virus Transport and Preservation Medium Market Size by Region (US$ Million): 2021 vs 2025 vs 2032
Table 18. Global Virus Transport and Preservation Medium Sales by Region (M Units), 2021–2026
Table 19. Global Virus Transport and Preservation Medium Sales Market Share by Region (2021–2026)
Table 20. Global Virus Transport and Preservation Medium Sales by Region (M Units), 2027–2032
Table 21. Global Virus Transport and Preservation Medium Sales Market Share by Region (2027–2032)
Table 22. Global Virus Transport and Preservation Medium Revenue by Region (US$ Million), 2021–2026
Table 23. Global Virus Transport and Preservation Medium Revenue Market Share by Region (2021–2026)
Table 24. Global Virus Transport and Preservation Medium Revenue by Region (US$ Million), 2027–2032
Table 25. Global Virus Transport and Preservation Medium Revenue Market Share by Region (2027–2032)
Table 26. North America Virus Transport and Preservation Medium Revenue by Country: 2021 vs 2025 vs 2032 (US$ Million)
Table 27. North America Virus Transport and Preservation Medium Sales by Country (M Units), 2021–2026
Table 28. North America Virus Transport and Preservation Medium Sales by Country (M Units), 2027–2032
Table 29. North America Virus Transport and Preservation Medium Revenue by Country (US$ Million), 2021–2026
Table 30. North America Virus Transport and Preservation Medium Revenue by Country (US$ Million), 2027–2032
Table 31. Europe Virus Transport and Preservation Medium Revenue by Country: 2021 vs 2025 vs 2032 (US$ Million)
Table 32. Europe Virus Transport and Preservation Medium Sales by Country (M Units), 2021–2026
Table 33. Europe Virus Transport and Preservation Medium Sales by Country (M Units), 2027–2032
Table 34. Europe Virus Transport and Preservation Medium Revenue by Country (US$ Million), 2021–2026
Table 35. Europe Virus Transport and Preservation Medium Revenue by Country (US$ Million), 2027–2032
Table 36. Asia Pacific Virus Transport and Preservation Medium Revenue by Region: 2021 vs 2025 vs 2032 (US$ Million)
Table 37. Asia Pacific Virus Transport and Preservation Medium Sales by Region (M Units), 2021–2026
Table 38. Asia Pacific Virus Transport and Preservation Medium Sales by Region (M Units), 2027–2032
Table 39. Asia Pacific Virus Transport and Preservation Medium Revenue by Region (US$ Million), 2021–2026
Table 40. Asia Pacific Virus Transport and Preservation Medium Revenue by Region (US$ Million), 2027–2032
Table 41. Latin America Virus Transport and Preservation Medium Revenue by Country: 2021 vs 2025 vs 2032 (US$ Million)
Table 42. Latin America Virus Transport and Preservation Medium Sales by Country (M Units), 2021–2026
Table 43. Latin America Virus Transport and Preservation Medium Sales by Country (M Units), 2027–2032
Table 44. Latin America Virus Transport and Preservation Medium Revenue by Country (US$ Million), 2021–2026
Table 45. Latin America Virus Transport and Preservation Medium Revenue by Country (US$ Million), 2027–2032
Table 46. Middle East and Africa Virus Transport and Preservation Medium Revenue by Country: 2021 vs 2025 vs 2032 (US$ Million)
Table 47. Middle East and Africa Virus Transport and Preservation Medium Sales by Country (M Units), 2021–2026
Table 48. Middle East and Africa Virus Transport and Preservation Medium Sales by Country (M Units), 2027–2032
Table 49. Middle East and Africa Virus Transport and Preservation Medium Revenue by Country (US$ Million), 2021–2026
Table 50. Middle East and Africa Virus Transport and Preservation Medium Revenue by Country (US$ Million), 2027–2032
Table 51. Global Virus Transport and Preservation Medium Sales (M Units) by Type (2021–2026)
Table 52. Global Virus Transport and Preservation Medium Sales (M Units) by Type (2027–2032)
Table 53. Global Virus Transport and Preservation Medium Sales Market Share by Type (2021–2026)
Table 54. Global Virus Transport and Preservation Medium Sales Market Share by Type (2027–2032)
Table 55. Global Virus Transport and Preservation Medium Revenue (US$ Million) by Type (2021–2026)
Table 56. Global Virus Transport and Preservation Medium Revenue (US$ Million) by Type (2027–2032)
Table 57. Global Virus Transport and Preservation Medium Revenue Market Share by Type (2021–2026)
Table 58. Global Virus Transport and Preservation Medium Revenue Market Share by Type (2027–2032)
Table 59. Global Virus Transport and Preservation Medium Price (US$/Unit) by Type (2021–2026)
Table 60. Global Virus Transport and Preservation Medium Price (US$/Unit) by Type (2027–2032)
Table 61. Global Virus Transport and Preservation Medium Sales (M Units) by Application (2021–2026)
Table 62. Global Virus Transport and Preservation Medium Sales (M Units) by Application (2027–2032)
Table 63. Global Virus Transport and Preservation Medium Sales Market Share by Application (2021–2026)
Table 64. Global Virus Transport and Preservation Medium Sales Market Share by Application (2027–2032)
Table 65. Global Virus Transport and Preservation Medium Revenue (US$ Million) by Application (2021–2026)
Table 66. Global Virus Transport and Preservation Medium Revenue (US$ Million) by Application (2027–2032)
Table 67. Global Virus Transport and Preservation Medium Revenue Market Share by Application (2021–2026)
Table 68. Global Virus Transport and Preservation Medium Revenue Market Share by Application (2027–2032)
Table 69. Global Virus Transport and Preservation Medium Price (US$/Unit) by Application (2021–2026)
Table 70. Global Virus Transport and Preservation Medium Price (US$/Unit) by Application (2027–2032)
Table 71. Copan Diagnostics Company Information
Table 72. Copan Diagnostics Description and Business Overview
Table 73. Copan Diagnostics Virus Transport and Preservation Medium Sales (M Units), Revenue (US$ Million), Price (US$/Unit), and Gross Margin (2021–2026)
Table 74. Copan Diagnostics Virus Transport and Preservation Medium Product
Table 75. Copan Diagnostics Recent Developments/Updates
Table 76. EKF Diagnostics Holdings Company Information
Table 77. EKF Diagnostics Holdings Description and Business Overview
Table 78. EKF Diagnostics Holdings Virus Transport and Preservation Medium Sales (M Units), Revenue (US$ Million), Price (US$/Unit), and Gross Margin (2021–2026)
Table 79. EKF Diagnostics Holdings Virus Transport and Preservation Medium Product
Table 80. EKF Diagnostics Holdings Recent Developments/Updates
Table 81. Mole Bioscience Company Information
Table 82. Mole Bioscience Description and Business Overview
Table 83. Mole Bioscience Virus Transport and Preservation Medium Sales (M Units), Revenue (US$ Million), Price (US$/Unit), and Gross Margin (2021–2026)
Table 84. Mole Bioscience Virus Transport and Preservation Medium Product
Table 85. Mole Bioscience Recent Developments/Updates
Table 86. Ruhof Company Information
Table 87. Ruhof Description and Business Overview
Table 88. Ruhof Virus Transport and Preservation Medium Sales (M Units), Revenue (US$ Million), Price (US$/Unit), and Gross Margin (2021–2026)
Table 89. Ruhof Virus Transport and Preservation Medium Product
Table 90. Ruhof Recent Developments/Updates
Table 91. Biocomma Company Information
Table 92. Biocomma Description and Business Overview
Table 93. Biocomma Virus Transport and Preservation Medium Sales (M Units), Revenue (US$ Million), Price (US$/Unit), and Gross Margin (2021–2026)
Table 94. Biocomma Virus Transport and Preservation Medium Product
Table 95. Biocomma Recent Developments/Updates
Table 96. Goldsite Diagnostics Company Information
Table 97. Goldsite Diagnostics Description and Business Overview
Table 98. Goldsite Diagnostics Virus Transport and Preservation Medium Sales (M Units), Revenue (US$ Million), Price (US$/Unit), and Gross Margin (2021–2026)
Table 99. Goldsite Diagnostics Virus Transport and Preservation Medium Product
Table 100. Goldsite Diagnostics Recent Developments/Updates
Table 101. BioServUK Company Information
Table 102. BioServUK Description and Business Overview
Table 103. BioServUK Virus Transport and Preservation Medium Sales (M Units), Revenue (US$ Million), Price (US$/Unit), and Gross Margin (2021–2026)
Table 104. BioServUK Virus Transport and Preservation Medium Product
Table 105. BioServUK Recent Developments/Updates
Table 106. Biologix Group Limited Company Information
Table 107. Biologix Group Limited Description and Business Overview
Table 108. Biologix Group Limited Virus Transport and Preservation Medium Sales (M Units), Revenue (US$ Million), Price (US$/Unit), and Gross Margin (2021–2026)
Table 109. Biologix Group Limited Virus Transport and Preservation Medium Product
Table 110. Biologix Group Limited Recent Developments/Updates
Table 111. Hardy Diagnostics Company Information
Table 112. Hardy Diagnostics Description and Business Overview
Table 113. Hardy Diagnostics Virus Transport and Preservation Medium Sales (M Units), Revenue (US$ Million), Price (US$/Unit), and Gross Margin (2021–2026)
Table 114. Hardy Diagnostics Virus Transport and Preservation Medium Product
Table 115. Hardy Diagnostics Recent Developments/Updates
Table 116. Huachenyang (Shenzhen)Technology Co., Ltd. Company Information
Table 117. Huachenyang (Shenzhen)Technology Co., Ltd. Description and Business Overview
Table 118. Huachenyang (Shenzhen)Technology Co., Ltd. Virus Transport and Preservation Medium Sales (M Units), Revenue (US$ Million), Price (US$/Unit), and Gross Margin (2021–2026)
Table 119. Huachenyang (Shenzhen)Technology Co., Ltd. Virus Transport and Preservation Medium Product
Table 120. Huachenyang (Shenzhen)Technology Co., Ltd. Recent Developments/Updates
Table 121. Thermo Fisher Scientific Company Information
Table 122. Thermo Fisher Scientific Description and Business Overview
Table 123. Thermo Fisher Scientific Virus Transport and Preservation Medium Sales (M Units), Revenue (US$ Million), Price (US$/Unit), and Gross Margin (2021–2026)
Table 124. Thermo Fisher Scientific Virus Transport and Preservation Medium Product
Table 125. Thermo Fisher Scientific Recent Developments/Updates
Table 126. Longhorn Vaccines and Diagnostics Company Information
Table 127. Longhorn Vaccines and Diagnostics Description and Business Overview
Table 128. Longhorn Vaccines and Diagnostics Virus Transport and Preservation Medium Sales (M Units), Revenue (US$ Million), Price (US$/Unit), and Gross Margin (2021–2026)
Table 129. Longhorn Vaccines and Diagnostics Virus Transport and Preservation Medium Product
Table 130. Longhorn Vaccines and Diagnostics Recent Developments/Updates
Table 131. Liofilchem Company Information
Table 132. Liofilchem Description and Business Overview
Table 133. Liofilchem Virus Transport and Preservation Medium Sales (M Units), Revenue (US$ Million), Price (US$/Unit), and Gross Margin (2021–2026)
Table 134. Liofilchem Virus Transport and Preservation Medium Product
Table 135. Liofilchem Recent Developments/Updates
Table 136. Capricorn Scientific Company Information
Table 137. Capricorn Scientific Description and Business Overview
Table 138. Capricorn Scientific Virus Transport and Preservation Medium Sales (M Units), Revenue (US$ Million), Price (US$/Unit), and Gross Margin (2021–2026)
Table 139. Capricorn Scientific Virus Transport and Preservation Medium Product
Table 140. Capricorn Scientific Recent Developments/Updates
Table 141. Bio-Med Company Information
Table 142. Bio-Med Description and Business Overview
Table 143. Bio-Med Virus Transport and Preservation Medium Sales (M Units), Revenue (US$ Million), Price (US$/Unit), and Gross Margin (2021–2026)
Table 144. Bio-Med Virus Transport and Preservation Medium Product
Table 145. Bio-Med Recent Developments/Updates
Table 146. Mantacc Company Information
Table 147. Mantacc Description and Business Overview
Table 148. Mantacc Virus Transport and Preservation Medium Sales (M Units), Revenue (US$ Million), Price (US$/Unit), and Gross Margin (2021–2026)
Table 149. Mantacc Virus Transport and Preservation Medium Product
Table 150. Mantacc Recent Developments/Updates
Table 151. Medline Industries Company Information
Table 152. Medline Industries Description and Business Overview
Table 153. Medline Industries Virus Transport and Preservation Medium Sales (M Units), Revenue (US$ Million), Price (US$/Unit), and Gross Margin (2021–2026)
Table 154. Medline Industries Virus Transport and Preservation Medium Product
Table 155. Medline Industries Recent Developments/Updates
Table 156. Shandong Chengwu Medical Products Factory Company Information
Table 157. Shandong Chengwu Medical Products Factory Description and Business Overview
Table 158. Shandong Chengwu Medical Products Factory Virus Transport and Preservation Medium Sales (M Units), Revenue (US$ Million), Price (US$/Unit), and Gross Margin (2021–2026)
Table 159. Shandong Chengwu Medical Products Factory Virus Transport and Preservation Medium Product
Table 160. Shandong Chengwu Medical Products Factory Recent Developments/Updates
Table 161. BD Company Information
Table 162. BD Description and Business Overview
Table 163. BD Virus Transport and Preservation Medium Sales (M Units), Revenue (US$ Million), Price (US$/Unit), and Gross Margin (2021–2026)
Table 164. BD Virus Transport and Preservation Medium Product
Table 165. BD Recent Developments/Updates
Table 166. FC-BIOS SDN BHD Company Information
Table 167. FC-BIOS SDN BHD Description and Business Overview
Table 168. FC-BIOS SDN BHD Virus Transport and Preservation Medium Sales (M Units), Revenue (US$ Million), Price (US$/Unit), and Gross Margin (2021–2026)
Table 169. FC-BIOS SDN BHD Virus Transport and Preservation Medium Product
Table 170. FC-BIOS SDN BHD Recent Developments/Updates
Table 171. Medical Wire & Equipment Company Information
Table 172. Medical Wire & Equipment Description and Business Overview
Table 173. Medical Wire & Equipment Virus Transport and Preservation Medium Sales (M Units), Revenue (US$ Million), Price (US$/Unit), and Gross Margin (2021–2026)
Table 174. Medical Wire & Equipment Virus Transport and Preservation Medium Product
Table 175. Medical Wire & Equipment Recent Developments/Updates
Table 176. Biosigma Company Information
Table 177. Biosigma Description and Business Overview
Table 178. Biosigma Virus Transport and Preservation Medium Sales (M Units), Revenue (US$ Million), Price (US$/Unit), and Gross Margin (2021–2026)
Table 179. Biosigma Virus Transport and Preservation Medium Product
Table 180. Biosigma Recent Developments/Updates
Table 181. BIOBASE Company Information
Table 182. BIOBASE Description and Business Overview
Table 183. BIOBASE Virus Transport and Preservation Medium Sales (M Units), Revenue (US$ Million), Price (US$/Unit), and Gross Margin (2021–2026)
Table 184. BIOBASE Virus Transport and Preservation Medium Product
Table 185. BIOBASE Recent Developments/Updates
Table 186. Aptaca Company Information
Table 187. Aptaca Description and Business Overview
Table 188. Aptaca Virus Transport and Preservation Medium Sales (M Units), Revenue (US$ Million), Price (US$/Unit), and Gross Margin (2021–2026)
Table 189. Aptaca Virus Transport and Preservation Medium Product
Table 190. Aptaca Recent Developments/Updates
Table 191. Orient Gene Company Information
Table 192. Orient Gene Description and Business Overview
Table 193. Orient Gene Virus Transport and Preservation Medium Sales (M Units), Revenue (US$ Million), Price (US$/Unit), and Gross Margin (2021–2026)
Table 194. Orient Gene Virus Transport and Preservation Medium Product
Table 195. Orient Gene Recent Developments/Updates
Table 196. Darui Biotech Company Information
Table 197. Darui Biotech Description and Business Overview
Table 198. Darui Biotech Virus Transport and Preservation Medium Sales (M Units), Revenue (US$ Million), Price (US$/Unit), and Gross Margin (2021–2026)
Table 199. Darui Biotech Virus Transport and Preservation Medium Product
Table 200. Darui Biotech Recent Developments/Updates
Table 201. Hangzhou LifeReal Biotechnology Company Information
Table 202. Hangzhou LifeReal Biotechnology Description and Business Overview
Table 203. Hangzhou LifeReal Biotechnology Virus Transport and Preservation Medium Sales (M Units), Revenue (US$ Million), Price (US$/Unit), and Gross Margin (2021–2026)
Table 204. Hangzhou LifeReal Biotechnology Virus Transport and Preservation Medium Product
Table 205. Hangzhou LifeReal Biotechnology Recent Developments/Updates
Table 206. Haimen Shengbang Laboratory Equipment Company Information
Table 207. Haimen Shengbang Laboratory Equipment Description and Business Overview
Table 208. Haimen Shengbang Laboratory Equipment Virus Transport and Preservation Medium Sales (M Units), Revenue (US$ Million), Price (US$/Unit), and Gross Margin (2021–2026)
Table 209. Haimen Shengbang Laboratory Equipment Virus Transport and Preservation Medium Product
Table 210. Haimen Shengbang Laboratory Equipment Recent Developments/Updates
Table 211. Babio Biotechnology Company Information
Table 212. Babio Biotechnology Description and Business Overview
Table 213. Babio Biotechnology Virus Transport and Preservation Medium Sales (M Units), Revenue (US$ Million), Price (US$/Unit), and Gross Margin (2021–2026)
Table 214. Babio Biotechnology Virus Transport and Preservation Medium Product
Table 215. Babio Biotechnology Recent Developments/Updates
Table 216. Puritan Medical Products Company Information
Table 217. Puritan Medical Products Description and Business Overview
Table 218. Puritan Medical Products Virus Transport and Preservation Medium Sales (M Units), Revenue (US$ Million), Price (US$/Unit), and Gross Margin (2021–2026)
Table 219. Puritan Medical Products Virus Transport and Preservation Medium Product
Table 220. Puritan Medical Products Recent Developments/Updates
Table 221. Cardinal Health Company Information
Table 222. Cardinal Health Description and Business Overview
Table 223. Cardinal Health Virus Transport and Preservation Medium Sales (M Units), Revenue (US$ Million), Price (US$/Unit), and Gross Margin (2021–2026)
Table 224. Cardinal Health Virus Transport and Preservation Medium Product
Table 225. Cardinal Health Recent Developments/Updates
Table 226. Key Raw Materials Lists
Table 227. Raw Materials Key Suppliers Lists
Table 228. Virus Transport and Preservation Medium Distributors List
Table 229. Virus Transport and Preservation Medium Customers List
Table 230. Virus Transport and Preservation Medium Market Trends
Table 231. Virus Transport and Preservation Medium Market Drivers
Table 232. Virus Transport and Preservation Medium Market Challenges
Table 233. Virus Transport and Preservation Medium Market Restraints
Table 234. Research Programs/Design for This Report
Table 235. Key Data Information from Secondary Sources
Table 236. Key Data Information from Primary Sources
Table 237. Authors List of This Report
List of Figures
Figure 1. Product Picture of Virus Transport and Preservation Medium
Figure 2. Global Virus Transport and Preservation Medium Market Value by Type (US$ Million), 2021–2032
Figure 3. Global Virus Transport and Preservation Medium Market Share by Type: 2025 & 2032
Figure 4. Inactivated Product Picture
Figure 5. Non-inactivated Product Picture
Figure 6. Global Virus Transport and Preservation Medium Market Value by Preservation Temperature Requirement (US$ Million), 2021–2032
Figure 7. Global Virus Transport and Preservation Medium Market Share by Preservation Temperature Requirement: 2025 vs 2032
Figure 8. Ambient Temperature Product Picture
Figure 9. Low-Temperature Product Picture
Figure 10. Ultra-Low Temperature Product Picture
Figure 11. Global Virus Transport and Preservation Medium Market Value by Application (US$ Million), 2021–2032
Figure 12. Global Virus Transport and Preservation Medium Market Share by Application: 2025 & 2032
Figure 13. Medical Institutions
Figure 14. Centers for Disease Control and Prevention
Figure 15. Entry-Exit Quarantine and Port Inspection Agencies
Figure 16. Third-Party Medical Testing Institutions
Figure 17. Others
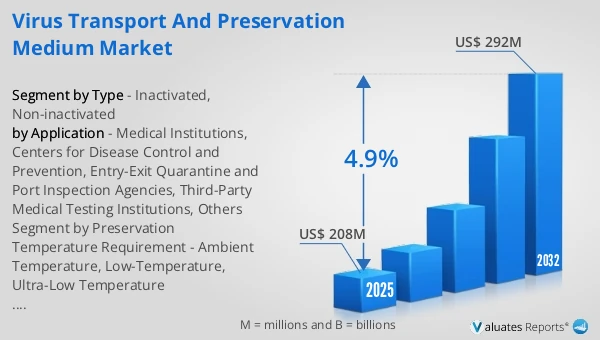
Figure 18. Global Virus Transport and Preservation Medium Revenue, (US$ Million), 2021 vs 2025 vs 2032
Figure 19. Global Virus Transport and Preservation Medium Market Size (US$ Million), 2021–2032
Figure 20. Global Virus Transport and Preservation Medium Sales (M Units), 2021–2032
Figure 21. Global Virus Transport and Preservation Medium Average Price (US$/Unit), 2021–2032
Figure 22. Virus Transport and Preservation Medium Report Years Considered
Figure 23. Virus Transport and Preservation Medium Sales Share by Manufacturers in 2025
Figure 24. Global Virus Transport and Preservation Medium Revenue Share by Manufacturers in 2025
Figure 25. Top 5 and Top 10 Global Virus Transport and Preservation Medium Players: Market Share by Revenue in Virus Transport and Preservation Medium in 2025
Figure 26. Virus Transport and Preservation Medium Market Share by Company Type (Tier 1, Tier 2, and Tier 3): 2021 vs 2025
Figure 27. Global Virus Transport and Preservation Medium Market Size by Region (US$ Million): 2021 vs 2025 vs 2032
Figure 28. North America Virus Transport and Preservation Medium Sales Market Share by Country (2021–2032)
Figure 29. North America Virus Transport and Preservation Medium Revenue Market Share by Country (2021–2032)
Figure 30. United States Virus Transport and Preservation Medium Revenue Growth Rate (US$ Million), 2021–2032
Figure 31. Canada Virus Transport and Preservation Medium Revenue Growth Rate (US$ Million), 2021–2032
Figure 32. Europe Virus Transport and Preservation Medium Sales Market Share by Country (2021–2032)
Figure 33. Europe Virus Transport and Preservation Medium Revenue Market Share by Country (2021–2032)
Figure 34. Germany Virus Transport and Preservation Medium Revenue Growth Rate (US$ Million), 2021–2032
Figure 35. France Virus Transport and Preservation Medium Revenue Growth Rate (US$ Million), 2021–2032
Figure 36. U.K. Virus Transport and Preservation Medium Revenue Growth Rate (US$ Million), 2021–2032
Figure 37. Italy Virus Transport and Preservation Medium Revenue Growth Rate (US$ Million), 2021–2032
Figure 38. Russia Virus Transport and Preservation Medium Revenue Growth Rate (US$ Million), 2021–2032
Figure 39. Asia Pacific Virus Transport and Preservation Medium Sales Market Share by Region (2021–2032)
Figure 40. Asia Pacific Virus Transport and Preservation Medium Revenue Market Share by Region (2021–2032)
Figure 41. China Virus Transport and Preservation Medium Revenue Growth Rate (US$ Million), 2021–2032
Figure 42. Japan Virus Transport and Preservation Medium Revenue Growth Rate (US$ Million), 2021–2032
Figure 43. South Korea Virus Transport and Preservation Medium Revenue Growth Rate (US$ Million), 2021–2032
Figure 44. India Virus Transport and Preservation Medium Revenue Growth Rate (US$ Million), 2021–2032
Figure 45. Australia Virus Transport and Preservation Medium Revenue Growth Rate (US$ Million), 2021–2032
Figure 46. China Taiwan Virus Transport and Preservation Medium Revenue Growth Rate (US$ Million), 2021–2032
Figure 47. Southeast Asia Virus Transport and Preservation Medium Revenue Growth Rate (US$ Million), 2021–2032
Figure 48. Latin America Virus Transport and Preservation Medium Sales Market Share by Country (2021–2032)
Figure 49. Latin America Virus Transport and Preservation Medium Revenue Market Share by Country (2021–2032)
Figure 50. Mexico Virus Transport and Preservation Medium Revenue Growth Rate (US$ Million), 2021–2032
Figure 51. Brazil Virus Transport and Preservation Medium Revenue Growth Rate (US$ Million), 2021–2032
Figure 52. Argentina Virus Transport and Preservation Medium Revenue Growth Rate (US$ Million), 2021–2032
Figure 53. Colombia Virus Transport and Preservation Medium Revenue Growth Rate (US$ Million), 2021–2032
Figure 54. Middle East and Africa Virus Transport and Preservation Medium Sales Market Share by Country (2021–2032)
Figure 55. Middle East and Africa Virus Transport and Preservation Medium Revenue Market Share by Country (2021–2032)
Figure 56. Turkey Virus Transport and Preservation Medium Revenue Growth Rate (US$ Million), 2021–2032
Figure 57. Saudi Arabia Virus Transport and Preservation Medium Revenue Growth Rate (US$ Million), 2021–2032
Figure 58. UAE Virus Transport and Preservation Medium Revenue Growth Rate (US$ Million), 2021–2032
Figure 59. Global Sales Market Share of Virus Transport and Preservation Medium by Type (2021–2032)
Figure 60. Global Revenue Market Share of Virus Transport and Preservation Medium by Type (2021–2032)
Figure 61. Global Virus Transport and Preservation Medium Price (US$/Unit) by Type (2021–2032)
Figure 62. Global Sales Market Share of Virus Transport and Preservation Medium by Application (2021–2032)
Figure 63. Global Revenue Market Share of Virus Transport and Preservation Medium by Application (2021–2032)
Figure 64. Global Virus Transport and Preservation Medium Price (US$/Unit) by Application (2021–2032)
Figure 65. Virus Transport and Preservation Medium Value Chain
Figure 66. Channels of Distribution (Direct Vs Distribution)
Figure 67. Bottom-up and Top-down Approaches for This Report
Figure 68. Data Triangulation
Figure 69. Key Executives Interviewed