List of Tables
Table 1. Global House Wraps Sales (US$ Million) Growth Rate by Type (2020 & 2024 & 2031)
Table 2. Global House Wraps Sales (US$ Million) Comparison by Application (2020 & 2024 & 2031)
Table 3. Global Market House Wraps Market Size (US$ Million) by Region:2020 VS 2024 VS 2031
Table 4. Global House Wraps Sales (M Sqm) by Region (2020-2025)
Table 5. Global House Wraps Sales Market Share by Region (2020-2025)
Table 6. Global House Wraps Revenue (US$ Million) Market Share by Region (2020-2025)
Table 7. Global House Wraps Revenue Share by Region (2020-2025)
Table 8. Global House Wraps Sales (M Sqm) Forecast by Region (2026-2031)
Table 9. Global House Wraps Sales Market Share Forecast by Region (2026-2031)
Table 10. Global House Wraps Revenue (US$ Million) Forecast by Region (2026-2031)
Table 11. Global House Wraps Revenue Share Forecast by Region (2026-2031)
Table 12. Global House Wraps Sales by Type (M Sqm) & (2020-2025)
Table 13. Global House Wraps Sales Share by Type (2020-2025)
Table 14. Global House Wraps Revenue by Type (US$ Million) & (2020-2025)
Table 15. Global House Wraps Price by Type (US$/Sqm) & (2020-2025)
Table 16. Global House Wraps Sales by Type (M Sqm) & (2026-2031)
Table 17. Global House Wraps Revenue by Type (US$ Million) & (2026-2031)
Table 18. Global House Wraps Price by Type (US$/Sqm) & (2026-2031)
Table 19. Representative Players of Each Type
Table 20. Global House Wraps Sales by Application (M Sqm) & (2020-2025)
Table 21. Global House Wraps Sales Share by Application (2020-2025)
Table 22. Global House Wraps Revenue by Application (US$ Million) & (2020-2025)
Table 23. Global House Wraps Price by Application (US$/Sqm) & (2020-2025)
Table 24. Global House Wraps Sales by Application (M Sqm) & (2026-2031)
Table 25. Global House Wraps Revenue Market Share by Application (US$ Million) & (2026-2031)
Table 26. Global House Wraps Price by Application (US$/Sqm) & (2026-2031)
Table 27. New Sources of Growth in House Wraps Application
Table 28. Global House Wraps Sales by Company (M Sqm) & (2020-2025)
Table 29. Global House Wraps Sales Share by Company (2020-2025)
Table 30. Global House Wraps Revenue by Company (US$ Million) & (2020-2025)
Table 31. Global House Wraps Revenue Share by Company (2020-2025)
Table 32. Global House Wraps by Company Type (Tier 1, Tier 2, and Tier 3) & (based on the Revenue in House Wraps as of 2024)
Table 33. Global Market House Wraps Average Price by Company (US$/Sqm) & (2020-2025)
Table 34. Global Key Manufacturers of House Wraps, Manufacturing Sites & Headquarters
Table 35. Global Key Manufacturers of House Wraps, Product Type & Application
Table 36. Global Key Manufacturers of House Wraps, Date of Enter into This Industry
Table 37. Manufacturers Mergers & Acquisitions, Expansion Plans
Table 38. North America House Wraps Sales by Company (2020-2025) & (M Sqm)
Table 39. North America House Wraps Sales Market Share by Company (2020-2025)
Table 40. North America House Wraps Revenue by Company (2020-2025) & (US$ Million)
Table 41. North America House Wraps Revenue Market Share by Company (2020-2025)
Table 42. North America House Wraps Sales by Type (2020-2025) & (M Sqm)
Table 43. North America House Wraps Sales Market Share by Type (2020-2025)
Table 44. North America House Wraps Sales by Application (2020-2025) & (M Sqm)
Table 45. North America House Wraps Sales Market Share by Application (2020-2025)
Table 46. Europe House Wraps Sales by Company (2020-2025) & (M Sqm)
Table 47. Europe House Wraps Sales Market Share by Company (2020-2025)
Table 48. Europe House Wraps Revenue by Company (2020-2025) & (US$ Million)
Table 49. Europe House Wraps Revenue Market Share by Company (2020-2025)
Table 50. Europe House Wraps Sales by Type (2020-2025) & (M Sqm)
Table 51. Europe House Wraps Sales Market Share by Type (2020-2025)
Table 52. Europe House Wraps Sales by Application (2020-2025) & (M Sqm)
Table 53. Europe House Wraps Sales Market Share by Application (2020-2025)
Table 54. China House Wraps Sales by Company (2020-2025) & (M Sqm)
Table 55. China House Wraps Sales Market Share by Company (2020-2025)
Table 56. China House Wraps Revenue by Company (2020-2025) & (US$ Million)
Table 57. China House Wraps Revenue Market Share by Company (2020-2025)
Table 58. China House Wraps Sales by Type (2020-2025) & (M Sqm)
Table 59. China House Wraps Sales Market Share by Type (2020-2025)
Table 60. China House Wraps Sales by Application (2020-2025) & (M Sqm)
Table 61. China House Wraps Sales Market Share by Application (2020-2025)
Table 62. India House Wraps Sales by Company (2020-2025) & (M Sqm)
Table 63. India House Wraps Sales Market Share by Company (2020-2025)
Table 64. India House Wraps Revenue by Company (2020-2025) & (US$ Million)
Table 65. India House Wraps Revenue Market Share by Company (2020-2025)
Table 66. India House Wraps Sales by Type (2020-2025) & (M Sqm)
Table 67. India House Wraps Sales Market Share by Type (2020-2025)
Table 68. India House Wraps Sales by Application (2020-2025) & (M Sqm)
Table 69. India House Wraps Sales Market Share by Application (2020-2025)
Table 70. DuPont Company Information
Table 71. DuPont Description and Business Overview
Table 72. DuPont House Wraps Sales (M Sqm), Revenue (US$ Million), Price (US$/Sqm) and Gross Margin (2020-2025)
Table 73. DuPont House Wraps Product
Table 74. DuPont Recent Development
Table 75. Berry Global, Inc. Company Information
Table 76. Berry Global, Inc. Description and Business Overview
Table 77. Berry Global, Inc. House Wraps Sales (M Sqm), Revenue (US$ Million), Price (US$/Sqm) and Gross Margin (2020-2025)
Table 78. Berry Global, Inc. House Wraps Product
Table 79. Berry Global, Inc. Recent Development
Table 80. James Hardie Company Information
Table 81. James Hardie Description and Business Overview
Table 82. James Hardie House Wraps Sales (M Sqm), Revenue (US$ Million), Price (US$/Sqm) and Gross Margin (2020-2025)
Table 83. James Hardie House Wraps Product
Table 84. James Hardie Recent Development
Table 85. Kingspan Group Company Information
Table 86. Kingspan Group Description and Business Overview
Table 87. Kingspan Group House Wraps Sales (M Sqm), Revenue (US$ Million), Price (US$/Sqm) and Gross Margin (2020-2025)
Table 88. Kingspan Group House Wraps Product
Table 89. Kingspan Group Recent Development
Table 90. Benjamin Obdyke Company Information
Table 91. Benjamin Obdyke Description and Business Overview
Table 92. Benjamin Obdyke House Wraps Sales (M Sqm), Revenue (US$ Million), Price (US$/Sqm) and Gross Margin (2020-2025)
Table 93. Benjamin Obdyke House Wraps Product
Table 94. Benjamin Obdyke Recent Development
Table 95. Owens Corning Company Information
Table 96. Owens Corning Description and Business Overview
Table 97. Owens Corning House Wraps Sales (M Sqm), Revenue (US$ Million), Price (US$/Sqm) and Gross Margin (2020-2025)
Table 98. Owens Corning House Wraps Product
Table 99. Owens Corning Recent Development
Table 100. Henry Company Company Information
Table 101. Henry Company Description and Business Overview
Table 102. Henry Company House Wraps Sales (M Sqm), Revenue (US$ Million), Price (US$/Sqm) and Gross Margin (2020-2025)
Table 103. Henry Company House Wraps Product
Table 104. Henry Company Recent Development
Table 105. GCP Applied Technologies Company Information
Table 106. GCP Applied Technologies Description and Business Overview
Table 107. GCP Applied Technologies House Wraps Sales (M Sqm), Revenue (US$ Million), Price (US$/Sqm) and Gross Margin (2020-2025)
Table 108. GCP Applied Technologies House Wraps Product
Table 109. GCP Applied Technologies Recent Development
Table 110. Polyguard Company Information
Table 111. Polyguard Description and Business Overview
Table 112. Polyguard House Wraps Sales (M Sqm), Revenue (US$ Million), Price (US$/Sqm) and Gross Margin (2020-2025)
Table 113. Polyguard House Wraps Product
Table 114. Polyguard Recent Development
Table 115. Kimberly-Clark Professional Company Information
Table 116. Kimberly-Clark Professional Description and Business Overview
Table 117. Kimberly-Clark Professional House Wraps Sales (M Sqm), Revenue (US$ Million), Price (US$/Sqm) and Gross Margin (2020-2025)
Table 118. Kimberly-Clark Professional House Wraps Product
Table 119. Kimberly-Clark Professional Recent Development
Table 120. CertainTeed Corporation Company Information
Table 121. CertainTeed Corporation Description and Business Overview
Table 122. CertainTeed Corporation House Wraps Sales (M Sqm), Revenue (US$ Million), Price (US$/Sqm) and Gross Margin (2020-2025)
Table 123. CertainTeed Corporation House Wraps Product
Table 124. CertainTeed Corporation Recent Development
Table 125. INDEVCO North America Company Information
Table 126. INDEVCO North America Description and Business Overview
Table 127. INDEVCO North America House Wraps Sales (M Sqm), Revenue (US$ Million), Price (US$/Sqm) and Gross Margin (2020-2025)
Table 128. INDEVCO North America House Wraps Product
Table 129. INDEVCO North America Recent Development
Table 130. Alpha Pro Tech Company Information
Table 131. Alpha Pro Tech Description and Business Overview
Table 132. Alpha Pro Tech House Wraps Sales (M Sqm), Revenue (US$ Million), Price (US$/Sqm) and Gross Margin (2020-2025)
Table 133. Alpha Pro Tech House Wraps Product
Table 134. Alpha Pro Tech Recent Development
Table 135. Protecto Wrap Company Company Information
Table 136. Protecto Wrap Company Description and Business Overview
Table 137. Protecto Wrap Company House Wraps Sales (M Sqm), Revenue (US$ Million), Price (US$/Sqm) and Gross Margin (2020-2025)
Table 138. Protecto Wrap Company House Wraps Product
Table 139. Protecto Wrap Company Recent Development
Table 140. Shandong Zhengbang Plastic Products Co., Ltd Company Information
Table 141. Shandong Zhengbang Plastic Products Co., Ltd Description and Business Overview
Table 142. Shandong Zhengbang Plastic Products Co., Ltd House Wraps Sales (M Sqm), Revenue (US$ Million), Price (US$/Sqm) and Gross Margin (2020-2025)
Table 143. Shandong Zhengbang Plastic Products Co., Ltd House Wraps Product
Table 144. Shandong Zhengbang Plastic Products Co., Ltd Recent Development
Table 145. Xiong County Xiashi Packing Co., Ltd. Company Information
Table 146. Xiong County Xiashi Packing Co., Ltd. Description and Business Overview
Table 147. Xiong County Xiashi Packing Co., Ltd. House Wraps Sales (M Sqm), Revenue (US$ Million), Price (US$/Sqm) and Gross Margin (2020-2025)
Table 148. Xiong County Xiashi Packing Co., Ltd. House Wraps Product
Table 149. Xiong County Xiashi Packing Co., Ltd. Recent Development
Table 150. Intertape Polymer Group Company Information
Table 151. Intertape Polymer Group Description and Business Overview
Table 152. Intertape Polymer Group House Wraps Sales (M Sqm), Revenue (US$ Million), Price (US$/Sqm) and Gross Margin (2020-2025)
Table 153. Intertape Polymer Group House Wraps Product
Table 154. Intertape Polymer Group Recent Development
Table 155. ORIENTAL YUHONG WATERPROOF TECHNOLOGY Company Information
Table 156. ORIENTAL YUHONG WATERPROOF TECHNOLOGY Description and Business Overview
Table 157. ORIENTAL YUHONG WATERPROOF TECHNOLOGY House Wraps Sales (M Sqm), Revenue (US$ Million), Price (US$/Sqm) and Gross Margin (2020-2025)
Table 158. ORIENTAL YUHONG WATERPROOF TECHNOLOGY House Wraps Product
Table 159. ORIENTAL YUHONG WATERPROOF TECHNOLOGY Recent Development
Table 160. Beijing New Building Materials Public Company Information
Table 161. Beijing New Building Materials Public Description and Business Overview
Table 162. Beijing New Building Materials Public House Wraps Sales (M Sqm), Revenue (US$ Million), Price (US$/Sqm) and Gross Margin (2020-2025)
Table 163. Beijing New Building Materials Public House Wraps Product
Table 164. Beijing New Building Materials Public Recent Development
Table 165. SKSHU Paint Company Information
Table 166. SKSHU Paint Description and Business Overview
Table 167. SKSHU Paint House Wraps Sales (M Sqm), Revenue (US$ Million), Price (US$/Sqm) and Gross Margin (2020-2025)
Table 168. SKSHU Paint House Wraps Product
Table 169. SKSHU Paint Recent Development
Table 170. Production Base and Market Concentration Rate of Raw Material
Table 171. Key Suppliers of Raw Materials
Table 172. House Wraps Distributors List
Table 173. House Wraps Customers List
Table 174. House Wraps Market Trends
Table 175. House Wraps Market Drivers
Table 176. House Wraps Market Challenges
Table 177. House Wraps Market Restraints
Table 178. Research Programs/Design for This Report
Table 179. Key Data Information from Secondary Sources
Table 180. Key Data Information from Primary Sources
List of Figures
Figure 1. House Wraps Product Picture
Figure 2. Global House Wraps Sales (US$ Million) by Type (2020 & 2024 & 2031)
Figure 3. Global House Wraps Sales Market Share by Type in 2024 & 2031
Figure 4. Asphalt-Impregnated Paper or Fiberglass Product Picture
Figure 5. Micro-Perforated Product Picture
Figure 6. Polyolefin Fabric Product Picture
Figure 7. Others Product Picture
Figure 8. Global House Wraps Sales (US$ Million) by Application (2020 & 2024 & 2031)
Figure 9. Global House Wraps Sales Market Share by Application in 2024 & 2031
Figure 10. Residential Examples
Figure 11. Commercial and Public Buildings Examples
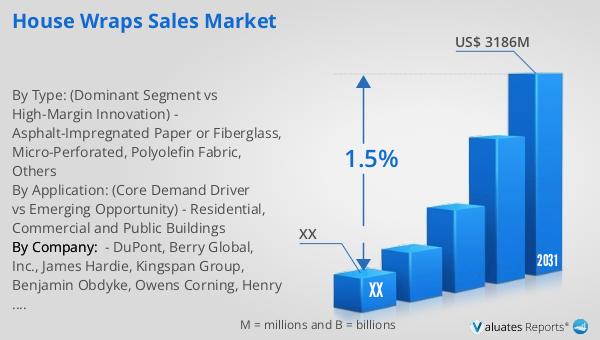
Figure 12. Global House Wraps Sales, (US$ Million), 2020 VS 2024 VS 2031
Figure 13. Global House Wraps Sales Growth Rate (2020-2031) & (US$ Million)
Figure 14. Global House Wraps Sales (M Sqm) Growth Rate (2020-2031)
Figure 15. Global House Wraps Price Trends Growth Rate (2020-2031) & (US$/Sqm)
Figure 16. House Wraps Report Years Considered
Figure 17. Global Market House Wraps Market Size (US$ Million) by Region:2020 VS 2024 VS 2031
Figure 18. Global House Wraps Revenue Market Share by Region: 2020 VS 2024
Figure 19. North America House Wraps Revenue (US$ Million) Growth Rate (2020-2031)
Figure 20. North America House Wraps Sales (M Sqm) Growth Rate (2020-2031)
Figure 21. Europe House Wraps Revenue (US$ Million) Growth Rate (2020-2031)
Figure 22. Europe House Wraps Sales (M Sqm) Growth Rate (2020-2031)
Figure 23. China House Wraps Revenue (US$ Million) Growth Rate (2020-2031)
Figure 24. China House Wraps Sales (M Sqm) Growth Rate (2020-2031)
Figure 25. India House Wraps Revenue (US$ Million) Growth Rate (2020-2031)
Figure 26. India House Wraps Sales (M Sqm) Growth Rate (2020-2031)
Figure 27. Global House Wraps Revenue Share by Type (2020-2025)
Figure 28. Global House Wraps Sales Share by Type (2026-2031)
Figure 29. Global House Wraps Revenue Share by Type (2026-2031)
Figure 30. Global House Wraps Revenue Share by Application (2020-2025)
Figure 31. Global House Wraps Revenue Growth Rate by Application in 2020 & 2024
Figure 32. Global House Wraps Sales Share by Application (2026-2031)
Figure 33. Global House Wraps Revenue Share by Application (2026-2031)
Figure 34. Global House Wraps Sales Share by Company (2024)
Figure 35. Global House Wraps Revenue Share by Company (2024)
Figure 36. Global 5 Largest House Wraps Players Market Share by Revenue in House Wraps: 2020 & 2024
Figure 37. House Wraps Market Share by Company Type (Tier 1, Tier 2, and Tier 3): 2020 VS 2024
Figure 38. Manufacturing Cost Structure of House Wraps
Figure 39. Manufacturing Process Analysis of House Wraps
Figure 40. House Wraps Industrial Chain
Figure 41. Channels of Distribution (Direct Vs Distribution)
Figure 42. Distributors Profiles
Figure 43. Bottom-up and Top-down Approaches for This Report
Figure 44. Data Triangulation
Figure 45. Key Executives Interviewed