List of Tables
Table 1. Major Company of Polyurethane
Table 2. Major Company of Poly Tetra Fluoro Ethylene (PTFE)
Table 3. Major Company of Polyvinylidene Fluoride (PVDF)
Table 4. Major Company of Polyester Microfilament Yarns
Table 5. Major Company of Fluoropolymers
Table 6. Major Company of Others
Table 7. Global Waterproof Breathable Textile Sales by Material 2018 VS 2022 VS 2029 (US$ Million)
Table 8. Global Waterproof Breathable Textile Sales by Material (2018-2023) & (K MT)
Table 9. Global Waterproof Breathable Textile Sales Market Share in Volume by Material (2018-2023)
Table 10. Global Waterproof Breathable Textile Sales by Material (2018-2023) & (US& Million)
Table 11. Global Waterproof Breathable Textile Market Share in Value by Material (2018-2023)
Table 12. Global Waterproof Breathable Textile Price by Material (2018-2023) & (USD/MT)
Table 13. Global Waterproof Breathable Textile Sales by Material (2024-2029) & (K MT)
Table 14. Global Waterproof Breathable Textile Sales Market Share in Volume by Material (2024-2029)
Table 15. Global Waterproof Breathable Textile Sales by Material (2024-2029) & (US$ Million)
Table 16. Global Waterproof Breathable Textile Sales Market Share in Value by Material (2024-2029)
Table 17. Global Waterproof Breathable Textile Price by Material (2024-2029) & (USD/MT)
Table 18. North America Waterproof Breathable Textile Sales by Material (2018-2023) & (K MT)
Table 19. North America Waterproof Breathable Textile Sales by Material (2018-2023) & (US$ Million)
Table 20. Europe Waterproof Breathable Textile Sales (K MT) by Material (2018-2023)
Table 21. Europe Waterproof Breathable Textile Sales by Material (2018-2023) & (US$ Million)
Table 22. Asia-Pacific Waterproof Breathable Textile Sales (K MT) by Material (2018-2023)
Table 23. Asia-Pacific Waterproof Breathable Textile Sales by Material (2018-2023) & (US$ Million)
Table 24. Latin America Waterproof Breathable Textile Sales (K MT) by Material (2018-2023)
Table 25. Latin America Waterproof Breathable Textile Sales by Material (2018-2023) & (US$ Million)
Table 26. Middle East and Africa Waterproof Breathable Textile Sales (K MT) by Material (2018-2023)
Table 27. Middle East and Africa Waterproof Breathable Textile Sales by Material (2018-2023) & (US$ Million)
Table 28. Global Waterproof Breathable Textile Sales by Company (2018-2023) & (K MT)
Table 29. Global Waterproof Breathable Textile Sales Share by Company (2018-2023)
Table 30. Global Waterproof Breathable Textile Revenue by Company (2018-2023) & (US$ Million)
Table 31. Global Waterproof Breathable Textile Revenue Share by Company (2018-2023)
Table 32. Global Market Waterproof Breathable Textile Price by Company (2018-2023) & (USD/MT)
Table 33. Global Waterproof Breathable Textile Top Manufacturers Manufacturing Base Distribution and Sales Area
Table 34. Global Waterproof Breathable Textile Manufacturers Market Concentration Ratio (CR5 and HHI)
Table 35. Global Top Manufacturers Market Share by Company Type (Tier 1, Tier 2 and Tier 3) & (based on the Revenue in Waterproof Breathable Textile as of 2022)
Table 36. Date of Key Manufacturers Enter into Waterproof Breathable Textile Market
Table 37. Key Manufacturers Waterproof Breathable Textile Product Type
Table 38. Mergers & Acquisitions, Expansion Plans
Table 39. Global Waterproof Breathable Textile Market Size Comparison by Region (US$ Million): 2018 VS 2022 VS 2029
Table 40. Global Waterproof Breathable Textile Sales by Region (2018-2023) & (K MT)
Table 41. Global Waterproof Breathable Textile Sales Market Share in Volume by Region (2018-2023)
Table 42. Global Waterproof Breathable Textile Sales by Region (2018-2023) & (US$ Million)
Table 43. Global Waterproof Breathable Textile Sales Market Share in Value by Region (2018-2023)
Table 44. Global Waterproof Breathable Textile Sales (K MT), Revenue (US$ Million), Price (USD/MT) and Gross Margin (2018-2023)
Table 45. Global Waterproof Breathable Textile Sales by Region (2024-2029) & (K MT)
Table 46. Global Waterproof Breathable Textile Sales Market Share in Volume by Region (2024-2029)
Table 47. Global Waterproof Breathable Textile Sales by Region (2024-2029) & (US$ Million)
Table 48. Global Waterproof Breathable Textile Sales Market Share in Value by Region (2024-2029)
Table 49. Global Waterproof Breathable Textile Sales (K MT), Revenue (US$ Million), Price (USD/MT) and Gross Margin (2024-2029)
Table 50. Global Waterproof Breathable Textile Sales by Application: 2018 VS 2022 VS 2029 (US$ Million)
Table 51. Global Waterproof Breathable Textile Sales by Application (2018-2023) & (K MT)
Table 52. Global Waterproof Breathable Textile Sales Market Share in Volume by Application (2018-2023)
Table 53. Global Waterproof Breathable Textile Sales by Application (2018-2023) & (US$ Million)
Table 54. Global Waterproof Breathable Textile Sales Market Share in Value by Application (2018-2023)
Table 55. Global Waterproof Breathable Textile Price by Application (2018-2023) & (USD/MT)
Table 56. Global Waterproof Breathable Textile Sales by Application (2024-2029) & (K MT)
Table 57. Global Waterproof Breathable Textile Sales Market Share in Volume by Application (2024-2029)
Table 58. Global Waterproof Breathable Textile Sales by Application (2024-2029) & (US$ Million)
Table 59. Global Waterproof Breathable Textile Sales Market Share in Value by Application (2024-2029)
Table 60. Global Waterproof Breathable Textile Price by Application (2024-2029) & (USD/MT)
Table 61. North America Waterproof Breathable Textile Sales by Application (2018-2023) (K MT)
Table 62. North America Waterproof Breathable Textile Sales by Application (2018-2023) & (US$ Million)
Table 63. Europe Waterproof Breathable Textile Sales by Application (2018-2023) (K MT)
Table 64. Europe Waterproof Breathable Textile Sales by Application (2018-2023) & (US$ Million)
Table 65. Asia-Pacific Waterproof Breathable Textile Sales by Application (2018-2023) (K MT)
Table 66. Asia-Pacific Waterproof Breathable Textile Sales by Application (2018-2023) & (US$ Million)
Table 67. Latin America Waterproof Breathable Textile Sales by Application (2018-2023) (K MT)
Table 68. Latin America Waterproof Breathable Textile Sales by Application (2018-2023) & (US$ Million)
Table 69. Middle East and Africa Waterproof Breathable Textile Sales by Application (2018-2023) (K MT)
Table 70. Middle East and Africa Waterproof Breathable Textile Sales by Application (2018-2023) & (US$ Million)
Table 71. North America Waterproof Breathable Textile Sales by Country (2018-2023) & (K MT)
Table 72. North America Waterproof Breathable Textile Sales Market Share in Volume by Country (2018-2023)
Table 73. North America Waterproof Breathable Textile Sales by Country (2018-2023) & (US$ Million)
Table 74. North America Waterproof Breathable Textile Sales Market Share in Value by Country (2018-2023)
Table 75. North America Waterproof Breathable Textile Sales by Country (2024-2029) & (K MT)
Table 76. North America Waterproof Breathable Textile Sales Market Share in Volume by Country (2024-2029)
Table 77. North America Waterproof Breathable Textile Sales by Country (2024-2029) & (US$ Million)
Table 78. North America Waterproof Breathable Textile Sales Market Share in Value by Country (2024-2029)
Table 79. Europe Waterproof Breathable Textile Sales by Country (2018-2023) & (K MT)
Table 80. Europe Waterproof Breathable Textile Sales Market Share in Volume by Country (2018-2023)
Table 81. Europe Waterproof Breathable Textile Sales by Country (2018-2023) & (US$ Million)
Table 82. Europe Waterproof Breathable Textile Sales Market Share in Value by Country (2018-2023)
Table 83. Europe Waterproof Breathable Textile Sales by Country (2024-2029) & (K MT)
Table 84. Europe Waterproof Breathable Textile Sales Market Share in Volume by Country (2024-2029)
Table 85. Europe Waterproof Breathable Textile Sales by Country (2024-2029) & (US$ Million)
Table 86. Europe Waterproof Breathable Textile Sales Market Share in Value by Country (2024-2029)
Table 87. Asia-Pacific Waterproof Breathable Textile Sales by Region (2018-2023) & (K MT)
Table 88. Asia-Pacific Waterproof Breathable Textile Sales Market Share in Volume by Region (2018-2023)
Table 89. Asia-Pacific Waterproof Breathable Textile Sales by Region (2018-2023) & (US$ Million)
Table 90. Asia-Pacific Waterproof Breathable Textile Sales Market Share in Value by Region (2018-2023)
Table 91. Asia-Pacific Waterproof Breathable Textile Sales by Region (2024-2029) & (K MT)
Table 92. Asia-Pacific Waterproof Breathable Textile Sales Market Share in Volume by Region (2024-2029)
Table 93. Asia-Pacific Waterproof Breathable Textile Sales by Region (2024-2029) & (US$ Million)
Table 94. Asia-Pacific Waterproof Breathable Textile Sales Market Share in Value by Region (2024-2029)
Table 95. Latin America Waterproof Breathable Textile Sales by Country (2018-2023) & (K MT)
Table 96. Latin America Waterproof Breathable Textile Sales Market Share in Volume by Country (2018-2023)
Table 97. Latin America Waterproof Breathable Textile Sales by Country (2018-2023) & (US$ Million)
Table 98. Latin America Waterproof Breathable Textile Sales Market Share in Value by Country (2018-2023)
Table 99. Latin America Waterproof Breathable Textile Sales by Country (2024-2029) & (K MT)
Table 100. Latin America Waterproof Breathable Textile Sales Market Share in Volume by Country (2024-2029)
Table 101. Latin America Waterproof Breathable Textile Sales by Country (2024-2029) & (US$ Million)
Table 102. Latin America Waterproof Breathable Textile Sales Market Share in Value by Country (2024-2029)
Table 103. Middle East and Africa Waterproof Breathable Textile Sales by Country (2018-2023) & (K MT)
Table 104. Middle East and Africa Waterproof Breathable Textile Sales Market Share in Volume by Country (2018-2023)
Table 105. Middle East and Africa Waterproof Breathable Textile Sales by Country (2018-2023) & (US$ Million)
Table 106. Middle East and Africa Waterproof Breathable Textile Sales Market Share in Value by Country (2018-2023)
Table 107. Middle East and Africa Waterproof Breathable Textile Sales by Country (2024-2029) & (K MT)
Table 108. Middle East and Africa Waterproof Breathable Textile Sales Market Share in Volume by Country (2024-2029)
Table 109. Middle East and Africa Waterproof Breathable Textile Sales by Country (2024-2029) & (US$ Million)
Table 110. Middle East and Africa Waterproof Breathable Textile Sales Market Share in Value by Country (2024-2029)
Table 111. APT Fabrics Company Information
Table 112. APT Fabrics Introduction and Business Overview
Table 113. APT Fabrics Waterproof Breathable Textile Sales (K MT), Revenue (Million USD), Price (USD/MT) and Gross Margin (2018-2023)
Table 114. APT Fabrics Waterproof Breathable Textile Product
Table 115. APT Fabrics Recent Development
Table 116. Clariant Company Information
Table 117. Clariant Introduction and Business Overview
Table 118. Clariant Waterproof Breathable Textile Sales (K MT), Revenue (Million USD), Price (USD/MT) and Gross Margin (2018-2023)
Table 119. Clariant Waterproof Breathable Textile Product
Table 120. Clariant Recent Development
Table 121. Columbia Sportswear Company Information
Table 122. Columbia Sportswear Introduction and Business Overview
Table 123. Columbia Sportswear Waterproof Breathable Textile Sales (K MT), Revenue (Million USD), Price (USD/MT) and Gross Margin (2018-2023)
Table 124. Columbia Sportswear Waterproof Breathable Textile Product
Table 125. Columbia Sportswear Recent Development
Table 126. Dow Corning Company Information
Table 127. Dow Corning Introduction and Business Overview
Table 128. Dow Corning Waterproof Breathable Textile Sales (K MT), Revenue (Million USD), Price (USD/MT) and Gross Margin (2018-2023)
Table 129. Dow Corning Waterproof Breathable Textile Product
Table 130. Dow Corning Recent Development
Table 131. General Electric Company Information
Table 132. General Electric Introduction and Business Overview
Table 133. General Electric Waterproof Breathable Textile Sales (K MT), Revenue (Million USD), Price (USD/MT) and Gross Margin (2018-2023)
Table 134. General Electric Waterproof Breathable Textile Product
Table 135. General Electric Recent Development
Table 136. Heartland Textiles Company Information
Table 137. Heartland Textiles Introduction and Business Overview
Table 138. Heartland Textiles Waterproof Breathable Textile Sales (K MT), Revenue (Million USD), Price (USD/MT) and Gross Margin (2018-2023)
Table 139. Heartland Textiles Waterproof Breathable Textile Product
Table 140. Heartland Textiles Recent Development
Table 141. HeiQ Materials Company Information
Table 142. HeiQ Materials Introduction and Business Overview
Table 143. HeiQ Materials Waterproof Breathable Textile Sales (K MT), Revenue (Million USD), Price (USD/MT) and Gross Margin (2018-2023)
Table 144. HeiQ Materials Waterproof Breathable Textile Product
Table 145. HeiQ Materials Recent Development
Table 146. Helly Hansen Company Information
Table 147. Helly Hansen Introduction and Business Overview
Table 148. Helly Hansen Waterproof Breathable Textile Sales (K MT), Revenue (Million USD), Price (USD/MT) and Gross Margin (2018-2023)
Table 149. Helly Hansen Waterproof Breathable Textile Product
Table 150. Helly Hansen Recent Development
Table 151. Huntsman Textile Effects Company Information
Table 152. Huntsman Textile Effects Introduction and Business Overview
Table 153. Huntsman Textile Effects Waterproof Breathable Textile Sales (K MT), Revenue (Million USD), Price (USD/MT) and Gross Margin (2018-2023)
Table 154. Huntsman Textile Effects Waterproof Breathable Textile Product
Table 155. Huntsman Textile Effects Recent Development
Table 156. Jack Wolfskin Company Information
Table 157. Jack Wolfskin Introduction and Business Overview
Table 158. Jack Wolfskin Waterproof Breathable Textile Sales (K MT), Revenue (Million USD), Price (USD/MT) and Gross Margin (2018-2023)
Table 159. Jack Wolfskin Waterproof Breathable Textile Product
Table 160. Jack Wolfskin Recent Development
Table 161. Lowe Alpine International Company Information
Table 162. Lowe Alpine International Introduction and Business Overview
Table 163. Lowe Alpine International Waterproof Breathable Textile Sales (K MT), Revenue (Million USD), Price (USD/MT) and Gross Margin (2018-2023)
Table 164. Lowe Alpine International Waterproof Breathable Textile Product
Table 165. Lowe Alpine International Recent Development
Table 166. Marmot Mountain Company Information
Table 167. Marmot Mountain Introduction and Business Overview
Table 168. Marmot Mountain Waterproof Breathable Textile Sales (K MT), Revenue (Million USD), Price (USD/MT) and Gross Margin (2018-2023)
Table 169. Marmot Mountain Waterproof Breathable Textile Product
Table 170. Marmot Mountain Recent Development
Table 171. Mitsui Company Information
Table 172. Mitsui Introduction and Business Overview
Table 173. Mitsui Waterproof Breathable Textile Sales (K MT), Revenue (Million USD), Price (USD/MT) and Gross Margin (2018-2023)
Table 174. Mitsui Waterproof Breathable Textile Product
Table 175. Mitsui Recent Development
Table 176. Mountain Hardwear Company Information
Table 177. Mountain Hardwear Introduction and Business Overview
Table 178. Mountain Hardwear Waterproof Breathable Textile Sales (K MT), Revenue (Million USD), Price (USD/MT) and Gross Margin (2018-2023)
Table 179. Mountain Hardwear Waterproof Breathable Textile Product
Table 180. Mountain Hardwear Recent Development
Table 181. Nextec Applications Company Information
Table 182. Nextec Applications Introduction and Business Overview
Table 183. Nextec Applications Waterproof Breathable Textile Sales (K MT), Revenue (Million USD), Price (USD/MT) and Gross Margin (2018-2023)
Table 184. Nextec Applications Waterproof Breathable Textile Product
Table 185. Nextec Applications Recent Development
Table 186. Nike Company Information
Table 187. Nike Introduction and Business Overview
Table 188. Nike Waterproof Breathable Textile Sales (K MT), Revenue (Million USD), Price (USD/MT) and Gross Margin (2018-2023)
Table 189. Nike Waterproof Breathable Textile Product
Table 190. Nike Recent Development
Table 191. P2i Company Information
Table 192. P2i Introduction and Business Overview
Table 193. P2i Waterproof Breathable Textile Sales (K MT), Revenue (Million USD), Price (USD/MT) and Gross Margin (2018-2023)
Table 194. P2i Waterproof Breathable Textile Product
Table 195. P2i Recent Development
Table 196. Patagonia Company Information
Table 197. Patagonia Introduction and Business Overview
Table 198. Patagonia Waterproof Breathable Textile Sales (K MT), Revenue (Million USD), Price (USD/MT) and Gross Margin (2018-2023)
Table 199. Patagonia Waterproof Breathable Textile Product
Table 200. Patagonia Recent Development
Table 201. Polartec Company Information
Table 202. Polartec Introduction and Business Overview
Table 203. Polartec Waterproof Breathable Textile Sales (K MT), Revenue (Million USD), Price (USD/MT) and Gross Margin (2018-2023)
Table 204. Polartec Waterproof Breathable Textile Product
Table 205. Polartec Recent Development
Table 206. Rudolf Company Information
Table 207. Rudolf Introduction and Business Overview
Table 208. Rudolf Waterproof Breathable Textile Sales (K MT), Revenue (Million USD), Price (USD/MT) and Gross Margin (2018-2023)
Table 209. Rudolf Waterproof Breathable Textile Product
Table 210. Rudolf Recent Development
Table 211. Schoeller Technologies Company Information
Table 212. Schoeller Technologies Introduction and Business Overview
Table 213. Schoeller Technologies Waterproof Breathable Textile Sales (K MT), Revenue (Million USD), Price (USD/MT) and Gross Margin (2018-2023)
Table 214. Schoeller Technologies Waterproof Breathable Textile Product
Table 215. Schoeller Technologies Recent Development
Table 216. SympaTex Technologies Company Information
Table 217. SympaTex Technologies Introduction and Business Overview
Table 218. SympaTex Technologies Waterproof Breathable Textile Sales (K MT), Revenue (Million USD), Price (USD/MT) and Gross Margin (2018-2023)
Table 219. SympaTex Technologies Waterproof Breathable Textile Product
Table 220. SympaTex Technologies Recent Development
Table 221. Tanatex Chemicals Company Information
Table 222. Tanatex Chemicals Introduction and Business Overview
Table 223. Tanatex Chemicals Waterproof Breathable Textile Sales (K MT), Revenue (Million USD), Price (USD/MT) and Gross Margin (2018-2023)
Table 224. Tanatex Chemicals Waterproof Breathable Textile Product
Table 225. Tanatex Chemicals Recent Development
Table 226. The North Face Company Information
Table 227. The North Face Introduction and Business Overview
Table 228. The North Face Waterproof Breathable Textile Sales (K MT), Revenue (Million USD), Price (USD/MT) and Gross Margin (2018-2023)
Table 229. The North Face Waterproof Breathable Textile Product
Table 230. The North Face Recent Development
Table 231. TORAY INDUSTRIES Introduction and Business Overview
Table 232. TORAY INDUSTRIES Waterproof Breathable Textile Sales (K MT), Revenue (Million USD), Price (USD/MT) and Gross Margin (2018-2023)
Table 233. TORAY INDUSTRIES Waterproof Breathable Textile Product
Table 234. TORAY INDUSTRIES Recent Development
Table 235. TORAY INDUSTRIES Company Information
Table 236. W. L. Gore & Associates Company Information
Table 237. W. L. Gore & Associates Introduction and Business Overview
Table 238. W. L. Gore & Associates Waterproof Breathable Textile Sales (K MT), Revenue (Million USD), Price (USD/MT) and Gross Margin (2018-2023)
Table 239. W. L. Gore & Associates Waterproof Breathable Textile Product
Table 240. W. L. Gore & Associates Recent Development
Table 241. Key Raw Materials Lists
Table 242. Raw Materials Key Suppliers Lists
Table 243. Waterproof Breathable Textile Market Trends
Table 244. Waterproof Breathable Textile Market Drivers
Table 245. Waterproof Breathable Textile Market Challenges
Table 246. Waterproof Breathable Textile Market Restraints
Table 247. Waterproof Breathable Textile Distributors List
Table 248. Waterproof Breathable Textile Downstream Customers
Table 249. Research Programs/Design for This Report
Table 250. Key Data Information from Secondary Sources
Table 251. Key Data Information from Primary Sources
List of Figures
Figure 1. Waterproof Breathable Textile Product Picture
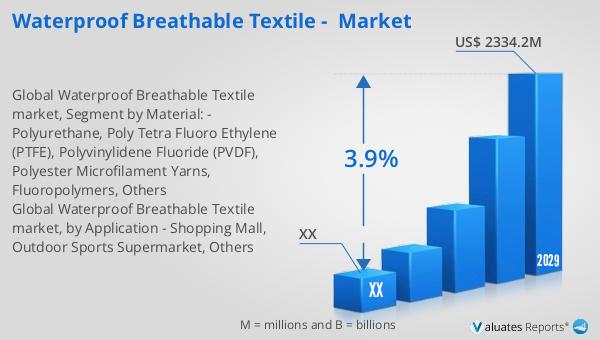
Figure 2. Global Waterproof Breathable Textile Market Size, 2018 VS 2022 VS 2029 (US$ Million)
Figure 3. Global Waterproof Breathable Textile Market Size Status and Outlook (2018-2029) & (US$ Million)
Figure 4. Global Waterproof Breathable Textile Sales Status and Outlook (2018-2029) & (K MT)
Figure 5. Product Picture of Polyurethane
Figure 6. Global Polyurethane Sales YoY Growth (2018-2029) & (K MT)
Figure 7. Product Picture of Poly Tetra Fluoro Ethylene (PTFE)
Figure 8. Global Poly Tetra Fluoro Ethylene (PTFE) Sales YoY Growth (2018-2029) & (K MT)
Figure 9. Product Picture of Polyvinylidene Fluoride (PVDF)
Figure 10. Global Polyvinylidene Fluoride (PVDF) Sales YoY Growth (2018-2029) & (K MT)
Figure 11. Product Picture of Polyester Microfilament Yarns
Figure 12. Global Polyester Microfilament Yarns Sales YoY Growth (2018-2029) & (K MT)
Figure 13. Product Picture of Fluoropolymers
Figure 14. Global Fluoropolymers Sales YoY Growth (2018-2029) & (K MT)
Figure 15. Product Picture of Others
Figure 16. Global Others Sales YoY Growth (2018-2029) & (K MT)
Figure 17. Global Waterproof Breathable Textile Sales by Material (2018-2029) & (US$ Million)
Figure 18. Global Waterproof Breathable Textile Sales Market Share by Material in 2022 & 2029
Figure 19. North America Waterproof Breathable Textile Sales Market Share in Volume by Material in 2022
Figure 20. North America Waterproof Breathable Textile Sales Market Share in Value by Material in 2022
Figure 21. Europe Waterproof Breathable Textile Sales Market Share in Volume by Material in 2022
Figure 22. Europe Waterproof Breathable Textile Sales Market Share in Value by Material in 2022
Figure 23. Asia-Pacific Waterproof Breathable Textile Sales Market Share in Volume by Material in 2022
Figure 24. Asia-Pacific Waterproof Breathable Textile Sales Market Share in Value by Material in 2022
Figure 25. Latin America Waterproof Breathable Textile Sales Market Share in Volume by Material in 2022
Figure 26. Latin America Waterproof Breathable Textile Sales Market Share in Value by Material in 2022
Figure 27. Middle East and Africa Waterproof Breathable Textile Sales Market Share in Volume by Material in 2022
Figure 28. Middle East and Africa Waterproof Breathable Textile Sales Market Share in Value by Material in 2022
Figure 29. The 5 and 10 Largest Manufacturers in the World: Market Share by Waterproof Breathable Textile Sales in 2022
Figure 30. The 5 and 10 Largest Manufacturers in the World: Market Share by Waterproof Breathable Textile Revenue in 2022
Figure 31. Waterproof Breathable Textile Market Share by Company Type (Tier 1, Tier 2, and Tier 3): 2018 VS 2022
Figure 32. Product Picture of Shopping Mall
Figure 33. Global Shopping Mall Sales YoY Growth (2018-2029) & (K MT)
Figure 34. Product Picture of Outdoor Sports Supermarket
Figure 35. Global Outdoor Sports Supermarket Sales YoY Growth (2018-2029) & (K MT)
Figure 36. Product Picture of Others
Figure 37. Global Others Sales YoY Growth (2018-2029) & (K MT)
Figure 38. Global Waterproof Breathable Textile Sales by Application (2018-2029) & (US$ Million)
Figure 39. Global Waterproof Breathable Textile Sales Market Share by Application in 2022 & 2029
Figure 40. North America Waterproof Breathable Textile Sales Market Share in Volume by Application in 2022
Figure 41. North America Waterproof Breathable Textile Sales Market Share in Value by Application in 2022
Figure 42. Europe Waterproof Breathable Textile Sales Market Share in Volume by Application in 2022
Figure 43. Europe Waterproof Breathable Textile Sales Market Share in Value by Application in 2022
Figure 44. Asia-Pacific Waterproof Breathable Textile Sales Market Share in Volume by Application in 2022
Figure 45. Asia-Pacific Waterproof Breathable Textile Sales Market Share in Value by Application in 2022
Figure 46. Latin America Waterproof Breathable Textile Sales Market Share in Volume by Application in 2022
Figure 47. Latin America Waterproof Breathable Textile Sales Market Share in Value by Application in 2022
Figure 48. Middle East and Africa Waterproof Breathable Textile Sales Market Share in Value by Application in 2022
Figure 49. Key Raw Materials Price
Figure 50. Waterproof Breathable Textile Manufacturing Cost Structure
Figure 51. Waterproof Breathable Textile Industrial Chain Analysis
Figure 52. Channels of Distribution
Figure 53. Distributors Profiles
Figure 54. Bottom-up and Top-down Approaches for This Report
Figure 55. Data Triangulation
Figure 56. Key Executives Interviewed