
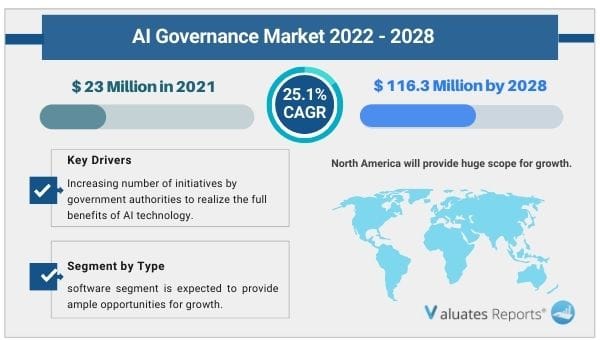
The global AI Governance market size is projected to reach US$ 116.3 million by 2028, from US$ 23 million in 2021, at a CAGR of 25.1% during 2022-2028. Key drivers of the AI governance market include the increasing number of initiatives by government authorities to realize the full benefits of AI technology. The demand for building trust, transparency, and preventing misuse in AI applications will spur the growth of the AI governance market during the forecast period. Moreover, The rise in regulatory compliances will drive the market expansion in the coming years.
Government-led initiatives for successful deployment of AI technology
The digital age transition has begun in full force. The rapid expansion of Artificial intelligence solutions in government agencies and businesses across the globe has necessitated the need for a robust governance system for AI implementation. The complexity, brand reputation, and protection of private consumer data are involved. Hence different governments are launching initiatives, setting up national guidelines, and a defined governance structure for successful AI configuration. These factors are expected to drive the growth of the AI governance market during the forecast period.
Need for trust, transparency, and Misuse prevention
Artificial intelligence is causing disruption in each and every sector. This gives a rise to the need for gaining people’s trust and being transparent in how machine learning algorithms collect and evaluate data. AI transparency becomes a vital issue in highly regulated industries such as BFSI, automotive, and Healthcare sectors where chances of misuse are high. Thus corporates are focusing on building proper governance systems thereby driving the growth of the AI governance market in the coming years.
Regulatory compliance
Regulations are changing rapidly. The continuous need to adjust to increasing audit trails, workflows, frameworks, and policies can be taxing for authorities. The need for maintaining compliance has become difficult with surging costs, misinterpretation, and wastage of resources. Artificial intelligence can help mitigate these issues. The capability to analyze and implement the right structure can help companies to allocate their resources efficiently. Hence AI governance can lead to proper regulatory compliance. This is expected to provide lucrative opportunities for the growth of the AI governance market in the subsequent years.
Based on type, the software segment is expected to provide ample opportunities for growth in the AI governance market share due to the growing reliance of users on AI software solutions.
Based on application, the car segment is expected to dominate in the AI governance market share as the advent of self-driving cars will require AI governance solutions for improving efficiency and decision making.
Based on region, North America will provide huge scope for growth in the AI governance market share due to the rapid adoption of AI governance systems, development of frameworks, policies for the same.
| Report Metric | Details |
| Report Name | AI Governance Market |
| The market size in 2021 | USD 23 Million |
| The revenue forecast in 2028 | USD 116.3 Million |
| Growth Rate | Compound Annual Growth Rate (CAGR) of 25.1% from 2022 to 2028 |
| Market size available for years | 2022-2028 |
| Forecast units | Value (USD) |
| Segments covered | Type, Application and Region |
| Report coverage | Revenue & volume forecast, company share, competitive landscape, growth factors, and trends |
| Geographic regions covered | North America, Europe, Asia Pacific, Latin America, Middle East & Africa |
Ans. The global AI Governance market size is projected to reach US$ 116.3 million by 2028, from US$ 23 million in 2021.
Ans. The global AI Governance market is expected to grow at a compound annual growth rate of 25.1% from 2022 to 2028.
Ans. Some of the key players are IBM, Google, Facebook, AWS, Microsoft, Salesforce.com, SAP, FICO, 2021.AI, ZestFinance, SAS Institute, Pymetrics, H2O.AI. integrate.ai & Others.
Table of Contents
1 Report Business Overview
1.1 Study Scope
1.2 Market Analysis by Type
1.2.1 Global AI Governance Market Size Growth Rate by Type, 2017 VS 2021 VS 2028
1.2.2 Software
1.2.3 Service
1.2.4 Other
1.3 Market by Application
1.3.1 Global AI Governance Market Size Growth Rate by Application, 2017 VS 2021 VS 2028
1.3.2 BFSI
1.3.3 Healthcare and Life Sciences
1.3.4 Government and Defense
1.3.5 Retail and Car
1.4 Study Objectives
1.5 Years Considered
2 Global Growth Trends
2.1 Global AI Governance Market Perspective (2017-2028)
2.2 AI Governance Growth Trends by Region
2.2.1 AI Governance Market Size by Region: 2017 VS 2021 VS 2028
2.2.2 AI Governance Historic Market Size by Region (2017-2022)
2.2.3 AI Governance Forecasted Market Size by Region (2023-2028)
2.3 AI Governance Market Dynamics
2.3.1 AI Governance Industry Trends
2.3.2 AI Governance Market Drivers
2.3.3 AI Governance Market Challenges
2.3.4 AI Governance Market Restraints
3 Competition Landscape by Key Players
3.1 Global Top AI Governance Players by Revenue
3.1.1 Global Top AI Governance Players by Revenue (2017-2022)
3.1.2 Global AI Governance Revenue Market Share by Players (2017-2022)
3.2 Global AI Governance Market Share by Company Type (Tier 1, Tier 2, and Tier 3)
3.3 Players Covered: Ranking by AI Governance Revenue
3.4 Global AI Governance Market Concentration Ratio
3.4.1 Global AI Governance Market Concentration Ratio (CR5 and HHI)
3.4.2 Global Top 10 and Top 5 Companies by AI Governance Revenue in 2021
3.5 AI Governance Key Players Head office and Area Served
3.6 Key Players AI Governance Product Solution and Service
3.7 Date of Enter into AI Governance Market
3.8 Mergers & Acquisitions, Expansion Plans
4 AI Governance Breakdown Data by Type
4.1 Global AI Governance Historic Market Size by Type (2017-2022)
4.2 Global AI Governance Forecasted Market Size by Type (2023-2028)
5 AI Governance Breakdown Data by Application
5.1 Global AI Governance Historic Market Size by Application (2017-2022)
5.2 Global AI Governance Forecasted Market Size by Application (2023-2028)
6 North America
6.1 North America AI Governance Market Size (2017-2028)
6.2 North America AI Governance Market Size by Type
6.2.1 North America AI Governance Market Size by Type (2017-2022)
6.2.2 North America AI Governance Market Size by Type (2023-2028)
6.2.3 North America AI Governance Market Share by Type (2017-2028)
6.3 North America AI Governance Market Size by Application
6.3.1 North America AI Governance Market Size by Application (2017-2022)
6.3.2 North America AI Governance Market Size by Application (2023-2028)
6.3.3 North America AI Governance Market Share by Application (2017-2028)
6.4 North America AI Governance Market Size by Country
6.4.1 North America AI Governance Market Size by Country (2017-2022)
6.4.2 North America AI Governance Market Size by Country (2023-2028)
6.4.3 U.S.
6.4.4 Canada
7 Europe
7.1 Europe AI Governance Market Size (2017-2028)
7.2 Europe AI Governance Market Size by Type
7.2.1 Europe AI Governance Market Size by Type (2017-2022)
7.2.2 Europe AI Governance Market Size by Type (2023-2028)
7.2.3 Europe AI Governance Market Share by Type (2017-2028)
7.3 Europe AI Governance Market Size by Application
7.3.1 Europe AI Governance Market Size by Application (2017-2022)
7.3.2 Europe AI Governance Market Size by Application (2023-2028)
7.3.3 Europe AI Governance Market Share by Application (2017-2028)
7.4 Europe AI Governance Market Size by Country
7.4.1 Europe AI Governance Market Size by Country (2017-2022)
7.4.2 Europe AI Governance Market Size by Country (2023-2028)
7.4.3 Germany
7.4.4 France
7.4.5 U.K.
7.4.6 Italy
7.4.7 Russia
7.4.8 Nordic Countries
8 Asia-Pacific
8.1 Asia-Pacific AI Governance Market Size (2017-2028)
8.2 Asia-Pacific AI Governance Market Size by Type
8.2.1 Asia-Pacific AI Governance Market Size by Type (2017-2022)
8.2.2 Asia-Pacific AI Governance Market Size by Type (2023-2028)
8.2.3 Asia-Pacific AI Governance Market Share by Type (2017-2028)
8.3 Asia-Pacific AI Governance Market Size by Application
8.3.1 Asia-Pacific AI Governance Market Size by Application (2017-2022)
8.3.2 Asia-Pacific AI Governance Market Size by Application (2023-2028)
8.3.3 Asia-Pacific AI Governance Market Share by Application (2017-2028)
8.4 Asia-Pacific AI Governance Market Size by Region
8.4.1 Asia-Pacific AI Governance Market Size by Region (2017-2022)
8.4.2 Asia-Pacific AI Governance Market Size by Region (2023-2028)
8.4.3 China
8.4.4 Japan
8.4.5 South Korea
8.4.6 Southeast Asia
8.4.7 India
8.4.8 Australia
9 Latin America
9.1 Latin America AI Governance Market Size (2017-2028)
9.2 Latin America AI Governance Market Size by Type
9.2.1 Latin America AI Governance Market Size by Type (2017-2022)
9.2.2 Latin America AI Governance Market Size by Type (2023-2028)
9.2.3 Latin America AI Governance Market Share by Type (2017-2028)
9.3 Latin America AI Governance Market Size by Application
9.3.1 Latin America AI Governance Market Size by Application (2017-2022)
9.3.2 Latin America AI Governance Market Size by Application (2023-2028)
9.3.3 Latin America AI Governance Market Share by Application (2017-2028)
9.4 Latin America AI Governance Market Size by Country
9.4.1 Latin America AI Governance Market Size by Country (2017-2022)
9.4.2 Latin America AI Governance Market Size by Country (2023-2028)
9.4.3 Mexico
9.4.4 Brazil
10 Middle East & Africa
10.1 Middle East & Africa AI Governance Market Size (2017-2028)
10.2 Middle East & Africa AI Governance Market Size by Type
10.2.1 Middle East & Africa AI Governance Market Size by Type (2017-2022)
10.2.2 Middle East & Africa AI Governance Market Size by Type (2023-2028)
10.2.3 Middle East & Africa AI Governance Market Share by Type (2017-2028)
10.3 Middle East & Africa AI Governance Market Size by Application
10.3.1 Middle East & Africa AI Governance Market Size by Application (2017-2022)
10.3.2 Middle East & Africa AI Governance Market Size by Application (2023-2028)
10.3.3 Middle East & Africa AI Governance Market Share by Application (2017-2028)
10.4 Middle East & Africa AI Governance Market Size by Country
10.4.1 Middle East & Africa AI Governance Market Size by Country (2017-2022)
10.4.2 Middle East & Africa AI Governance Market Size by Country (2023-2028)
10.4.3 Turkey
10.4.4 Saudi Arabia
10.4.5 UAE
11 Key Players Profiles
11.1 IBM
11.1.1 IBM Company Details
11.1.2 IBM Business Overview
11.1.3 IBM AI Governance Introduction
11.1.4 IBM Revenue in AI Governance Business (2017-2022)
11.1.5 IBM Recent Developments
11.2 Google
11.2.1 Google Company Details
11.2.2 Google Business Overview
11.2.3 Google AI Governance Introduction
11.2.4 Google Revenue in AI Governance Business (2017-2022)
11.2.5 Google Recent Developments
11.3 Facebook
11.3.1 Facebook Company Details
11.3.2 Facebook Business Overview
11.3.3 Facebook AI Governance Introduction
11.3.4 Facebook Revenue in AI Governance Business (2017-2022)
11.3.5 Facebook Recent Developments
11.4 AWS
11.4.1 AWS Company Details
11.4.2 AWS Business Overview
11.4.3 AWS AI Governance Introduction
11.4.4 AWS Revenue in AI Governance Business (2017-2022)
11.4.5 AWS Recent Developments
11.5 Microsoft
11.5.1 Microsoft Company Details
11.5.2 Microsoft Business Overview
11.5.3 Microsoft AI Governance Introduction
11.5.4 Microsoft Revenue in AI Governance Business (2017-2022)
11.5.5 Microsoft Recent Developments
11.6 Salesforce.com
11.6.1 Salesforce.com Company Details
11.6.2 Salesforce.com Business Overview
11.6.3 Salesforce.com AI Governance Introduction
11.6.4 Salesforce.com Revenue in AI Governance Business (2017-2022)
11.6.5 Salesforce.com Recent Developments
11.7 SAP
11.7.1 SAP Company Details
11.7.2 SAP Business Overview
11.7.3 SAP AI Governance Introduction
11.7.4 SAP Revenue in AI Governance Business (2017-2022)
11.7.5 SAP Recent Developments
11.8 FICO
11.8.1 FICO Company Details
11.8.2 FICO Business Overview
11.8.3 FICO AI Governance Introduction
11.8.4 FICO Revenue in AI Governance Business (2017-2022)
11.8.5 FICO Recent Developments
11.9 2021.AI
11.9.1 2021.AI Company Details
11.9.2 2021.AI Business Overview
11.9.3 2021.AI AI Governance Introduction
11.9.4 2021.AI Revenue in AI Governance Business (2017-2022)
11.9.5 2021.AI Recent Developments
11.10 ZestFinance
11.10.1 ZestFinance Company Details
11.10.2 ZestFinance Business Overview
11.10.3 ZestFinance AI Governance Introduction
11.10.4 ZestFinance Revenue in AI Governance Business (2017-2022)
11.10.5 ZestFinance Recent Developments
11.11 SAS Institute
11.11.1 SAS Institute Company Details
11.11.2 SAS Institute Business Overview
11.11.3 SAS Institute AI Governance Introduction
11.11.4 SAS Institute Revenue in AI Governance Business (2017-2022)
11.11.5 SAS Institute Recent Developments
11.12 Pymetrics
11.12.1 Pymetrics Company Details
11.12.2 Pymetrics Business Overview
11.12.3 Pymetrics AI Governance Introduction
11.12.4 Pymetrics Revenue in AI Governance Business (2017-2022)
11.12.5 Pymetrics Recent Developments
11.13 H2O.AI
11.13.1 H2O.AI Company Details
11.13.2 H2O.AI Business Overview
11.13.3 H2O.AI AI Governance Introduction
11.13.4 H2O.AI Revenue in AI Governance Business (2017-2022)
11.13.5 H2O.AI Recent Developments
11.14 integrate.ai
11.14.1 integrate.ai Company Details
11.14.2 integrate.ai Business Overview
11.14.3 integrate.ai AI Governance Introduction
11.14.4 integrate.ai Revenue in AI Governance Business (2017-2022)
11.14.5 integrate.ai Recent Developments
12 Analyst's Viewpoints/Conclusions
13 Appendix
13.1 Research Methodology
13.1.1 Methodology/Research Approach
13.1.2 Data Source
13.2 Author Details
13.3 Disclaimer
List of Tables
Table 1. Global AI Governance Market Size Growth Rate by Type (US$ Million), 2017 VS 2021 VS 2028
Table 2. Key Players of Software
Table 3. Key Players of Service
Table 4. Key Players of Other
Table 5. Global AI Governance Market Size Growth Rate by Application (US$ Million), 2017 VS 2021 VS 2028
Table 6. Global AI Governance Market Size by Region (US$ Million): 2017 VS 2021 VS 2028
Table 7. Global AI Governance Market Size by Region (2017-2022) & (US$ Million)
Table 8. Global AI Governance Market Share by Region (2017-2022)
Table 9. Global AI Governance Forecasted Market Size by Region (2023-2028) & (US$ Million)
Table 10. Global AI Governance Market Share by Region (2023-2028)
Table 11. AI Governance Market Trends
Table 12. AI Governance Market Drivers
Table 13. AI Governance Market Challenges
Table 14. AI Governance Market Restraints
Table 15. Global AI Governance Revenue by Players (2017-2022) & (US$ Million)
Table 16. Global AI Governance Revenue Share by Players (2017-2022)
Table 17. Global Top AI Governance by Company Type (Tier 1, Tier 2, and Tier 3) & (based on the Revenue in AI Governance as of 2021)
Table 18. Ranking of Global Top AI Governance Companies by Revenue (US$ Million) in 2021
Table 19. Global 5 Largest Players Market Share by AI Governance Revenue (CR5 and HHI) & (2017-2022)
Table 20. Key Players Headquarters and Area Served
Table 21. Key Players AI Governance Product Solution and Service
Table 22. Date of Enter into AI Governance Market
Table 23. Mergers & Acquisitions, Expansion Plans
Table 24. Global AI Governance Market Size by Type (2017-2022) & (US$ Million)
Table 25. Global AI Governance Revenue Market Share by Type (2017-2022)
Table 26. Global AI Governance Forecasted Market Size by Type (2023-2028) & (US$ Million)
Table 27. Global AI Governance Revenue Market Share by Type (2023-2028)
Table 28. Global AI Governance Market Size by Application (2017-2022) & (US$ Million)
Table 29. Global AI Governance Revenue Share by Application (2017-2022)
Table 30. Global AI Governance Forecasted Market Size by Application (2023-2028) & (US$ Million)
Table 31. Global AI Governance Revenue Share by Application (2023-2028)
Table 32. North America AI Governance Market Size by Type (2017-2022) & (US$ Million)
Table 33. North America AI Governance Market Size by Type (2023-2028) & (US$ Million)
Table 34. North America AI Governance Market Size by Application (2017-2022) & (US$ Million)
Table 35. North America AI Governance Market Size by Application (2023-2028) & (US$ Million)
Table 36. North America AI Governance Market Size by Country (2017-2022) & (US$ Million)
Table 37. North America AI Governance Market Size by Country (2023-2028) & (US$ Million)
Table 38. Europe AI Governance Market Size by Type (2017-2022) & (US$ Million)
Table 39. Europe AI Governance Market Size by Type (2023-2028) & (US$ Million)
Table 40. Europe AI Governance Market Size by Application (2017-2022) & (US$ Million)
Table 41. Europe AI Governance Market Size by Application (2023-2028) & (US$ Million)
Table 42. Europe AI Governance Market Size by Country (2017-2022) & (US$ Million)
Table 43. Europe AI Governance Market Size by Country (2023-2028) & (US$ Million)
Table 44. Asia Pacific AI Governance Market Size by Type (2017-2022) & (US$ Million)
Table 45. Asia Pacific AI Governance Market Size by Type (2023-2028) & (US$ Million)
Table 46. Asia Pacific AI Governance Market Size by Application (2017-2022) & (US$ Million)
Table 47. Asia Pacific AI Governance Market Size by Application (2023-2028) & (US$ Million)
Table 48. Asia Pacific AI Governance Market Size by Region (2017-2022) & (US$ Million)
Table 49. Asia Pacific AI Governance Market Size by Region (2023-2028) & (US$ Million)
Table 50. Latin America AI Governance Market Size by Type (2017-2022) & (US$ Million)
Table 51. Latin America AI Governance Market Size by Type (2023-2028) & (US$ Million)
Table 52. Latin America AI Governance Market Size by Application (2017-2022) & (US$ Million)
Table 53. Latin America AI Governance Market Size by Application (2023-2028) & (US$ Million)
Table 54. Latin America AI Governance Market Size by Country (2017-2022) & (US$ Million)
Table 55. Latin America AI Governance Market Size by Country (2023-2028) & (US$ Million)
Table 56. Middle East and Africa AI Governance Market Size by Type (2017-2022) & (US$ Million)
Table 57. Middle East and Africa AI Governance Market Size by Type (2023-2028) & (US$ Million)
Table 58. Middle East and Africa AI Governance Market Size by Application (2017-2022) & (US$ Million)
Table 59. Middle East and Africa AI Governance Market Size by Application (2023-2028) & (US$ Million)
Table 60. Middle East and Africa AI Governance Market Size by Country (2017-2022) & (US$ Million)
Table 61. Middle East and Africa AI Governance Market Size by Country (2023-2028) & (US$ Million)
Table 62. IBM Company Details
Table 63. IBM Business Overview
Table 64. IBM AI Governance Product
Table 65. IBM Revenue in AI Governance Business (2017-2022) & (US$ Million)
Table 66. IBM Recent Developments
Table 67. Google Company Details
Table 68. Google Business Overview
Table 69. Google AI Governance Product
Table 70. Google Revenue in AI Governance Business (2017-2022) & (US$ Million)
Table 71. Google Recent Developments
Table 72. Facebook Company Details
Table 73. Facebook Business Overview
Table 74. Facebook AI Governance Product
Table 75. Facebook Revenue in AI Governance Business (2017-2022) & (US$ Million)
Table 76. Facebook Recent Developments
Table 77. AWS Company Details
Table 78. AWS Business Overview
Table 79. AWS AI Governance Product
Table 80. AWS Revenue in AI Governance Business (2017-2022) & (US$ Million)
Table 81. AWS Recent Developments
Table 82. Microsoft Company Details
Table 83. Microsoft Business Overview
Table 84. Microsoft AI Governance Product
Table 85. Microsoft Revenue in AI Governance Business (2017-2022) & (US$ Million)
Table 86. Microsoft Recent Developments
Table 87. Salesforce.com Company Details
Table 88. Salesforce.com Business Overview
Table 89. Salesforce.com AI Governance Product
Table 90. Salesforce.com Revenue in AI Governance Business (2017-2022) & (US$ Million)
Table 91. Salesforce.com Recent Developments
Table 92. SAP Company Details
Table 93. SAP Business Overview
Table 94. SAP AI Governance Product
Table 95. SAP Revenue in AI Governance Business (2017-2022) & (US$ Million)
Table 96. SAP Recent Developments
Table 97. FICO Company Details
Table 98. FICO Business Overview
Table 99. FICO AI Governance Product
Table 100. FICO Revenue in AI Governance Business (2017-2022) & (US$ Million)
Table 101. FICO Recent Developments
Table 102. 2021.AI Company Details
Table 103. 2021.AI Business Overview
Table 104. 2021.AI AI Governance Product
Table 105. 2021.AI Revenue in AI Governance Business (2017-2022) & (US$ Million)
Table 106. 2021.AI Recent Developments
Table 107. ZestFinance Company Details
Table 108. ZestFinance Business Overview
Table 109. ZestFinance AI Governance Product
Table 110. ZestFinance Revenue in AI Governance Business (2017-2022) & (US$ Million)
Table 111. ZestFinance Recent Developments
Table 112. SAS Institute Company Details
Table 113. SAS Institute Business Overview
Table 114. SAS Institute AI Governance Product
Table 115. SAS Institute Revenue in AI Governance Business (2017-2022) & (US$ Million)
Table 116. SAS Institute Recent Developments
Table 117. Pymetrics Company Details
Table 118. Pymetrics Business Overview
Table 119. Pymetrics AI Governance Product
Table 120. Pymetrics Revenue in AI Governance Business (2017-2022) & (US$ Million)
Table 121. Pymetrics Recent Developments
Table 122. H2O.AI Company Details
Table 123. H2O.AI Business Overview
Table 124. H2O.AI AI Governance Product
Table 125. H2O.AI Revenue in AI Governance Business (2017-2022) & (US$ Million)
Table 126. H2O.AI Recent Developments
Table 127. integrate.ai Company Details
Table 128. integrate.ai Business Overview
Table 129. integrate.ai AI Governance Product
Table 130. integrate.ai Revenue in AI Governance Business (2017-2022) & (US$ Million)
Table 131. integrate.ai Recent Developments
Table 132. Research Programs/Design for This Report
Table 133. Key Data Information from Secondary Sources
Table 134. Key Data Information from Primary Sources
List of Figures
Figure 1. Global AI Governance Market Share by Type: 2021 VS 2028
Figure 2. Software Features
Figure 3. Service Features
Figure 4. Other Features
Figure 5. Global AI Governance Market Share by Application: 2021 VS 2028
Figure 6. BFSI Case Studies
Figure 7. Healthcare and Life Sciences Case Studies
Figure 8. Government and Defense Case Studies
Figure 9. Retail and Car Case Studies
Figure 10. AI Governance Report Years Considered
Figure 11. Global AI Governance Market Size (US$ Million), Year-over-Year: 2017-2028
Figure 12. Global AI Governance Market Size, (US$ Million), 2017 VS 2021 VS 2028
Figure 13. Global AI Governance Market Share by Region: 2021 VS 2028
Figure 14. Global AI Governance Market Share by Players in 2021
Figure 15. Global Top AI Governance Players by Company Type (Tier 1, Tier 2, and Tier 3) & (based on the Revenue in AI Governance as of 2021)
Figure 16. The Top 10 and 5 Players Market Share by AI Governance Revenue in 2021
Figure 17. North America AI Governance Market Size YoY (2017-2028) & (US$ Million)
Figure 18. North America AI Governance Market Size Market Share by Type (2017-2028)
Figure 19. North America AI Governance Market Size Market Share by Application (2017-2028)
Figure 20. North America AI Governance Market Size Share by Country (2017-2028)
Figure 21. United States AI Governance Market Size YoY Growth (2017-2028) & (US$ Million)
Figure 22. Canada AI Governance Market Size YoY Growth (2017-2028) & (US$ Million)
Figure 23. Europe AI Governance Market Size YoY (2017-2028) & (US$ Million)
Figure 24. Europe AI Governance Market Size Market Share by Type (2017-2028)
Figure 25. Europe AI Governance Market Size Market Share by Application (2017-2028)
Figure 26. Europe AI Governance Market Size Share by Country (2017-2028)
Figure 27. Germany AI Governance Market Size YoY Growth (2017-2028) & (US$ Million)
Figure 28. France AI Governance Market Size YoY Growth (2017-2028) & (US$ Million)
Figure 29. U.K. AI Governance Market Size YoY Growth (2017-2028) & (US$ Million)
Figure 30. Italy AI Governance Market Size YoY Growth (2017-2028) & (US$ Million)
Figure 31. Russia AI Governance Market Size YoY Growth (2017-2028) & (US$ Million)
Figure 32. Nordic Countries AI Governance Market Size YoY Growth (2017-2028) & (US$ Million)
Figure 33. Asia-Pacific AI Governance Market Size YoY (2017-2028) & (US$ Million)
Figure 34. Asia Pacific AI Governance Market Size Market Share by Type (2017-2028)
Figure 35. Asia Pacific AI Governance Market Size Market Share by Application (2017-2028)
Figure 36. Asia Pacific AI Governance Market Size Share by Region (2017-2028)
Figure 37. China AI Governance Market Size YoY Growth (2017-2028) & (US$ Million)
Figure 38. Japan AI Governance Market Size YoY Growth (2017-2028) & (US$ Million)
Figure 39. South Korea AI Governance Market Size YoY Growth (2017-2028) & (US$ Million)
Figure 40. Southeast Asia AI Governance Market Size YoY Growth (2017-2028) & (US$ Million)
Figure 41. India AI Governance Market Size YoY Growth (2017-2028) & (US$ Million)
Figure 42. Australia AI Governance Market Size YoY Growth (2017-2028) & (US$ Million)
List of Figures
Figure 43. Latin America AI Governance Market Size YoY (2017-2028) & (US$ Million)
Figure 44. Latin America AI Governance Market Size Market Share by Type (2017-2028)
Figure 45. Latin America AI Governance Market Size Market Share by Application (2017-2028)
Figure 46. Latin America AI Governance Market Size Share by Country (2017-2028)
Figure 47. Mexico AI Governance Market Size YoY Growth (2017-2028) & (US$ Million)
Figure 48. Brazil AI Governance Market Size YoY Growth (2017-2028) & (US$ Million)
Figure 49. Middle East & Africa AI Governance Market Size YoY (2017-2028) & (US$ Million)
Figure 50. Middle East and Africa AI Governance Market Size Market Share by Type (2017-2028)
Figure 51. Middle East and Africa AI Governance Market Size Market Share by Application (2017-2028)
Figure 52. Middle East and Africa AI Governance Market Size Share by Country (2017-2028)
Figure 53. Turkey AI Governance Market Size YoY Growth (2017-2028) & (US$ Million)
Figure 54. Saudi Arabia AI Governance Market Size YoY Growth (2017-2028) & (US$ Million)
Figure 55. UAE AI Governance Market Size YoY Growth (2017-2028) & (US$ Million)
Figure 56. IBM Revenue Growth Rate in AI Governance Business (2017-2022)
Figure 57. Google Revenue Growth Rate in AI Governance Business (2017-2022)
Figure 58. Facebook Revenue Growth Rate in AI Governance Business (2017-2022)
Figure 59. AWS Revenue Growth Rate in AI Governance Business (2017-2022)
Figure 60. Microsoft Revenue Growth Rate in AI Governance Business (2017-2022)
Figure 61. Salesforce.com Revenue Growth Rate in AI Governance Business (2017-2022)
Figure 62. SAP Revenue Growth Rate in AI Governance Business (2017-2022)
Figure 63. FICO Revenue Growth Rate in AI Governance Business (2017-2022)
Figure 64. 2021.AI Revenue Growth Rate in AI Governance Business (2017-2022)
Figure 65. ZestFinance Revenue Growth Rate in AI Governance Business (2017-2022)
Figure 66. SAS Institute Revenue Growth Rate in AI Governance Business (2017-2022)
Figure 67. Pymetrics Revenue Growth Rate in AI Governance Business (2017-2022)
Figure 68. H2O.AI Revenue Growth Rate in AI Governance Business (2017-2022)
Figure 69. integrate.ai Revenue Growth Rate in AI Governance Business (2017-2022)
Figure 70. Bottom-up and Top-down Approaches for This Report
Figure 71. Data Triangulation
Figure 72. Key Executives Interviewed
$4900
$9800
HAVE A QUERY?
OUR CUSTOMER

SIMILAR REPORTS