List of Tables
Table 1. Global Carbon Dioxide Pipeline Transport Market Size Growth Rate by Type (US$ Million): 2021 vs 2025 vs 2032
Table 2. Key Players of Gaseous Transport
Table 3. Key Players of Liquid Transport
Table 4. Key Players of Supercritical Transport
Table 5. Global Carbon Dioxide Pipeline Transport Market Size Growth Rate by Progress (US$ Million): 2021 vs 2025 vs 2032
Table 6. Key Players of Point-to-point Dedicated Line Transportation Service
Table 7. Key Players of Multi-user Shared Pipeline Service
Table 8. Key Players of Hybrid Transportation Service
Table 9. Key Players of Others
Table 10. Global Carbon Dioxide Pipeline Transport Market Size Growth Rate by Nature (US$ Million): 2021 vs 2025 vs 2032
Table 11. Key Players of Public Pipes
Table 12. Key Players of Private Pipes
Table 13. Global Carbon Dioxide Pipeline Transport Market Size Growth by Application (US$ Million): 2021 vs 2025 vs 2032
Table 14. Global Carbon Dioxide Pipeline Transport Market Size by Region (US$ Million): 2021 vs 2025 vs 2032
Table 15. Global Carbon Dioxide Pipeline Transport Market Size by Region (US$ Million), 2021–2026
Table 16. Global Carbon Dioxide Pipeline Transport Market Share by Region (2021–2026)
Table 17. Global Carbon Dioxide Pipeline Transport Forecasted Market Size by Region (US$ Million), 2027–2032
Table 18. Global Carbon Dioxide Pipeline Transport Market Share by Region (2027–2032)
Table 19. Carbon Dioxide Pipeline Transport Market Trends
Table 20. Carbon Dioxide Pipeline Transport Market Drivers
Table 21. Carbon Dioxide Pipeline Transport Market Challenges
Table 22. Carbon Dioxide Pipeline Transport Market Restraints
Table 23. Global Carbon Dioxide Pipeline Transport Revenue by Players (US$ Million), 2021–2026
Table 24. Global Carbon Dioxide Pipeline Transport Market Share by Players (2021–2026)
Table 25. Global Top Carbon Dioxide Pipeline Transport Players by Tier (Tier 1, Tier 2, and Tier 3), based on Carbon Dioxide Pipeline Transport Revenue, 2025
Table 26. Ranking of Global Top Carbon Dioxide Pipeline Transport Companies by Revenue (US$ Million) in 2025
Table 27. Global 5 Largest Players Market Share by Carbon Dioxide Pipeline Transport Revenue (CR5 and HHI), 2021–2026
Table 28. Global Key Players of Carbon Dioxide Pipeline Transport, Headquarters and Area Served
Table 29. Global Key Players of Carbon Dioxide Pipeline Transport, Products and Applications
Table 30. Global Key Players of Carbon Dioxide Pipeline Transport, Date of General Availability (GA)
Table 31. Mergers and Acquisitions, Expansion Plans
Table 32. Global Carbon Dioxide Pipeline Transport Market Size by Type (US$ Million), 2021–2026
Table 33. Global Carbon Dioxide Pipeline Transport Revenue Market Share by Type (2021–2026)
Table 34. Global Carbon Dioxide Pipeline Transport Forecasted Market Size by Type (US$ Million), 2027–2032
Table 35. Global Carbon Dioxide Pipeline Transport Revenue Market Share by Type (2027–2032)
Table 36. Global Carbon Dioxide Pipeline Transport Market Size by Application (US$ Million), 2021–2026
Table 37. Global Carbon Dioxide Pipeline Transport Revenue Market Share by Application (2021–2026)
Table 38. Global Carbon Dioxide Pipeline Transport Forecasted Market Size by Application (US$ Million), 2027–2032
Table 39. Global Carbon Dioxide Pipeline Transport Revenue Market Share by Application (2027–2032)
Table 40. North America Carbon Dioxide Pipeline Transport Market Size Growth Rate by Country (US$ Million): 2021 vs 2025 vs 2032
Table 41. North America Carbon Dioxide Pipeline Transport Market Size by Country (US$ Million), 2021–2026
Table 42. North America Carbon Dioxide Pipeline Transport Market Size by Country (US$ Million), 2027–2032
Table 43. Europe Carbon Dioxide Pipeline Transport Market Size Growth Rate by Country (US$ Million): 2021 vs 2025 vs 2032
Table 44. Europe Carbon Dioxide Pipeline Transport Market Size by Country (US$ Million), 2021–2026
Table 45. Europe Carbon Dioxide Pipeline Transport Market Size by Country (US$ Million), 2027–2032
Table 46. Asia-Pacific Carbon Dioxide Pipeline Transport Market Size Growth Rate by Region (US$ Million): 2021 vs 2025 vs 2032
Table 47. Asia-Pacific Carbon Dioxide Pipeline Transport Market Size by Region (US$ Million), 2021–2026
Table 48. Asia-Pacific Carbon Dioxide Pipeline Transport Market Size by Region (US$ Million), 2027–2032
Table 49. Latin America Carbon Dioxide Pipeline Transport Market Size Growth Rate by Country (US$ Million): 2021 vs 2025 vs 2032
Table 50. Latin America Carbon Dioxide Pipeline Transport Market Size by Country (US$ Million), 2021–2026
Table 51. Latin America Carbon Dioxide Pipeline Transport Market Size by Country (US$ Million), 2027–2032
Table 52. Middle East & Africa Carbon Dioxide Pipeline Transport Market Size Growth Rate by Country (US$ Million): 2021 vs 2025 vs 2032
Table 53. Middle East & Africa Carbon Dioxide Pipeline Transport Market Size by Country (US$ Million), 2021–2026
Table 54. Middle East & Africa Carbon Dioxide Pipeline Transport Market Size by Country (US$ Million), 2027–2032
Table 55. Denbury Inc Company Details
Table 56. Denbury Inc Business Overview
Table 57. Denbury Inc Carbon Dioxide Pipeline Transport Product
Table 58. Denbury Inc Revenue in Carbon Dioxide Pipeline Transport Business (US$ Million), 2021–2026
Table 59. Denbury Inc Recent Development
Table 60. Kinder Morgan Company Details
Table 61. Kinder Morgan Business Overview
Table 62. Kinder Morgan Carbon Dioxide Pipeline Transport Product
Table 63. Kinder Morgan Revenue in Carbon Dioxide Pipeline Transport Business (US$ Million), 2021–2026
Table 64. Kinder Morgan Recent Development
Table 65. OLCV (Occidental) Company Details
Table 66. OLCV (Occidental) Business Overview
Table 67. OLCV (Occidental) Carbon Dioxide Pipeline Transport Product
Table 68. OLCV (Occidental) Revenue in Carbon Dioxide Pipeline Transport Business (US$ Million), 2021–2026
Table 69. OLCV (Occidental) Recent Development
Table 70. Chevron Corporation Company Details
Table 71. Chevron Corporation Business Overview
Table 72. Chevron Corporation Carbon Dioxide Pipeline Transport Product
Table 73. Chevron Corporation Revenue in Carbon Dioxide Pipeline Transport Business (US$ Million), 2021–2026
Table 74. Chevron Corporation Recent Development
Table 75. Larvik Shipping Company Details
Table 76. Larvik Shipping Business Overview
Table 77. Larvik Shipping Carbon Dioxide Pipeline Transport Product
Table 78. Larvik Shipping Revenue in Carbon Dioxide Pipeline Transport Business (US$ Million), 2021–2026
Table 79. Larvik Shipping Recent Development
Table 80. Wolf Midstream Company Details
Table 81. Wolf Midstream Business Overview
Table 82. Wolf Midstream Carbon Dioxide Pipeline Transport Product
Table 83. Wolf Midstream Revenue in Carbon Dioxide Pipeline Transport Business (US$ Million), 2021–2026
Table 84. Wolf Midstream Recent Development
Table 85. TC Energy Company Details
Table 86. TC Energy Business Overview
Table 87. TC Energy Carbon Dioxide Pipeline Transport Product
Table 88. TC Energy Revenue in Carbon Dioxide Pipeline Transport Business (US$ Million), 2021–2026
Table 89. TC Energy Recent Development
Table 90. Summit Carbon Solutions Company Details
Table 91. Summit Carbon Solutions Business Overview
Table 92. Summit Carbon Solutions Carbon Dioxide Pipeline Transport Product
Table 93. Summit Carbon Solutions Revenue in Carbon Dioxide Pipeline Transport Business (US$ Million), 2021–2026
Table 94. Summit Carbon Solutions Recent Development
Table 95. Fluor Corporation Company Details
Table 96. Fluor Corporation Business Overview
Table 97. Fluor Corporation Carbon Dioxide Pipeline Transport Product
Table 98. Fluor Corporation Revenue in Carbon Dioxide Pipeline Transport Business (US$ Million), 2021–2026
Table 99. Fluor Corporation Recent Development
Table 100. Northern Lights(TotalEnergies,Equinor,Shell) Company Details
Table 101. Northern Lights(TotalEnergies,Equinor,Shell) Business Overview
Table 102. Northern Lights(TotalEnergies,Equinor,Shell) Carbon Dioxide Pipeline Transport Product
Table 103. Northern Lights(TotalEnergies,Equinor,Shell) Revenue in Carbon Dioxide Pipeline Transport Business (US$ Million), 2021–2026
Table 104. Northern Lights(TotalEnergies,Equinor,Shell) Recent Development
Table 105. NaTran Company Details
Table 106. NaTran Business Overview
Table 107. NaTran Carbon Dioxide Pipeline Transport Product
Table 108. NaTran Revenue in Carbon Dioxide Pipeline Transport Business (US$ Million), 2021–2026
Table 109. NaTran Recent Development
Table 110. NEP Company Details
Table 111. NEP Business Overview
Table 112. NEP Carbon Dioxide Pipeline Transport Product
Table 113. NEP Revenue in Carbon Dioxide Pipeline Transport Business (US$ Million), 2021–2026
Table 114. NEP Recent Development
Table 115. Baker Hughes Company Details
Table 116. Baker Hughes Business Overview
Table 117. Baker Hughes Carbon Dioxide Pipeline Transport Product
Table 118. Baker Hughes Revenue in Carbon Dioxide Pipeline Transport Business (US$ Million), 2021–2026
Table 119. Baker Hughes Recent Development
Table 120. Stellae Energy Company Details
Table 121. Stellae Energy Business Overview
Table 122. Stellae Energy Carbon Dioxide Pipeline Transport Product
Table 123. Stellae Energy Revenue in Carbon Dioxide Pipeline Transport Business (US$ Million), 2021–2026
Table 124. Stellae Energy Recent Development
Table 125. BP Company Details
Table 126. BP Business Overview
Table 127. BP Carbon Dioxide Pipeline Transport Product
Table 128. BP Revenue in Carbon Dioxide Pipeline Transport Business (US$ Million), 2021–2026
Table 129. BP Recent Development
Table 130. Dakota Gasification Company Company Details
Table 131. Dakota Gasification Company Business Overview
Table 132. Dakota Gasification Company Carbon Dioxide Pipeline Transport Product
Table 133. Dakota Gasification Company Revenue in Carbon Dioxide Pipeline Transport Business (US$ Million), 2021–2026
Table 134. Dakota Gasification Company Recent Development
Table 135. Tallgrass Energy Company Details
Table 136. Tallgrass Energy Business Overview
Table 137. Tallgrass Energy Carbon Dioxide Pipeline Transport Product
Table 138. Tallgrass Energy Revenue in Carbon Dioxide Pipeline Transport Business (US$ Million), 2021–2026
Table 139. Tallgrass Energy Recent Development
Table 140. Linde Company Details
Table 141. Linde Business Overview
Table 142. Linde Carbon Dioxide Pipeline Transport Product
Table 143. Linde Revenue in Carbon Dioxide Pipeline Transport Business (US$ Million), 2021–2026
Table 144. Linde Recent Development
Table 145. Air Liquide Company Details
Table 146. Air Liquide Business Overview
Table 147. Air Liquide Carbon Dioxide Pipeline Transport Product
Table 148. Air Liquide Revenue in Carbon Dioxide Pipeline Transport Business (US$ Million), 2021–2026
Table 149. Air Liquide Recent Development
Table 150. Navigator CO₂ Ventures Company Details
Table 151. Navigator CO₂ Ventures Business Overview
Table 152. Navigator CO₂ Ventures Carbon Dioxide Pipeline Transport Product
Table 153. Navigator CO₂ Ventures Revenue in Carbon Dioxide Pipeline Transport Business (US$ Million), 2021–2026
Table 154. Navigator CO₂ Ventures Recent Development
Table 155. Research Programs/Design for This Report
Table 156. Key Data Information from Secondary Sources
Table 157. Key Data Information from Primary Sources
Table 158. Authors List of This Report
List of Figures
Figure 1. Carbon Dioxide Pipeline Transport Picture
Figure 2. Global Carbon Dioxide Pipeline Transport Market Size Comparison by Type (US$ Million), 2021–2032
Figure 3. Global Carbon Dioxide Pipeline Transport Market Share by Type: 2025 vs 2032
Figure 4. Gaseous Transport Features
Figure 5. Liquid Transport Features
Figure 6. Supercritical Transport Features
Figure 7. Global Carbon Dioxide Pipeline Transport Market Size Comparison by Progress (US$ Million), 2021–2032
Figure 8. Point-to-point Dedicated Line Transportation Service Features
Figure 9. Multi-user Shared Pipeline Service Features
Figure 10. Hybrid Transportation Service Features
Figure 11. Others Features
Figure 12. Global Carbon Dioxide Pipeline Transport Market Size Comparison by Nature (US$ Million), 2021–2032
Figure 13. Public Pipes Features
Figure 14. Private Pipes Features
Figure 15. Global Carbon Dioxide Pipeline Transport Market Size by Application (US$ Million), 2021–2032
Figure 16. Global Carbon Dioxide Pipeline Transport Market Share by Application: 2025 vs 2032
Figure 17. Energy Industry Case Studies
Figure 18. Industrial Manufacturing Case Studies
Figure 19. Agriculture & Food Case Studies
Figure 20. Others Case Studies
Figure 21. Carbon Dioxide Pipeline Transport Report Years Considered
Figure 22. Global Carbon Dioxide Pipeline Transport Market Size (US$ Million), Year-over-Year: 2021–2032
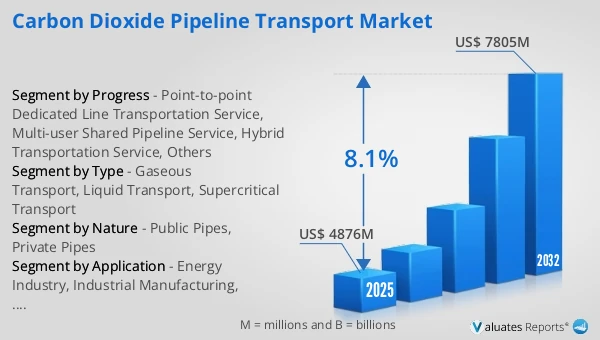
Figure 23. Global Carbon Dioxide Pipeline Transport Market Size, (US$ Million), 2021 vs 2025 vs 2032
Figure 24. Global Carbon Dioxide Pipeline Transport Market Share by Region: 2025 vs 2032
Figure 25. Global Carbon Dioxide Pipeline Transport Market Share by Players in 2025
Figure 26. Global Carbon Dioxide Pipeline Transport Market Share by Company Type (Tier 1, Tier 2, and Tier 3)
Figure 27. The Top 10 and 5 Players Market Share by Carbon Dioxide Pipeline Transport Revenue in 2025
Figure 28. North America Carbon Dioxide Pipeline Transport Market Size YoY Growth (US$ Million), 2021–2032
Figure 29. North America Carbon Dioxide Pipeline Transport Market Share by Country (2021–2032)
Figure 30. United States Carbon Dioxide Pipeline Transport Market Size YoY Growth (US$ Million), 2021–2032
Figure 31. Canada Carbon Dioxide Pipeline Transport Market Size YoY Growth (US$ Million), 2021–2032
Figure 32. Europe Carbon Dioxide Pipeline Transport Market Size YoY Growth (US$ Million), 2021–2032
Figure 33. Europe Carbon Dioxide Pipeline Transport Market Share by Country (2021–2032)
Figure 34. Germany Carbon Dioxide Pipeline Transport Market Size YoY Growth (US$ Million), 2021–2032
Figure 35. France Carbon Dioxide Pipeline Transport Market Size YoY Growth (US$ Million), 2021–2032
Figure 36. U.K. Carbon Dioxide Pipeline Transport Market Size YoY Growth (US$ Million), 2021–2032
Figure 37. Italy Carbon Dioxide Pipeline Transport Market Size YoY Growth (US$ Million), 2021–2032
Figure 38. Russia Carbon Dioxide Pipeline Transport Market Size YoY Growth (US$ Million), 2021–2032
Figure 39. Ireland Carbon Dioxide Pipeline Transport Market Size YoY Growth (US$ Million), 2021–2032
Figure 40. Asia-Pacific Carbon Dioxide Pipeline Transport Market Size YoY Growth (US$ Million), 2021–2032
Figure 41. Asia-Pacific Carbon Dioxide Pipeline Transport Market Share by Region (2021–2032)
Figure 42. China Carbon Dioxide Pipeline Transport Market Size YoY Growth (US$ Million), 2021–2032
Figure 43. Japan Carbon Dioxide Pipeline Transport Market Size YoY Growth (US$ Million), 2021–2032
Figure 44. South Korea Carbon Dioxide Pipeline Transport Market Size YoY Growth (US$ Million), 2021–2032
Figure 45. Southeast Asia Carbon Dioxide Pipeline Transport Market Size YoY Growth (US$ Million), 2021–2032
Figure 46. India Carbon Dioxide Pipeline Transport Market Size YoY Growth (US$ Million), 2021–2032
Figure 47. Australia & New Zealand Carbon Dioxide Pipeline Transport Market Size YoY Growth (US$ Million), 2021–2032
Figure 48. Latin America Carbon Dioxide Pipeline Transport Market Size YoY Growth (US$ Million), 2021–2032
Figure 49. Latin America Carbon Dioxide Pipeline Transport Market Share by Country (2021–2032)
Figure 50. Mexico Carbon Dioxide Pipeline Transport Market Size YoY Growth (US$ Million), 2021–2032
Figure 51. Brazil Carbon Dioxide Pipeline Transport Market Size YoY Growth (US$ Million), 2021–2032
Figure 52. Middle East & Africa Carbon Dioxide Pipeline Transport Market Size YoY Growth (US$ Million), 2021–2032
Figure 53. Middle East & Africa Carbon Dioxide Pipeline Transport Market Share by Country (2021–2032)
Figure 54. Israel Carbon Dioxide Pipeline Transport Market Size YoY Growth (US$ Million), 2021–2032
Figure 55. Saudi Arabia Carbon Dioxide Pipeline Transport Market Size YoY Growth (US$ Million), 2021–2032
Figure 56. UAE Carbon Dioxide Pipeline Transport Market Size YoY Growth (US$ Million), 2021–2032
Figure 57. Denbury Inc Revenue Growth Rate in Carbon Dioxide Pipeline Transport Business (2021–2026)
Figure 58. Kinder Morgan Revenue Growth Rate in Carbon Dioxide Pipeline Transport Business (2021–2026)
Figure 59. OLCV (Occidental) Revenue Growth Rate in Carbon Dioxide Pipeline Transport Business (2021–2026)
Figure 60. Chevron Corporation Revenue Growth Rate in Carbon Dioxide Pipeline Transport Business (2021–2026)
Figure 61. Larvik Shipping Revenue Growth Rate in Carbon Dioxide Pipeline Transport Business (2021–2026)
Figure 62. Wolf Midstream Revenue Growth Rate in Carbon Dioxide Pipeline Transport Business (2021–2026)
Figure 63. TC Energy Revenue Growth Rate in Carbon Dioxide Pipeline Transport Business (2021–2026)
Figure 64. Summit Carbon Solutions Revenue Growth Rate in Carbon Dioxide Pipeline Transport Business (2021–2026)
Figure 65. Fluor Corporation Revenue Growth Rate in Carbon Dioxide Pipeline Transport Business (2021–2026)
Figure 66. Northern Lights(TotalEnergies,Equinor,Shell) Revenue Growth Rate in Carbon Dioxide Pipeline Transport Business (2021–2026)
Figure 67. NaTran Revenue Growth Rate in Carbon Dioxide Pipeline Transport Business (2021–2026)
Figure 68. NEP Revenue Growth Rate in Carbon Dioxide Pipeline Transport Business (2021–2026)
Figure 69. Baker Hughes Revenue Growth Rate in Carbon Dioxide Pipeline Transport Business (2021–2026)
Figure 70. Stellae Energy Revenue Growth Rate in Carbon Dioxide Pipeline Transport Business (2021–2026)
Figure 71. BP Revenue Growth Rate in Carbon Dioxide Pipeline Transport Business (2021–2026)
Figure 72. Dakota Gasification Company Revenue Growth Rate in Carbon Dioxide Pipeline Transport Business (2021–2026)
Figure 73. Tallgrass Energy Revenue Growth Rate in Carbon Dioxide Pipeline Transport Business (2021–2026)
Figure 74. Linde Revenue Growth Rate in Carbon Dioxide Pipeline Transport Business (2021–2026)
Figure 75. Air Liquide Revenue Growth Rate in Carbon Dioxide Pipeline Transport Business (2021–2026)
Figure 76. Navigator CO₂ Ventures Revenue Growth Rate in Carbon Dioxide Pipeline Transport Business (2021–2026)
Figure 77. Bottom-up and Top-down Approaches for This Report
Figure 78. Data Triangulation
Figure 79. Key Executives Interviewed