List of Tables
Table 1. Global Semiconductor Facility Hook Up Services Market Size Growth Rate by Type (US$ Million): 2021 vs 2025 vs 2032
Table 2. Key Players of Water & UPW Hook Up
Table 3. Key Players of Gas & Pumping Hook Up
Table 4. Key Players of Chemical Hook Up
Table 5. Key Players of Drain Hook Up
Table 6. Key Players of Exhaust Hook Up
Table 7. Key Players of Others
Table 8. Global Semiconductor Facility Hook Up Services Market Size Growth Rate by Application (US$ Million): 2021 vs 2025 vs 2032
Table 9. Key Players of Wafer Fabrication
Table 10. Key Players of semiconductor Material
Table 11. Key Players of Semiconductor Packaging and Testing
Table 12. Global Semiconductor Facility Hook Up Services Market Size Growth by Wafer Size (US$ Million): 2021 vs 2025 vs 2032
Table 13. Global Semiconductor Facility Hook Up Services Market Size by Region (US$ Million): 2021 vs 2025 vs 2032
Table 14. Global Semiconductor Facility Hook Up Services Market Size by Region (US$ Million), 2021–2026
Table 15. Global Semiconductor Facility Hook Up Services Market Share by Region (2021–2026)
Table 16. Global Semiconductor Facility Hook Up Services Forecasted Market Size by Region (US$ Million), 2027–2032
Table 17. Global Semiconductor Facility Hook Up Services Market Share by Region (2027–2032)
Table 18. Semiconductor Facility Hook Up Services Market Trends
Table 19. Semiconductor Facility Hook Up Services Market Drivers
Table 20. Semiconductor Facility Hook Up Services Market Challenges
Table 21. Semiconductor Facility Hook Up Services Market Restraints
Table 22. Global Semiconductor Facility Hook Up Services Revenue by Players (US$ Million), 2021–2026
Table 23. Global Semiconductor Facility Hook Up Services Market Share by Players (2021–2026)
Table 24. Global Top Semiconductor Facility Hook Up Services Players by Tier (Tier 1, Tier 2, and Tier 3), based on Semiconductor Facility Hook Up Services Revenue, 2025
Table 25. Ranking of Global Top Semiconductor Facility Hook Up Services Companies by Revenue (US$ Million) in 2025
Table 26. Global 5 Largest Players Market Share by Semiconductor Facility Hook Up Services Revenue (CR5 and HHI), 2021–2026
Table 27. Global Key Players of Semiconductor Facility Hook Up Services, Headquarters and Area Served
Table 28. Global Key Players of Semiconductor Facility Hook Up Services, Products and Applications
Table 29. Global Key Players of Semiconductor Facility Hook Up Services, Date of General Availability (GA)
Table 30. Mergers and Acquisitions, Expansion Plans
Table 31. Global Semiconductor Facility Hook Up Services Market Size by Type (US$ Million), 2021–2026
Table 32. Global Semiconductor Facility Hook Up Services Revenue Market Share by Type (2021–2026)
Table 33. Global Semiconductor Facility Hook Up Services Forecasted Market Size by Type (US$ Million), 2027–2032
Table 34. Global Semiconductor Facility Hook Up Services Revenue Market Share by Type (2027–2032)
Table 35. Global Semiconductor Facility Hook Up Services Market Size by Wafer Size (US$ Million), 2021–2026
Table 36. Global Semiconductor Facility Hook Up Services Revenue Market Share by Wafer Size (2021–2026)
Table 37. Global Semiconductor Facility Hook Up Services Forecasted Market Size by Wafer Size (US$ Million), 2027–2032
Table 38. Global Semiconductor Facility Hook Up Services Revenue Market Share by Wafer Size (2027–2032)
Table 39. North America Semiconductor Facility Hook Up Services Market Size Growth Rate by Country (US$ Million): 2021 vs 2025 vs 2032
Table 40. North America Semiconductor Facility Hook Up Services Market Size by Country (US$ Million), 2021–2026
Table 41. North America Semiconductor Facility Hook Up Services Market Size by Country (US$ Million), 2027–2032
Table 42. Europe Semiconductor Facility Hook Up Services Market Size Growth Rate by Country (US$ Million): 2021 vs 2025 vs 2032
Table 43. Europe Semiconductor Facility Hook Up Services Market Size by Country (US$ Million), 2021–2026
Table 44. Europe Semiconductor Facility Hook Up Services Market Size by Country (US$ Million), 2027–2032
Table 45. Asia-Pacific Semiconductor Facility Hook Up Services Market Size Growth Rate by Region (US$ Million): 2021 vs 2025 vs 2032
Table 46. Asia-Pacific Semiconductor Facility Hook Up Services Market Size by Region (US$ Million), 2021–2026
Table 47. Asia-Pacific Semiconductor Facility Hook Up Services Market Size by Region (US$ Million), 2027–2032
Table 48. Latin America Semiconductor Facility Hook Up Services Market Size Growth Rate by Country (US$ Million): 2021 vs 2025 vs 2032
Table 49. Latin America Semiconductor Facility Hook Up Services Market Size by Country (US$ Million), 2021–2026
Table 50. Latin America Semiconductor Facility Hook Up Services Market Size by Country (US$ Million), 2027–2032
Table 51. Middle East & Africa Semiconductor Facility Hook Up Services Market Size Growth Rate by Country (US$ Million): 2021 vs 2025 vs 2032
Table 52. Middle East & Africa Semiconductor Facility Hook Up Services Market Size by Country (US$ Million), 2021–2026
Table 53. Middle East & Africa Semiconductor Facility Hook Up Services Market Size by Country (US$ Million), 2027–2032
Table 54. United Integrated Services Co., Ltd Company Details
Table 55. United Integrated Services Co., Ltd Business Overview
Table 56. United Integrated Services Co., Ltd Semiconductor Facility Hook Up Services Product
Table 57. United Integrated Services Co., Ltd Revenue in Semiconductor Facility Hook Up Services Business (US$ Million), 2021–2026
Table 58. United Integrated Services Co., Ltd Recent Development
Table 59. Jiangxi United Integrated Services Company Details
Table 60. Jiangxi United Integrated Services Business Overview
Table 61. Jiangxi United Integrated Services Semiconductor Facility Hook Up Services Product
Table 62. Jiangxi United Integrated Services Revenue in Semiconductor Facility Hook Up Services Business (US$ Million), 2021–2026
Table 63. Jiangxi United Integrated Services Recent Development
Table 64. Both Engineering Tech Company Details
Table 65. Both Engineering Tech Business Overview
Table 66. Both Engineering Tech Semiconductor Facility Hook Up Services Product
Table 67. Both Engineering Tech Revenue in Semiconductor Facility Hook Up Services Business (US$ Million), 2021–2026
Table 68. Both Engineering Tech Recent Development
Table 69. Acter Co., Ltd (Taiwan) Company Details
Table 70. Acter Co., Ltd (Taiwan) Business Overview
Table 71. Acter Co., Ltd (Taiwan) Semiconductor Facility Hook Up Services Product
Table 72. Acter Co., Ltd (Taiwan) Revenue in Semiconductor Facility Hook Up Services Business (US$ Million), 2021–2026
Table 73. Acter Co., Ltd (Taiwan) Recent Development
Table 74. Acter Technology Integration Group Company Details
Table 75. Acter Technology Integration Group Business Overview
Table 76. Acter Technology Integration Group Semiconductor Facility Hook Up Services Product
Table 77. Acter Technology Integration Group Revenue in Semiconductor Facility Hook Up Services Business (US$ Million), 2021–2026
Table 78. Acter Technology Integration Group Recent Development
Table 79. L&K Engineering Company Details
Table 80. L&K Engineering Business Overview
Table 81. L&K Engineering Semiconductor Facility Hook Up Services Product
Table 82. L&K Engineering Revenue in Semiconductor Facility Hook Up Services Business (US$ Million), 2021–2026
Table 83. L&K Engineering Recent Development
Table 84. L&K Engineering (Suzhou) Company Details
Table 85. L&K Engineering (Suzhou) Business Overview
Table 86. L&K Engineering (Suzhou) Semiconductor Facility Hook Up Services Product
Table 87. L&K Engineering (Suzhou) Revenue in Semiconductor Facility Hook Up Services Business (US$ Million), 2021–2026
Table 88. L&K Engineering (Suzhou) Recent Development
Table 89. Wholetech System Hitech Company Details
Table 90. Wholetech System Hitech Business Overview
Table 91. Wholetech System Hitech Semiconductor Facility Hook Up Services Product
Table 92. Wholetech System Hitech Revenue in Semiconductor Facility Hook Up Services Business (US$ Million), 2021–2026
Table 93. Wholetech System Hitech Recent Development
Table 94. Yankee Engineering Company Details
Table 95. Yankee Engineering Business Overview
Table 96. Yankee Engineering Semiconductor Facility Hook Up Services Product
Table 97. Yankee Engineering Revenue in Semiconductor Facility Hook Up Services Business (US$ Million), 2021–2026
Table 98. Yankee Engineering Recent Development
Table 99. China Electronics Engineering Design Institute (CEEDI) Company Details
Table 100. China Electronics Engineering Design Institute (CEEDI) Business Overview
Table 101. China Electronics Engineering Design Institute (CEEDI) Semiconductor Facility Hook Up Services Product
Table 102. China Electronics Engineering Design Institute (CEEDI) Revenue in Semiconductor Facility Hook Up Services Business (US$ Million), 2021–2026
Table 103. China Electronics Engineering Design Institute (CEEDI) Recent Development
Table 104. EDRI (Taiji Industry) Company Details
Table 105. EDRI (Taiji Industry) Business Overview
Table 106. EDRI (Taiji Industry) Semiconductor Facility Hook Up Services Product
Table 107. EDRI (Taiji Industry) Revenue in Semiconductor Facility Hook Up Services Business (US$ Million), 2021–2026
Table 108. EDRI (Taiji Industry) Recent Development
Table 109. CESE2 Company Details
Table 110. CESE2 Business Overview
Table 111. CESE2 Semiconductor Facility Hook Up Services Product
Table 112. CESE2 Revenue in Semiconductor Facility Hook Up Services Business (US$ Million), 2021–2026
Table 113. CESE2 Recent Development
Table 114. CEFOC Company Details
Table 115. CEFOC Business Overview
Table 116. CEFOC Semiconductor Facility Hook Up Services Product
Table 117. CEFOC Revenue in Semiconductor Facility Hook Up Services Business (US$ Million), 2021–2026
Table 118. CEFOC Recent Development
Table 119. Exyte Company Details
Table 120. Exyte Business Overview
Table 121. Exyte Semiconductor Facility Hook Up Services Product
Table 122. Exyte Revenue in Semiconductor Facility Hook Up Services Business (US$ Million), 2021–2026
Table 123. Exyte Recent Development
Table 124. Jacobs Engineering Company Details
Table 125. Jacobs Engineering Business Overview
Table 126. Jacobs Engineering Semiconductor Facility Hook Up Services Product
Table 127. Jacobs Engineering Revenue in Semiconductor Facility Hook Up Services Business (US$ Million), 2021–2026
Table 128. Jacobs Engineering Recent Development
Table 129. Samsung C&T Corporation Company Details
Table 130. Samsung C&T Corporation Business Overview
Table 131. Samsung C&T Corporation Semiconductor Facility Hook Up Services Product
Table 132. Samsung C&T Corporation Revenue in Semiconductor Facility Hook Up Services Business (US$ Million), 2021–2026
Table 133. Samsung C&T Corporation Recent Development
Table 134. Hyundai E&C Company Details
Table 135. Hyundai E&C Business Overview
Table 136. Hyundai E&C Semiconductor Facility Hook Up Services Product
Table 137. Hyundai E&C Revenue in Semiconductor Facility Hook Up Services Business (US$ Million), 2021–2026
Table 138. Hyundai E&C Recent Development
Table 139. Kelington Group Berhad (KGB) Company Details
Table 140. Kelington Group Berhad (KGB) Business Overview
Table 141. Kelington Group Berhad (KGB) Semiconductor Facility Hook Up Services Product
Table 142. Kelington Group Berhad (KGB) Revenue in Semiconductor Facility Hook Up Services Business (US$ Million), 2021–2026
Table 143. Kelington Group Berhad (KGB) Recent Development
Table 144. International Facility Engineering (IFE) Company Details
Table 145. International Facility Engineering (IFE) Business Overview
Table 146. International Facility Engineering (IFE) Semiconductor Facility Hook Up Services Product
Table 147. International Facility Engineering (IFE) Revenue in Semiconductor Facility Hook Up Services Business (US$ Million), 2021–2026
Table 148. International Facility Engineering (IFE) Recent Development
Table 149. ChenFull International Company Details
Table 150. ChenFull International Business Overview
Table 151. ChenFull International Semiconductor Facility Hook Up Services Product
Table 152. ChenFull International Revenue in Semiconductor Facility Hook Up Services Business (US$ Million), 2021–2026
Table 153. ChenFull International Recent Development
Table 154. Toyoko Kagaku Company Details
Table 155. Toyoko Kagaku Business Overview
Table 156. Toyoko Kagaku Semiconductor Facility Hook Up Services Product
Table 157. Toyoko Kagaku Revenue in Semiconductor Facility Hook Up Services Business (US$ Million), 2021–2026
Table 158. Toyoko Kagaku Recent Development
Table 159. Total Facility Engineering (TFE) Company Details
Table 160. Total Facility Engineering (TFE) Business Overview
Table 161. Total Facility Engineering (TFE) Semiconductor Facility Hook Up Services Product
Table 162. Total Facility Engineering (TFE) Revenue in Semiconductor Facility Hook Up Services Business (US$ Million), 2021–2026
Table 163. Total Facility Engineering (TFE) Recent Development
Table 164. ACFM E&C Company Details
Table 165. ACFM E&C Business Overview
Table 166. ACFM E&C Semiconductor Facility Hook Up Services Product
Table 167. ACFM E&C Revenue in Semiconductor Facility Hook Up Services Business (US$ Million), 2021–2026
Table 168. ACFM E&C Recent Development
Table 169. Chuan Engineering Company Details
Table 170. Chuan Engineering Business Overview
Table 171. Chuan Engineering Semiconductor Facility Hook Up Services Product
Table 172. Chuan Engineering Revenue in Semiconductor Facility Hook Up Services Business (US$ Million), 2021–2026
Table 173. Chuan Engineering Recent Development
Table 174. Cleantech Services (CTS) Company Details
Table 175. Cleantech Services (CTS) Business Overview
Table 176. Cleantech Services (CTS) Semiconductor Facility Hook Up Services Product
Table 177. Cleantech Services (CTS) Revenue in Semiconductor Facility Hook Up Services Business (US$ Million), 2021–2026
Table 178. Cleantech Services (CTS) Recent Development
Table 179. Hexatech Engineering Sdn Bhd Company Details
Table 180. Hexatech Engineering Sdn Bhd Business Overview
Table 181. Hexatech Engineering Sdn Bhd Semiconductor Facility Hook Up Services Product
Table 182. Hexatech Engineering Sdn Bhd Revenue in Semiconductor Facility Hook Up Services Business (US$ Million), 2021–2026
Table 183. Hexatech Engineering Sdn Bhd Recent Development
Table 184. H&Y Engineering Company Details
Table 185. H&Y Engineering Business Overview
Table 186. H&Y Engineering Semiconductor Facility Hook Up Services Product
Table 187. H&Y Engineering Revenue in Semiconductor Facility Hook Up Services Business (US$ Million), 2021–2026
Table 188. H&Y Engineering Recent Development
Table 189. TL Engineering Co., Ltd Company Details
Table 190. TL Engineering Co., Ltd Business Overview
Table 191. TL Engineering Co., Ltd Semiconductor Facility Hook Up Services Product
Table 192. TL Engineering Co., Ltd Revenue in Semiconductor Facility Hook Up Services Business (US$ Million), 2021–2026
Table 193. TL Engineering Co., Ltd Recent Development
Table 194. Orbit & Skyline Company Details
Table 195. Orbit & Skyline Business Overview
Table 196. Orbit & Skyline Semiconductor Facility Hook Up Services Product
Table 197. Orbit & Skyline Revenue in Semiconductor Facility Hook Up Services Business (US$ Million), 2021–2026
Table 198. Orbit & Skyline Recent Development
Table 199. Ortner Reinraumtechnik GmbH Company Details
Table 200. Ortner Reinraumtechnik GmbH Business Overview
Table 201. Ortner Reinraumtechnik GmbH Semiconductor Facility Hook Up Services Product
Table 202. Ortner Reinraumtechnik GmbH Revenue in Semiconductor Facility Hook Up Services Business (US$ Million), 2021–2026
Table 203. Ortner Reinraumtechnik GmbH Recent Development
Table 204. Hejing Industry Development Company Details
Table 205. Hejing Industry Development Business Overview
Table 206. Hejing Industry Development Semiconductor Facility Hook Up Services Product
Table 207. Hejing Industry Development Revenue in Semiconductor Facility Hook Up Services Business (US$ Million), 2021–2026
Table 208. Hejing Industry Development Recent Development
Table 209. Equans S.A.S. Company Details
Table 210. Equans S.A.S. Business Overview
Table 211. Equans S.A.S. Semiconductor Facility Hook Up Services Product
Table 212. Equans S.A.S. Revenue in Semiconductor Facility Hook Up Services Business (US$ Million), 2021–2026
Table 213. Equans S.A.S. Recent Development
Table 214. Bilfinger SE Company Details
Table 215. Bilfinger SE Business Overview
Table 216. Bilfinger SE Semiconductor Facility Hook Up Services Product
Table 217. Bilfinger SE Revenue in Semiconductor Facility Hook Up Services Business (US$ Million), 2021–2026
Table 218. Bilfinger SE Recent Development
Table 219. Research Programs/Design for This Report
Table 220. Key Data Information from Secondary Sources
Table 221. Key Data Information from Primary Sources
Table 222. Authors List of This Report
List of Figures
Figure 1. Semiconductor Facility Hook Up Services Picture
Figure 2. Global Semiconductor Facility Hook Up Services Market Size Comparison by Type (US$ Million), 2021–2032
Figure 3. Global Semiconductor Facility Hook Up Services Market Share by Type: 2025 vs 2032
Figure 4. Water & UPW Hook Up Features
Figure 5. Gas & Pumping Hook Up Features
Figure 6. Chemical Hook Up Features
Figure 7. Drain Hook Up Features
Figure 8. Exhaust Hook Up Features
Figure 9. Others Features
Figure 10. Global Semiconductor Facility Hook Up Services Market Size Comparison by Application (US$ Million), 2021–2032
Figure 11. Wafer Fabrication Features
Figure 12. semiconductor Material Features
Figure 13. Semiconductor Packaging and Testing Features
Figure 14. Global Semiconductor Facility Hook Up Services Market Size by Wafer Size (US$ Million), 2021–2032
Figure 15. Global Semiconductor Facility Hook Up Services Market Share by Wafer Size: 2025 vs 2032
Figure 16. 300mm Wafer Fabs Case Studies
Figure 17. 200mm Wafer Fabs Case Studies
Figure 18. Others Case Studies
Figure 19. Semiconductor Facility Hook Up Services Report Years Considered
Figure 20. Global Semiconductor Facility Hook Up Services Market Size (US$ Million), Year-over-Year: 2021–2032
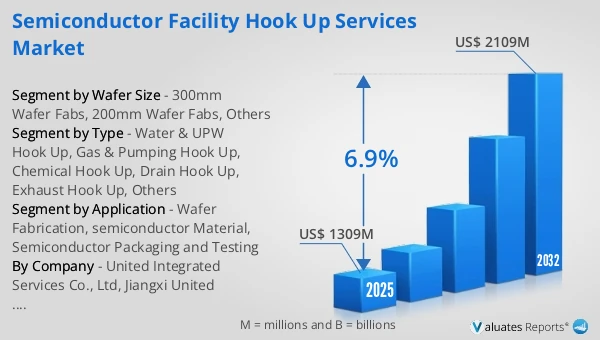
Figure 21. Global Semiconductor Facility Hook Up Services Market Size, (US$ Million), 2021 vs 2025 vs 2032
Figure 22. Global Semiconductor Facility Hook Up Services Market Share by Region: 2025 vs 2032
Figure 23. Global Semiconductor Facility Hook Up Services Market Share by Players in 2025
Figure 24. Global Semiconductor Facility Hook Up Services Market Share by Company Type (Tier 1, Tier 2, and Tier 3)
Figure 25. The Top 10 and 5 Players Market Share by Semiconductor Facility Hook Up Services Revenue in 2025
Figure 26. North America Semiconductor Facility Hook Up Services Market Size YoY Growth (US$ Million), 2021–2032
Figure 27. North America Semiconductor Facility Hook Up Services Market Share by Country (2021–2032)
Figure 28. United States Semiconductor Facility Hook Up Services Market Size YoY Growth (US$ Million), 2021–2032
Figure 29. Canada Semiconductor Facility Hook Up Services Market Size YoY Growth (US$ Million), 2021–2032
Figure 30. Europe Semiconductor Facility Hook Up Services Market Size YoY Growth (US$ Million), 2021–2032
Figure 31. Europe Semiconductor Facility Hook Up Services Market Share by Country (2021–2032)
Figure 32. Germany Semiconductor Facility Hook Up Services Market Size YoY Growth (US$ Million), 2021–2032
Figure 33. France Semiconductor Facility Hook Up Services Market Size YoY Growth (US$ Million), 2021–2032
Figure 34. U.K. Semiconductor Facility Hook Up Services Market Size YoY Growth (US$ Million), 2021–2032
Figure 35. Italy Semiconductor Facility Hook Up Services Market Size YoY Growth (US$ Million), 2021–2032
Figure 36. Russia Semiconductor Facility Hook Up Services Market Size YoY Growth (US$ Million), 2021–2032
Figure 37. Ireland Semiconductor Facility Hook Up Services Market Size YoY Growth (US$ Million), 2021–2032
Figure 38. Asia-Pacific Semiconductor Facility Hook Up Services Market Size YoY Growth (US$ Million), 2021–2032
Figure 39. Asia-Pacific Semiconductor Facility Hook Up Services Market Share by Region (2021–2032)
Figure 40. China Semiconductor Facility Hook Up Services Market Size YoY Growth (US$ Million), 2021–2032
Figure 41. Japan Semiconductor Facility Hook Up Services Market Size YoY Growth (US$ Million), 2021–2032
Figure 42. South Korea Semiconductor Facility Hook Up Services Market Size YoY Growth (US$ Million), 2021–2032
Figure 43. Southeast Asia Semiconductor Facility Hook Up Services Market Size YoY Growth (US$ Million), 2021–2032
Figure 44. India Semiconductor Facility Hook Up Services Market Size YoY Growth (US$ Million), 2021–2032
Figure 45. Australia & New Zealand Semiconductor Facility Hook Up Services Market Size YoY Growth (US$ Million), 2021–2032
Figure 46. Latin America Semiconductor Facility Hook Up Services Market Size YoY Growth (US$ Million), 2021–2032
Figure 47. Latin America Semiconductor Facility Hook Up Services Market Share by Country (2021–2032)
Figure 48. Mexico Semiconductor Facility Hook Up Services Market Size YoY Growth (US$ Million), 2021–2032
Figure 49. Brazil Semiconductor Facility Hook Up Services Market Size YoY Growth (US$ Million), 2021–2032
Figure 50. Middle East & Africa Semiconductor Facility Hook Up Services Market Size YoY Growth (US$ Million), 2021–2032
Figure 51. Middle East & Africa Semiconductor Facility Hook Up Services Market Share by Country (2021–2032)
Figure 52. Israel Semiconductor Facility Hook Up Services Market Size YoY Growth (US$ Million), 2021–2032
Figure 53. Saudi Arabia Semiconductor Facility Hook Up Services Market Size YoY Growth (US$ Million), 2021–2032
Figure 54. UAE Semiconductor Facility Hook Up Services Market Size YoY Growth (US$ Million), 2021–2032
Figure 55. United Integrated Services Co., Ltd Revenue Growth Rate in Semiconductor Facility Hook Up Services Business (2021–2026)
Figure 56. Jiangxi United Integrated Services Revenue Growth Rate in Semiconductor Facility Hook Up Services Business (2021–2026)
Figure 57. Both Engineering Tech Revenue Growth Rate in Semiconductor Facility Hook Up Services Business (2021–2026)
Figure 58. Acter Co., Ltd (Taiwan) Revenue Growth Rate in Semiconductor Facility Hook Up Services Business (2021–2026)
Figure 59. Acter Technology Integration Group Revenue Growth Rate in Semiconductor Facility Hook Up Services Business (2021–2026)
Figure 60. L&K Engineering Revenue Growth Rate in Semiconductor Facility Hook Up Services Business (2021–2026)
Figure 61. L&K Engineering (Suzhou) Revenue Growth Rate in Semiconductor Facility Hook Up Services Business (2021–2026)
Figure 62. Wholetech System Hitech Revenue Growth Rate in Semiconductor Facility Hook Up Services Business (2021–2026)
Figure 63. Yankee Engineering Revenue Growth Rate in Semiconductor Facility Hook Up Services Business (2021–2026)
Figure 64. China Electronics Engineering Design Institute (CEEDI) Revenue Growth Rate in Semiconductor Facility Hook Up Services Business (2021–2026)
Figure 65. EDRI (Taiji Industry) Revenue Growth Rate in Semiconductor Facility Hook Up Services Business (2021–2026)
Figure 66. CESE2 Revenue Growth Rate in Semiconductor Facility Hook Up Services Business (2021–2026)
Figure 67. CEFOC Revenue Growth Rate in Semiconductor Facility Hook Up Services Business (2021–2026)
Figure 68. Exyte Revenue Growth Rate in Semiconductor Facility Hook Up Services Business (2021–2026)
Figure 69. Jacobs Engineering Revenue Growth Rate in Semiconductor Facility Hook Up Services Business (2021–2026)
Figure 70. Samsung C&T Corporation Revenue Growth Rate in Semiconductor Facility Hook Up Services Business (2021–2026)
Figure 71. Hyundai E&C Revenue Growth Rate in Semiconductor Facility Hook Up Services Business (2021–2026)
Figure 72. Kelington Group Berhad (KGB) Revenue Growth Rate in Semiconductor Facility Hook Up Services Business (2021–2026)
Figure 73. International Facility Engineering (IFE) Revenue Growth Rate in Semiconductor Facility Hook Up Services Business (2021–2026)
Figure 74. ChenFull International Revenue Growth Rate in Semiconductor Facility Hook Up Services Business (2021–2026)
Figure 75. Toyoko Kagaku Revenue Growth Rate in Semiconductor Facility Hook Up Services Business (2021–2026)
Figure 76. Total Facility Engineering (TFE) Revenue Growth Rate in Semiconductor Facility Hook Up Services Business (2021–2026)
Figure 77. ACFM E&C Revenue Growth Rate in Semiconductor Facility Hook Up Services Business (2021–2026)
Figure 78. Chuan Engineering Revenue Growth Rate in Semiconductor Facility Hook Up Services Business (2021–2026)
Figure 79. Cleantech Services (CTS) Revenue Growth Rate in Semiconductor Facility Hook Up Services Business (2021–2026)
Figure 80. Hexatech Engineering Sdn Bhd Revenue Growth Rate in Semiconductor Facility Hook Up Services Business (2021–2026)
Figure 81. H&Y Engineering Revenue Growth Rate in Semiconductor Facility Hook Up Services Business (2021–2026)
Figure 82. TL Engineering Co., Ltd Revenue Growth Rate in Semiconductor Facility Hook Up Services Business (2021–2026)
Figure 83. Orbit & Skyline Revenue Growth Rate in Semiconductor Facility Hook Up Services Business (2021–2026)
Figure 84. Ortner Reinraumtechnik GmbH Revenue Growth Rate in Semiconductor Facility Hook Up Services Business (2021–2026)
Figure 85. Hejing Industry Development Revenue Growth Rate in Semiconductor Facility Hook Up Services Business (2021–2026)
Figure 86. Equans S.A.S. Revenue Growth Rate in Semiconductor Facility Hook Up Services Business (2021–2026)
Figure 87. Bilfinger SE Revenue Growth Rate in Semiconductor Facility Hook Up Services Business (2021–2026)
Figure 88. Bottom-up and Top-down Approaches for This Report
Figure 89. Data Triangulation
Figure 90. Key Executives Interviewed