List of Tables
Table 1. Global Medical Express Service Market Size Growth Rate by Type (US$ Million): 2021 vs 2025 vs 2032
Table 2. Key Players of Intra-City (Local)
Table 3. Key Players of Inter-City/Regional
Table 4. Key Players of National/International
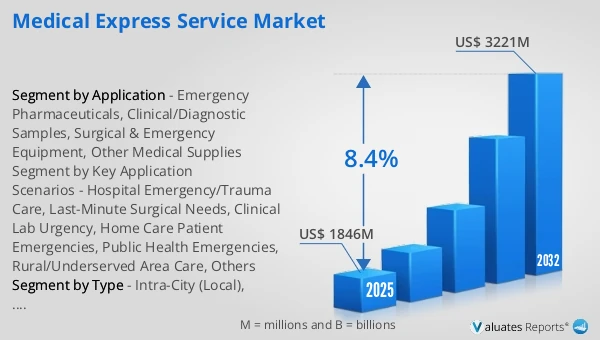
Table 5. Global Medical Express Service Market Size Growth Rate by Key Application Scenarios (US$ Million): 2021 vs 2025 vs 2032
Table 6. Key Players of Hospital Emergency/Trauma Care
Table 7. Key Players of Last-Minute Surgical Needs
Table 8. Key Players of Clinical Lab Urgency
Table 9. Key Players of Home Care Patient Emergencies
Table 10. Key Players of Public Health Emergencies
Table 11. Key Players of Rural/Underserved Area Care
Table 12. Key Players of Others
Table 13. Global Medical Express Service Market Size Growth by Application (US$ Million): 2021 vs 2025 vs 2032
Table 14. Global Medical Express Service Market Size by Region (US$ Million): 2021 vs 2025 vs 2032
Table 15. Global Medical Express Service Market Size by Region (US$ Million), 2021–2026
Table 16. Global Medical Express Service Market Share by Region (2021–2026)
Table 17. Global Medical Express Service Forecasted Market Size by Region (US$ Million), 2027–2032
Table 18. Global Medical Express Service Market Share by Region (2027–2032)
Table 19. Medical Express Service Market Trends
Table 20. Medical Express Service Market Drivers
Table 21. Medical Express Service Market Challenges
Table 22. Medical Express Service Market Restraints
Table 23. Global Medical Express Service Revenue by Players (US$ Million), 2021–2026
Table 24. Global Medical Express Service Market Share by Players (2021–2026)
Table 25. Global Top Medical Express Service Players by Tier (Tier 1, Tier 2, and Tier 3), based on Medical Express Service Revenue, 2025
Table 26. Ranking of Global Top Medical Express Service Companies by Revenue (US$ Million) in 2025
Table 27. Global 5 Largest Players Market Share by Medical Express Service Revenue (CR5 and HHI), 2021–2026
Table 28. Global Key Players of Medical Express Service, Headquarters and Area Served
Table 29. Global Key Players of Medical Express Service, Products and Applications
Table 30. Global Key Players of Medical Express Service, Date of General Availability (GA)
Table 31. Mergers and Acquisitions, Expansion Plans
Table 32. Global Medical Express Service Market Size by Type (US$ Million), 2021–2026
Table 33. Global Medical Express Service Revenue Market Share by Type (2021–2026)
Table 34. Global Medical Express Service Forecasted Market Size by Type (US$ Million), 2027–2032
Table 35. Global Medical Express Service Revenue Market Share by Type (2027–2032)
Table 36. Global Medical Express Service Market Size by Application (US$ Million), 2021–2026
Table 37. Global Medical Express Service Revenue Market Share by Application (2021–2026)
Table 38. Global Medical Express Service Forecasted Market Size by Application (US$ Million), 2027–2032
Table 39. Global Medical Express Service Revenue Market Share by Application (2027–2032)
Table 40. North America Medical Express Service Market Size Growth Rate by Country (US$ Million): 2021 vs 2025 vs 2032
Table 41. North America Medical Express Service Market Size by Country (US$ Million), 2021–2026
Table 42. North America Medical Express Service Market Size by Country (US$ Million), 2027–2032
Table 43. Europe Medical Express Service Market Size Growth Rate by Country (US$ Million): 2021 vs 2025 vs 2032
Table 44. Europe Medical Express Service Market Size by Country (US$ Million), 2021–2026
Table 45. Europe Medical Express Service Market Size by Country (US$ Million), 2027–2032
Table 46. Asia-Pacific Medical Express Service Market Size Growth Rate by Region (US$ Million): 2021 vs 2025 vs 2032
Table 47. Asia-Pacific Medical Express Service Market Size by Region (US$ Million), 2021–2026
Table 48. Asia-Pacific Medical Express Service Market Size by Region (US$ Million), 2027–2032
Table 49. Latin America Medical Express Service Market Size Growth Rate by Country (US$ Million): 2021 vs 2025 vs 2032
Table 50. Latin America Medical Express Service Market Size by Country (US$ Million), 2021–2026
Table 51. Latin America Medical Express Service Market Size by Country (US$ Million), 2027–2032
Table 52. Middle East & Africa Medical Express Service Market Size Growth Rate by Country (US$ Million): 2021 vs 2025 vs 2032
Table 53. Middle East & Africa Medical Express Service Market Size by Country (US$ Million), 2021–2026
Table 54. Middle East & Africa Medical Express Service Market Size by Country (US$ Million), 2027–2032
Table 55. DHL Company Details
Table 56. DHL Business Overview
Table 57. DHL Medical Express Service Product
Table 58. DHL Revenue in Medical Express Service Business (US$ Million), 2021–2026
Table 59. DHL Recent Development
Table 60. UPS Company Details
Table 61. UPS Business Overview
Table 62. UPS Medical Express Service Product
Table 63. UPS Revenue in Medical Express Service Business (US$ Million), 2021–2026
Table 64. UPS Recent Development
Table 65. LogistiCare Company Details
Table 66. LogistiCare Business Overview
Table 67. LogistiCare Medical Express Service Product
Table 68. LogistiCare Revenue in Medical Express Service Business (US$ Million), 2021–2026
Table 69. LogistiCare Recent Development
Table 70. FedEx Company Details
Table 71. FedEx Business Overview
Table 72. FedEx Medical Express Service Product
Table 73. FedEx Revenue in Medical Express Service Business (US$ Million), 2021–2026
Table 74. FedEx Recent Development
Table 75. CEVA Logistics Company Details
Table 76. CEVA Logistics Business Overview
Table 77. CEVA Logistics Medical Express Service Product
Table 78. CEVA Logistics Revenue in Medical Express Service Business (US$ Million), 2021–2026
Table 79. CEVA Logistics Recent Development
Table 80. International SOS Company Details
Table 81. International SOS Business Overview
Table 82. International SOS Medical Express Service Product
Table 83. International SOS Revenue in Medical Express Service Business (US$ Million), 2021–2026
Table 84. International SOS Recent Development
Table 85. Matternet Company Details
Table 86. Matternet Business Overview
Table 87. Matternet Medical Express Service Product
Table 88. Matternet Revenue in Medical Express Service Business (US$ Million), 2021–2026
Table 89. Matternet Recent Development
Table 90. Zipline Company Details
Table 91. Zipline Business Overview
Table 92. Zipline Medical Express Service Product
Table 93. Zipline Revenue in Medical Express Service Business (US$ Million), 2021–2026
Table 94. Zipline Recent Development
Table 95. Swoop Aero Company Details
Table 96. Swoop Aero Business Overview
Table 97. Swoop Aero Medical Express Service Product
Table 98. Swoop Aero Revenue in Medical Express Service Business (US$ Million), 2021–2026
Table 99. Swoop Aero Recent Development
Table 100. Flirtey Company Details
Table 101. Flirtey Business Overview
Table 102. Flirtey Medical Express Service Product
Table 103. Flirtey Revenue in Medical Express Service Business (US$ Million), 2021–2026
Table 104. Flirtey Recent Development
Table 105. Dachser Company Details
Table 106. Dachser Business Overview
Table 107. Dachser Medical Express Service Product
Table 108. Dachser Revenue in Medical Express Service Business (US$ Million), 2021–2026
Table 109. Dachser Recent Development
Table 110. Maersk Company Details
Table 111. Maersk Business Overview
Table 112. Maersk Medical Express Service Product
Table 113. Maersk Revenue in Medical Express Service Business (US$ Million), 2021–2026
Table 114. Maersk Recent Development
Table 115. Samsung SDS Company Details
Table 116. Samsung SDS Business Overview
Table 117. Samsung SDS Medical Express Service Product
Table 118. Samsung SDS Revenue in Medical Express Service Business (US$ Million), 2021–2026
Table 119. Samsung SDS Recent Development
Table 120. JD Logistics Company Details
Table 121. JD Logistics Business Overview
Table 122. JD Logistics Medical Express Service Product
Table 123. JD Logistics Revenue in Medical Express Service Business (US$ Million), 2021–2026
Table 124. JD Logistics Recent Development
Table 125. S.F.Express Company Details
Table 126. S.F.Express Business Overview
Table 127. S.F.Express Medical Express Service Product
Table 128. S.F.Express Revenue in Medical Express Service Business (US$ Million), 2021–2026
Table 129. S.F.Express Recent Development
Table 130. Debon Express Company Details
Table 131. Debon Express Business Overview
Table 132. Debon Express Medical Express Service Product
Table 133. Debon Express Revenue in Medical Express Service Business (US$ Million), 2021–2026
Table 134. Debon Express Recent Development
Table 135. GoShare Company Details
Table 136. GoShare Business Overview
Table 137. GoShare Medical Express Service Product
Table 138. GoShare Revenue in Medical Express Service Business (US$ Million), 2021–2026
Table 139. GoShare Recent Development
Table 140. Rapidus Company Details
Table 141. Rapidus Business Overview
Table 142. Rapidus Medical Express Service Product
Table 143. Rapidus Revenue in Medical Express Service Business (US$ Million), 2021–2026
Table 144. Rapidus Recent Development
Table 145. AC - Associated Couriers Company Details
Table 146. AC - Associated Couriers Business Overview
Table 147. AC - Associated Couriers Medical Express Service Product
Table 148. AC - Associated Couriers Revenue in Medical Express Service Business (US$ Million), 2021–2026
Table 149. AC - Associated Couriers Recent Development
Table 150. Dropoff Company Details
Table 151. Dropoff Business Overview
Table 152. Dropoff Medical Express Service Product
Table 153. Dropoff Revenue in Medical Express Service Business (US$ Million), 2021–2026
Table 154. Dropoff Recent Development
Table 155. Couriers Texas Company Details
Table 156. Couriers Texas Business Overview
Table 157. Couriers Texas Medical Express Service Product
Table 158. Couriers Texas Revenue in Medical Express Service Business (US$ Million), 2021–2026
Table 159. Couriers Texas Recent Development
Table 160. Bungii Company Details
Table 161. Bungii Business Overview
Table 162. Bungii Medical Express Service Product
Table 163. Bungii Revenue in Medical Express Service Business (US$ Million), 2021–2026
Table 164. Bungii Recent Development
Table 165. Econo-Courier Company Details
Table 166. Econo-Courier Business Overview
Table 167. Econo-Courier Medical Express Service Product
Table 168. Econo-Courier Revenue in Medical Express Service Business (US$ Million), 2021–2026
Table 169. Econo-Courier Recent Development
Table 170. MCI Company Details
Table 171. MCI Business Overview
Table 172. MCI Medical Express Service Product
Table 173. MCI Revenue in Medical Express Service Business (US$ Million), 2021–2026
Table 174. MCI Recent Development
Table 175. Diligent Company Details
Table 176. Diligent Business Overview
Table 177. Diligent Medical Express Service Product
Table 178. Diligent Revenue in Medical Express Service Business (US$ Million), 2021–2026
Table 179. Diligent Recent Development
Table 180. Road Flex Delivery Company Details
Table 181. Road Flex Delivery Business Overview
Table 182. Road Flex Delivery Medical Express Service Product
Table 183. Road Flex Delivery Revenue in Medical Express Service Business (US$ Million), 2021–2026
Table 184. Road Flex Delivery Recent Development
Table 185. Raven Force Courier Company Details
Table 186. Raven Force Courier Business Overview
Table 187. Raven Force Courier Medical Express Service Product
Table 188. Raven Force Courier Revenue in Medical Express Service Business (US$ Million), 2021–2026
Table 189. Raven Force Courier Recent Development
Table 190. NoCo Transporter Company Details
Table 191. NoCo Transporter Business Overview
Table 192. NoCo Transporter Medical Express Service Product
Table 193. NoCo Transporter Revenue in Medical Express Service Business (US$ Million), 2021–2026
Table 194. NoCo Transporter Recent Development
Table 195. CharmMedical Company Details
Table 196. CharmMedical Business Overview
Table 197. CharmMedical Medical Express Service Product
Table 198. CharmMedical Revenue in Medical Express Service Business (US$ Million), 2021–2026
Table 199. CharmMedical Recent Development
Table 200. Purolator Company Details
Table 201. Purolator Business Overview
Table 202. Purolator Medical Express Service Product
Table 203. Purolator Revenue in Medical Express Service Business (US$ Million), 2021–2026
Table 204. Purolator Recent Development
Table 205. Research Programs/Design for This Report
Table 206. Key Data Information from Secondary Sources
Table 207. Key Data Information from Primary Sources
Table 208. Authors List of This Report
List of Figures
Figure 1. Medical Express Service Picture
Figure 2. Global Medical Express Service Market Size Comparison by Type (US$ Million), 2021–2032
Figure 3. Global Medical Express Service Market Share by Type: 2025 vs 2032
Figure 4. Intra-City (Local) Features
Figure 5. Inter-City/Regional Features
Figure 6. National/International Features
Figure 7. Global Medical Express Service Market Size Comparison by Key Application Scenarios (US$ Million), 2021–2032
Figure 8. Hospital Emergency/Trauma Care Features
Figure 9. Last-Minute Surgical Needs Features
Figure 10. Clinical Lab Urgency Features
Figure 11. Home Care Patient Emergencies Features
Figure 12. Public Health Emergencies Features
Figure 13. Rural/Underserved Area Care Features
Figure 14. Others Features
Figure 15. Global Medical Express Service Market Size by Application (US$ Million), 2021–2032
Figure 16. Global Medical Express Service Market Share by Application: 2025 vs 2032
Figure 17. Emergency Pharmaceuticals Case Studies
Figure 18. Clinical/Diagnostic Samples Case Studies
Figure 19. Surgical & Emergency Equipment Case Studies
Figure 20. Other Medical Supplies Case Studies
Figure 21. Medical Express Service Report Years Considered
Figure 22. Global Medical Express Service Market Size (US$ Million), Year-over-Year: 2021–2032
Figure 23. Global Medical Express Service Market Size, (US$ Million), 2021 vs 2025 vs 2032
Figure 24. Global Medical Express Service Market Share by Region: 2025 vs 2032
Figure 25. Global Medical Express Service Market Share by Players in 2025
Figure 26. Global Medical Express Service Market Share by Company Type (Tier 1, Tier 2, and Tier 3)
Figure 27. The Top 10 and 5 Players Market Share by Medical Express Service Revenue in 2025
Figure 28. North America Medical Express Service Market Size YoY Growth (US$ Million), 2021–2032
Figure 29. North America Medical Express Service Market Share by Country (2021–2032)
Figure 30. United States Medical Express Service Market Size YoY Growth (US$ Million), 2021–2032
Figure 31. Canada Medical Express Service Market Size YoY Growth (US$ Million), 2021–2032
Figure 32. Europe Medical Express Service Market Size YoY Growth (US$ Million), 2021–2032
Figure 33. Europe Medical Express Service Market Share by Country (2021–2032)
Figure 34. Germany Medical Express Service Market Size YoY Growth (US$ Million), 2021–2032
Figure 35. France Medical Express Service Market Size YoY Growth (US$ Million), 2021–2032
Figure 36. U.K. Medical Express Service Market Size YoY Growth (US$ Million), 2021–2032
Figure 37. Italy Medical Express Service Market Size YoY Growth (US$ Million), 2021–2032
Figure 38. Russia Medical Express Service Market Size YoY Growth (US$ Million), 2021–2032
Figure 39. Ireland Medical Express Service Market Size YoY Growth (US$ Million), 2021–2032
Figure 40. Asia-Pacific Medical Express Service Market Size YoY Growth (US$ Million), 2021–2032
Figure 41. Asia-Pacific Medical Express Service Market Share by Region (2021–2032)
Figure 42. China Medical Express Service Market Size YoY Growth (US$ Million), 2021–2032
Figure 43. Japan Medical Express Service Market Size YoY Growth (US$ Million), 2021–2032
Figure 44. South Korea Medical Express Service Market Size YoY Growth (US$ Million), 2021–2032
Figure 45. Southeast Asia Medical Express Service Market Size YoY Growth (US$ Million), 2021–2032
Figure 46. India Medical Express Service Market Size YoY Growth (US$ Million), 2021–2032
Figure 47. Australia & New Zealand Medical Express Service Market Size YoY Growth (US$ Million), 2021–2032
Figure 48. Latin America Medical Express Service Market Size YoY Growth (US$ Million), 2021–2032
Figure 49. Latin America Medical Express Service Market Share by Country (2021–2032)
Figure 50. Mexico Medical Express Service Market Size YoY Growth (US$ Million), 2021–2032
Figure 51. Brazil Medical Express Service Market Size YoY Growth (US$ Million), 2021–2032
Figure 52. Middle East & Africa Medical Express Service Market Size YoY Growth (US$ Million), 2021–2032
Figure 53. Middle East & Africa Medical Express Service Market Share by Country (2021–2032)
Figure 54. Israel Medical Express Service Market Size YoY Growth (US$ Million), 2021–2032
Figure 55. Saudi Arabia Medical Express Service Market Size YoY Growth (US$ Million), 2021–2032
Figure 56. UAE Medical Express Service Market Size YoY Growth (US$ Million), 2021–2032
Figure 57. DHL Revenue Growth Rate in Medical Express Service Business (2021–2026)
Figure 58. UPS Revenue Growth Rate in Medical Express Service Business (2021–2026)
Figure 59. LogistiCare Revenue Growth Rate in Medical Express Service Business (2021–2026)
Figure 60. FedEx Revenue Growth Rate in Medical Express Service Business (2021–2026)
Figure 61. CEVA Logistics Revenue Growth Rate in Medical Express Service Business (2021–2026)
Figure 62. International SOS Revenue Growth Rate in Medical Express Service Business (2021–2026)
Figure 63. Matternet Revenue Growth Rate in Medical Express Service Business (2021–2026)
Figure 64. Zipline Revenue Growth Rate in Medical Express Service Business (2021–2026)
Figure 65. Swoop Aero Revenue Growth Rate in Medical Express Service Business (2021–2026)
Figure 66. Flirtey Revenue Growth Rate in Medical Express Service Business (2021–2026)
Figure 67. Dachser Revenue Growth Rate in Medical Express Service Business (2021–2026)
Figure 68. Maersk Revenue Growth Rate in Medical Express Service Business (2021–2026)
Figure 69. Samsung SDS Revenue Growth Rate in Medical Express Service Business (2021–2026)
Figure 70. JD Logistics Revenue Growth Rate in Medical Express Service Business (2021–2026)
Figure 71. S.F.Express Revenue Growth Rate in Medical Express Service Business (2021–2026)
Figure 72. Debon Express Revenue Growth Rate in Medical Express Service Business (2021–2026)
Figure 73. GoShare Revenue Growth Rate in Medical Express Service Business (2021–2026)
Figure 74. Rapidus Revenue Growth Rate in Medical Express Service Business (2021–2026)
Figure 75. AC - Associated Couriers Revenue Growth Rate in Medical Express Service Business (2021–2026)
Figure 76. Dropoff Revenue Growth Rate in Medical Express Service Business (2021–2026)
Figure 77. Couriers Texas Revenue Growth Rate in Medical Express Service Business (2021–2026)
Figure 78. Bungii Revenue Growth Rate in Medical Express Service Business (2021–2026)
Figure 79. Econo-Courier Revenue Growth Rate in Medical Express Service Business (2021–2026)
Figure 80. MCI Revenue Growth Rate in Medical Express Service Business (2021–2026)
Figure 81. Diligent Revenue Growth Rate in Medical Express Service Business (2021–2026)
Figure 82. Road Flex Delivery Revenue Growth Rate in Medical Express Service Business (2021–2026)
Figure 83. Raven Force Courier Revenue Growth Rate in Medical Express Service Business (2021–2026)
Figure 84. NoCo Transporter Revenue Growth Rate in Medical Express Service Business (2021–2026)
Figure 85. CharmMedical Revenue Growth Rate in Medical Express Service Business (2021–2026)
Figure 86. Purolator Revenue Growth Rate in Medical Express Service Business (2021–2026)
Figure 87. Bottom-up and Top-down Approaches for This Report
Figure 88. Data Triangulation
Figure 89. Key Executives Interviewed