List of Tables
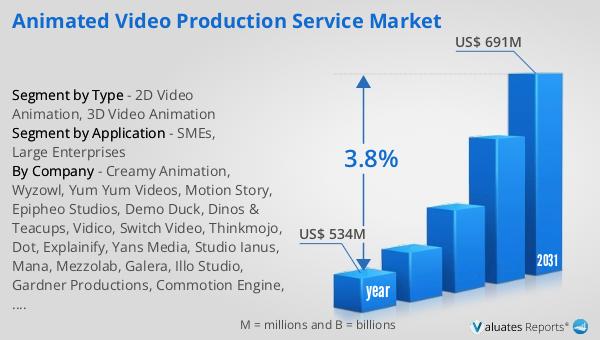
Table 1. Global Animated Video Production Service Market Size Growth Rate by Type (US$ Million): 2020 VS 2024 VS 2031
Table 2. Key Players of 2D Video Animation
Table 3. Key Players of 3D Video Animation
Table 4. Global Animated Video Production Service Market Size Growth by Application (US$ Million): 2020 VS 2024 VS 2031
Table 5. Global Animated Video Production Service Market Size by Region (US$ Million): 2020 VS 2024 VS 2031
Table 6. Global Animated Video Production Service Market Size by Region (2020-2025) & (US$ Million)
Table 7. Global Animated Video Production Service Market Share by Region (2020-2025)
Table 8. Global Animated Video Production Service Forecasted Market Size by Region (2026-2031) & (US$ Million)
Table 9. Global Animated Video Production Service Market Share by Region (2026-2031)
Table 10. Animated Video Production Service Market Trends
Table 11. Animated Video Production Service Market Drivers
Table 12. Animated Video Production Service Market Challenges
Table 13. Animated Video Production Service Market Restraints
Table 14. Global Animated Video Production Service Revenue by Players (2020-2025) & (US$ Million)
Table 15. Global Animated Video Production Service Market Share by Players (2020-2025)
Table 16. Global Top Animated Video Production Service Players by Company Type (Tier 1, Tier 2, and Tier 3) & (based on the Revenue in Animated Video Production Service as of 2024)
Table 17. Ranking of Global Top Animated Video Production Service Companies by Revenue (US$ Million) in 2024
Table 18. Global 5 Largest Players Market Share by Animated Video Production Service Revenue (CR5 and HHI) & (2020-2025)
Table 19. Global Key Players of Animated Video Production Service, Headquarters and Area Served
Table 20. Global Key Players of Animated Video Production Service, Product and Application
Table 21. Global Key Players of Animated Video Production Service, Date of Enter into This Industry
Table 22. Mergers & Acquisitions, Expansion Plans
Table 23. Global Animated Video Production Service Market Size by Type (2020-2025) & (US$ Million)
Table 24. Global Animated Video Production Service Revenue Market Share by Type (2020-2025)
Table 25. Global Animated Video Production Service Forecasted Market Size by Type (2026-2031) & (US$ Million)
Table 26. Global Animated Video Production Service Revenue Market Share by Type (2026-2031)
Table 27. Global Animated Video Production Service Market Size by Application (2020-2025) & (US$ Million)
Table 28. Global Animated Video Production Service Revenue Market Share by Application (2020-2025)
Table 29. Global Animated Video Production Service Forecasted Market Size by Application (2026-2031) & (US$ Million)
Table 30. Global Animated Video Production Service Revenue Market Share by Application (2026-2031)
Table 31. North America Animated Video Production Service Market Size Growth Rate by Country (US$ Million): 2020 VS 2024 VS 2031
Table 32. North America Animated Video Production Service Market Size by Country (2020-2025) & (US$ Million)
Table 33. North America Animated Video Production Service Market Size by Country (2026-2031) & (US$ Million)
Table 34. Europe Animated Video Production Service Market Size Growth Rate by Country (US$ Million): 2020 VS 2024 VS 2031
Table 35. Europe Animated Video Production Service Market Size by Country (2020-2025) & (US$ Million)
Table 36. Europe Animated Video Production Service Market Size by Country (2026-2031) & (US$ Million)
Table 37. Asia-Pacific Animated Video Production Service Market Size Growth Rate by Region (US$ Million): 2020 VS 2024 VS 2031
Table 38. Asia-Pacific Animated Video Production Service Market Size by Region (2020-2025) & (US$ Million)
Table 39. Asia-Pacific Animated Video Production Service Market Size by Region (2026-2031) & (US$ Million)
Table 40. Latin America Animated Video Production Service Market Size Growth Rate by Country (US$ Million): 2020 VS 2024 VS 2031
Table 41. Latin America Animated Video Production Service Market Size by Country (2020-2025) & (US$ Million)
Table 42. Latin America Animated Video Production Service Market Size by Country (2026-2031) & (US$ Million)
Table 43. Middle East & Africa Animated Video Production Service Market Size Growth Rate by Country (US$ Million): 2020 VS 2024 VS 2031
Table 44. Middle East & Africa Animated Video Production Service Market Size by Country (2020-2025) & (US$ Million)
Table 45. Middle East & Africa Animated Video Production Service Market Size by Country (2026-2031) & (US$ Million)
Table 46. Creamy Animation Company Details
Table 47. Creamy Animation Business Overview
Table 48. Creamy Animation Animated Video Production Service Product
Table 49. Creamy Animation Revenue in Animated Video Production Service Business (2020-2025) & (US$ Million)
Table 50. Creamy Animation Recent Development
Table 51. Wyzowl Company Details
Table 52. Wyzowl Business Overview
Table 53. Wyzowl Animated Video Production Service Product
Table 54. Wyzowl Revenue in Animated Video Production Service Business (2020-2025) & (US$ Million)
Table 55. Wyzowl Recent Development
Table 56. Yum Yum Videos Company Details
Table 57. Yum Yum Videos Business Overview
Table 58. Yum Yum Videos Animated Video Production Service Product
Table 59. Yum Yum Videos Revenue in Animated Video Production Service Business (2020-2025) & (US$ Million)
Table 60. Yum Yum Videos Recent Development
Table 61. Motion Story Company Details
Table 62. Motion Story Business Overview
Table 63. Motion Story Animated Video Production Service Product
Table 64. Motion Story Revenue in Animated Video Production Service Business (2020-2025) & (US$ Million)
Table 65. Motion Story Recent Development
Table 66. Epipheo Studios Company Details
Table 67. Epipheo Studios Business Overview
Table 68. Epipheo Studios Animated Video Production Service Product
Table 69. Epipheo Studios Revenue in Animated Video Production Service Business (2020-2025) & (US$ Million)
Table 70. Epipheo Studios Recent Development
Table 71. Demo Duck Company Details
Table 72. Demo Duck Business Overview
Table 73. Demo Duck Animated Video Production Service Product
Table 74. Demo Duck Revenue in Animated Video Production Service Business (2020-2025) & (US$ Million)
Table 75. Demo Duck Recent Development
Table 76. Dinos & Teacups Company Details
Table 77. Dinos & Teacups Business Overview
Table 78. Dinos & Teacups Animated Video Production Service Product
Table 79. Dinos & Teacups Revenue in Animated Video Production Service Business (2020-2025) & (US$ Million)
Table 80. Dinos & Teacups Recent Development
Table 81. Vidico Company Details
Table 82. Vidico Business Overview
Table 83. Vidico Animated Video Production Service Product
Table 84. Vidico Revenue in Animated Video Production Service Business (2020-2025) & (US$ Million)
Table 85. Vidico Recent Development
Table 86. Switch Video Company Details
Table 87. Switch Video Business Overview
Table 88. Switch Video Animated Video Production Service Product
Table 89. Switch Video Revenue in Animated Video Production Service Business (2020-2025) & (US$ Million)
Table 90. Switch Video Recent Development
Table 91. Thinkmojo Company Details
Table 92. Thinkmojo Business Overview
Table 93. Thinkmojo Animated Video Production Service Product
Table 94. Thinkmojo Revenue in Animated Video Production Service Business (2020-2025) & (US$ Million)
Table 95. Thinkmojo Recent Development
Table 96. Dot Company Details
Table 97. Dot Business Overview
Table 98. Dot Animated Video Production Service Product
Table 99. Dot Revenue in Animated Video Production Service Business (2020-2025) & (US$ Million)
Table 100. Dot Recent Development
Table 101. Explainify Company Details
Table 102. Explainify Business Overview
Table 103. Explainify Animated Video Production Service Product
Table 104. Explainify Revenue in Animated Video Production Service Business (2020-2025) & (US$ Million)
Table 105. Explainify Recent Development
Table 106. Yans Media Company Details
Table 107. Yans Media Business Overview
Table 108. Yans Media Animated Video Production Service Product
Table 109. Yans Media Revenue in Animated Video Production Service Business (2020-2025) & (US$ Million)
Table 110. Yans Media Recent Development
Table 111. Studio Ianus Company Details
Table 112. Studio Ianus Business Overview
Table 113. Studio Ianus Animated Video Production Service Product
Table 114. Studio Ianus Revenue in Animated Video Production Service Business (2020-2025) & (US$ Million)
Table 115. Studio Ianus Recent Development
Table 116. Mana Company Details
Table 117. Mana Business Overview
Table 118. Mana Animated Video Production Service Product
Table 119. Mana Revenue in Animated Video Production Service Business (2020-2025) & (US$ Million)
Table 120. Mana Recent Development
Table 121. Mezzolab Company Details
Table 122. Mezzolab Business Overview
Table 123. Mezzolab Animated Video Production Service Product
Table 124. Mezzolab Revenue in Animated Video Production Service Business (2020-2025) & (US$ Million)
Table 125. Mezzolab Recent Development
Table 126. Galera Company Details
Table 127. Galera Business Overview
Table 128. Galera Animated Video Production Service Product
Table 129. Galera Revenue in Animated Video Production Service Business (2020-2025) & (US$ Million)
Table 130. Galera Recent Development
Table 131. Illo Studio Company Details
Table 132. Illo Studio Business Overview
Table 133. Illo Studio Animated Video Production Service Product
Table 134. Illo Studio Revenue in Animated Video Production Service Business (2020-2025) & (US$ Million)
Table 135. Illo Studio Recent Development
Table 136. Gardner Productions Company Details
Table 137. Gardner Productions Business Overview
Table 138. Gardner Productions Animated Video Production Service Product
Table 139. Gardner Productions Revenue in Animated Video Production Service Business (2020-2025) & (US$ Million)
Table 140. Gardner Productions Recent Development
Table 141. Commotion Engine Company Details
Table 142. Commotion Engine Business Overview
Table 143. Commotion Engine Animated Video Production Service Product
Table 144. Commotion Engine Revenue in Animated Video Production Service Business (2020-2025) & (US$ Million)
Table 145. Commotion Engine Recent Development
Table 146. Very True Story Company Details
Table 147. Very True Story Business Overview
Table 148. Very True Story Animated Video Production Service Product
Table 149. Very True Story Revenue in Animated Video Production Service Business (2020-2025) & (US$ Million)
Table 150. Very True Story Recent Development
Table 151. Kyro Digital Company Details
Table 152. Kyro Digital Business Overview
Table 153. Kyro Digital Animated Video Production Service Product
Table 154. Kyro Digital Revenue in Animated Video Production Service Business (2020-2025) & (US$ Million)
Table 155. Kyro Digital Recent Development
Table 156. Alconost Company Details
Table 157. Alconost Business Overview
Table 158. Alconost Animated Video Production Service Product
Table 159. Alconost Revenue in Animated Video Production Service Business (2020-2025) & (US$ Million)
Table 160. Alconost Recent Development
Table 161. Skeleton Company Details
Table 162. Skeleton Business Overview
Table 163. Skeleton Animated Video Production Service Product
Table 164. Skeleton Revenue in Animated Video Production Service Business (2020-2025) & (US$ Million)
Table 165. Skeleton Recent Development
Table 166. Research Programs/Design for This Report
Table 167. Key Data Information from Secondary Sources
Table 168. Key Data Information from Primary Sources
Table 169. Authors List of This Report
List of Figures
Figure 1. Animated Video Production Service Picture
Figure 2. Global Animated Video Production Service Market Size Comparison by Type (2020-2031) & (US$ Million)
Figure 3. Global Animated Video Production Service Market Share by Type: 2024 VS 2031
Figure 4. 2D Video Animation Features
Figure 5. 3D Video Animation Features
Figure 6. Global Animated Video Production Service Market Size by Application (2020-2031) & (US$ Million)
Figure 7. Global Animated Video Production Service Market Share by Application: 2024 VS 2031
Figure 8. SMEs Case Studies
Figure 9. Large Enterprises Case Studies
Figure 10. Animated Video Production Service Report Years Considered
Figure 11. Global Animated Video Production Service Market Size (US$ Million), Year-over-Year: 2020-2031
Figure 12. Global Animated Video Production Service Market Size, (US$ Million), 2020 VS 2024 VS 2031
Figure 13. Global Animated Video Production Service Market Share by Region: 2024 VS 2031
Figure 14. Global Animated Video Production Service Market Share by Players in 2024
Figure 15. Global Top Animated Video Production Service Players by Company Type (Tier 1, Tier 2, and Tier 3) & (based on the Revenue in Animated Video Production Service as of 2024)
Figure 16. The Top 10 and 5 Players Market Share by Animated Video Production Service Revenue in 2024
Figure 17. North America Animated Video Production Service Market Size YoY Growth (2020-2031) & (US$ Million)
Figure 18. North America Animated Video Production Service Market Share by Country (2020-2031)
Figure 19. United States Animated Video Production Service Market Size YoY Growth (2020-2031) & (US$ Million)
Figure 20. Canada Animated Video Production Service Market Size YoY Growth (2020-2031) & (US$ Million)
Figure 21. Europe Animated Video Production Service Market Size YoY Growth (2020-2031) & (US$ Million)
Figure 22. Europe Animated Video Production Service Market Share by Country (2020-2031)
Figure 23. Germany Animated Video Production Service Market Size YoY Growth (2020-2031) & (US$ Million)
Figure 24. France Animated Video Production Service Market Size YoY Growth (2020-2031) & (US$ Million)
Figure 25. U.K. Animated Video Production Service Market Size YoY Growth (2020-2031) & (US$ Million)
Figure 26. Italy Animated Video Production Service Market Size YoY Growth (2020-2031) & (US$ Million)
Figure 27. Russia Animated Video Production Service Market Size YoY Growth (2020-2031) & (US$ Million)
Figure 28. Nordic Countries Animated Video Production Service Market Size YoY Growth (2020-2031) & (US$ Million)
Figure 29. Asia-Pacific Animated Video Production Service Market Size YoY Growth (2020-2031) & (US$ Million)
Figure 30. Asia-Pacific Animated Video Production Service Market Share by Region (2020-2031)
Figure 31. China Animated Video Production Service Market Size YoY Growth (2020-2031) & (US$ Million)
Figure 32. Japan Animated Video Production Service Market Size YoY Growth (2020-2031) & (US$ Million)
Figure 33. South Korea Animated Video Production Service Market Size YoY Growth (2020-2031) & (US$ Million)
Figure 34. Southeast Asia Animated Video Production Service Market Size YoY Growth (2020-2031) & (US$ Million)
Figure 35. India Animated Video Production Service Market Size YoY Growth (2020-2031) & (US$ Million)
Figure 36. Australia Animated Video Production Service Market Size YoY Growth (2020-2031) & (US$ Million)
Figure 37. Latin America Animated Video Production Service Market Size YoY Growth (2020-2031) & (US$ Million)
Figure 38. Latin America Animated Video Production Service Market Share by Country (2020-2031)
Figure 39. Mexico Animated Video Production Service Market Size YoY Growth (2020-2031) & (US$ Million)
Figure 40. Brazil Animated Video Production Service Market Size YoY Growth (2020-2031) & (US$ Million)
Figure 41. Middle East & Africa Animated Video Production Service Market Size YoY Growth (2020-2031) & (US$ Million)
Figure 42. Middle East & Africa Animated Video Production Service Market Share by Country (2020-2031)
Figure 43. Turkey Animated Video Production Service Market Size YoY Growth (2020-2031) & (US$ Million)
Figure 44. Saudi Arabia Animated Video Production Service Market Size YoY Growth (2020-2031) & (US$ Million)
Figure 45. UAE Animated Video Production Service Market Size YoY Growth (2020-2031) & (US$ Million)
Figure 46. Creamy Animation Revenue Growth Rate in Animated Video Production Service Business (2020-2025)
Figure 47. Wyzowl Revenue Growth Rate in Animated Video Production Service Business (2020-2025)
Figure 48. Yum Yum Videos Revenue Growth Rate in Animated Video Production Service Business (2020-2025)
Figure 49. Motion Story Revenue Growth Rate in Animated Video Production Service Business (2020-2025)
Figure 50. Epipheo Studios Revenue Growth Rate in Animated Video Production Service Business (2020-2025)
Figure 51. Demo Duck Revenue Growth Rate in Animated Video Production Service Business (2020-2025)
Figure 52. Dinos & Teacups Revenue Growth Rate in Animated Video Production Service Business (2020-2025)
Figure 53. Vidico Revenue Growth Rate in Animated Video Production Service Business (2020-2025)
Figure 54. Switch Video Revenue Growth Rate in Animated Video Production Service Business (2020-2025)
Figure 55. Thinkmojo Revenue Growth Rate in Animated Video Production Service Business (2020-2025)
Figure 56. Dot Revenue Growth Rate in Animated Video Production Service Business (2020-2025)
Figure 57. Explainify Revenue Growth Rate in Animated Video Production Service Business (2020-2025)
Figure 58. Yans Media Revenue Growth Rate in Animated Video Production Service Business (2020-2025)
Figure 59. Studio Ianus Revenue Growth Rate in Animated Video Production Service Business (2020-2025)
Figure 60. Mana Revenue Growth Rate in Animated Video Production Service Business (2020-2025)
Figure 61. Mezzolab Revenue Growth Rate in Animated Video Production Service Business (2020-2025)
Figure 62. Galera Revenue Growth Rate in Animated Video Production Service Business (2020-2025)
Figure 63. Illo Studio Revenue Growth Rate in Animated Video Production Service Business (2020-2025)
Figure 64. Gardner Productions Revenue Growth Rate in Animated Video Production Service Business (2020-2025)
Figure 65. Commotion Engine Revenue Growth Rate in Animated Video Production Service Business (2020-2025)
Figure 66. Very True Story Revenue Growth Rate in Animated Video Production Service Business (2020-2025)
Figure 67. Kyro Digital Revenue Growth Rate in Animated Video Production Service Business (2020-2025)
Figure 68. Alconost Revenue Growth Rate in Animated Video Production Service Business (2020-2025)
Figure 69. Skeleton Revenue Growth Rate in Animated Video Production Service Business (2020-2025)
Figure 70. Bottom-up and Top-down Approaches for This Report
Figure 71. Data Triangulation
Figure 72. Key Executives Interviewed