List of Tables
Table 1. Global Bio-based Vitamins Market Value Comparison by Type (2024-2030) & (US$ Million)
Table 2. Global Bio-based Vitamins Market Value Comparison by Application (2024-2030) & (US$ Million)
Table 3. Global Bio-based Vitamins Market Competitive Situation by Manufacturers in 2023
Table 4. Global Bio-based Vitamins Sales (Kg) of Key Manufacturers (2019-2024)
Table 5. Global Bio-based Vitamins Sales Market Share by Manufacturers (2019-2024)
Table 6. Global Bio-based Vitamins Revenue (US$ Million) by Manufacturers (2019-2024)
Table 7. Global Bio-based Vitamins Revenue Share by Manufacturers (2019-2024)
Table 8. Global Market Bio-based Vitamins Average Price (US$/Kg) of Key Manufacturers (2019-2024)
Table 9. Global Key Players of Bio-based Vitamins, Industry Ranking, 2022 VS 2023 VS 2024
Table 10. Global Key Manufacturers of Bio-based Vitamins, Manufacturing Sites & Headquarters
Table 11. Global Key Manufacturers of Bio-based Vitamins, Product Type & Application
Table 12. Global Key Manufacturers of Bio-based Vitamins, Date of Enter into This Industry
Table 13. Global Manufacturers Market Concentration Ratio (CR5 and HHI)
Table 14. Global Bio-based Vitamins by Company Type (Tier 1, Tier 2, and Tier 3) & (based on the Revenue in Bio-based Vitamins as of 2023)
Table 15. Manufacturers Mergers & Acquisitions, Expansion Plans
Table 16. Global Bio-based Vitamins Market Size by Region (US$ Million): 2019 VS 2023 VS 2030
Table 17. Global Bio-based Vitamins Sales by Region (2019-2024) & (Kg)
Table 18. Global Bio-based Vitamins Sales Market Share by Region (2019-2024)
Table 19. Global Bio-based Vitamins Sales by Region (2025-2030) & (Kg)
Table 20. Global Bio-based Vitamins Sales Market Share by Region (2025-2030)
Table 21. Global Bio-based Vitamins Revenue by Region (2019-2024) & (US$ Million)
Table 22. Global Bio-based Vitamins Revenue Market Share by Region (2019-2024)
Table 23. Global Bio-based Vitamins Revenue by Region (2025-2030) & (US$ Million)
Table 24. Global Bio-based Vitamins Revenue Market Share by Region (2025-2030)
Table 25. North America Bio-based Vitamins Revenue by Country: 2019 VS 2023 VS 2030 (US$ Million)
Table 26. North America Bio-based Vitamins Sales by Country (2019-2024) & (Kg)
Table 27. North America Bio-based Vitamins Sales by Country (2025-2030) & (Kg)
Table 28. North America Bio-based Vitamins Revenue by Country (2019-2024) & (US$ Million)
Table 29. North America Bio-based Vitamins Revenue by Country (2025-2030) & (US$ Million)
Table 30. Europe Bio-based Vitamins Revenue by Country: 2019 VS 2023 VS 2030 (US$ Million)
Table 31. Europe Bio-based Vitamins Sales by Country (2019-2024) & (Kg)
Table 32. Europe Bio-based Vitamins Sales by Country (2025-2030) & (Kg)
Table 33. Europe Bio-based Vitamins Revenue by Country (2019-2024) & (US$ Million)
Table 34. Europe Bio-based Vitamins Revenue by Country (2025-2030) & (US$ Million)
Table 35. Asia Pacific Bio-based Vitamins Revenue by Region: 2019 VS 2023 VS 2030 (US$ Million)
Table 36. Asia Pacific Bio-based Vitamins Sales by Region (2019-2024) & (Kg)
Table 37. Asia Pacific Bio-based Vitamins Sales by Region (2025-2030) & (Kg)
Table 38. Asia Pacific Bio-based Vitamins Revenue by Region (2019-2024) & (US$ Million)
Table 39. Asia Pacific Bio-based Vitamins Revenue by Region (2025-2030) & (US$ Million)
Table 40. Latin America Bio-based Vitamins Revenue by Country: 2019 VS 2023 VS 2030 (US$ Million)
Table 41. Latin America Bio-based Vitamins Sales by Country (2019-2024) & (Kg)
Table 42. Latin America Bio-based Vitamins Sales by Country (2025-2030) & (Kg)
Table 43. Latin America Bio-based Vitamins Revenue by Country (2019-2024) & (US$ Million)
Table 44. Latin America Bio-based Vitamins Revenue by Country (2025-2030) & (US$ Million)
Table 45. Middle East & Africa Bio-based Vitamins Revenue by Country: 2019 VS 2023 VS 2030 (US$ Million)
Table 46. Middle East & Africa Bio-based Vitamins Sales by Country (2019-2024) & (Kg)
Table 47. Middle East & Africa Bio-based Vitamins Sales by Country (2025-2030) & (Kg)
Table 48. Middle East & Africa Bio-based Vitamins Revenue by Country (2019-2024) & (US$ Million)
Table 49. Middle East & Africa Bio-based Vitamins Revenue by Country (2025-2030) & (US$ Million)
Table 50. Global Bio-based Vitamins Sales (Kg) by Type (2019-2024)
Table 51. Global Bio-based Vitamins Sales (Kg) by Type (2025-2030)
Table 52. Global Bio-based Vitamins Sales Market Share by Type (2019-2024)
Table 53. Global Bio-based Vitamins Sales Market Share by Type (2025-2030)
Table 54. Global Bio-based Vitamins Revenue (US$ Million) by Type (2019-2024)
Table 55. Global Bio-based Vitamins Revenue (US$ Million) by Type (2025-2030)
Table 56. Global Bio-based Vitamins Revenue Market Share by Type (2019-2024)
Table 57. Global Bio-based Vitamins Revenue Market Share by Type (2025-2030)
Table 58. Global Bio-based Vitamins Price (US$/Kg) by Type (2019-2024)
Table 59. Global Bio-based Vitamins Price (US$/Kg) by Type (2025-2030)
Table 60. Global Bio-based Vitamins Sales (Kg) by Application (2019-2024)
Table 61. Global Bio-based Vitamins Sales (Kg) by Application (2025-2030)
Table 62. Global Bio-based Vitamins Sales Market Share by Application (2019-2024)
Table 63. Global Bio-based Vitamins Sales Market Share by Application (2025-2030)
Table 64. Global Bio-based Vitamins Revenue (US$ Million) by Application (2019-2024)
Table 65. Global Bio-based Vitamins Revenue (US$ Million) by Application (2025-2030)
Table 66. Global Bio-based Vitamins Revenue Market Share by Application (2019-2024)
Table 67. Global Bio-based Vitamins Revenue Market Share by Application (2025-2030)
Table 68. Global Bio-based Vitamins Price (US$/Kg) by Application (2019-2024)
Table 69. Global Bio-based Vitamins Price (US$/Kg) by Application (2025-2030)
Table 70. DSM Corporation Information
Table 71. DSM Description and Business Overview
Table 72. DSM Bio-based Vitamins Sales (Kg), Revenue (US$ Million), Price (US$/Kg) and Gross Margin (2019-2024)
Table 73. DSM Bio-based Vitamins Product
Table 74. DSM Recent Developments/Updates
Table 75. BASF Corporation Information
Table 76. BASF Description and Business Overview
Table 77. BASF Bio-based Vitamins Sales (Kg), Revenue (US$ Million), Price (US$/Kg) and Gross Margin (2019-2024)
Table 78. BASF Bio-based Vitamins Product
Table 79. BASF Recent Developments/Updates
Table 80. Biosyntia Corporation Information
Table 81. Biosyntia Description and Business Overview
Table 82. Biosyntia Bio-based Vitamins Sales (Kg), Revenue (US$ Million), Price (US$/Kg) and Gross Margin (2019-2024)
Table 83. Biosyntia Bio-based Vitamins Product
Table 84. Biosyntia Recent Developments/Updates
Table 85. Key Raw Materials Lists
Table 86. Raw Materials Key Suppliers Lists
Table 87. Bio-based Vitamins Distributors List
Table 88. Bio-based Vitamins Customers List
Table 89. Bio-based Vitamins Market Trends
Table 90. Bio-based Vitamins Market Drivers
Table 91. Bio-based Vitamins Market Challenges
Table 92. Bio-based Vitamins Market Restraints
Table 93. Research Programs/Design for This Report
Table 94. Key Data Information from Secondary Sources
Table 95. Key Data Information from Primary Sources
List of Figures
Figure 1. Product Picture of Bio-based Vitamins
Figure 2. Global Bio-based Vitamins Market Value Comparison by Type (2024-2030) & (US$ Million)
Figure 3. Global Bio-based Vitamins Market Share by Type in 2023 & 2030
Figure 4. Vitamin A Product Picture
Figure 5. Vitamin B Product Picture
Figure 6. Vitamin E Product Picture
Figure 7. Global Bio-based Vitamins Market Value Comparison by Application (2024-2030) & (US$ Million)
Figure 8. Global Bio-based Vitamins Market Share by Application in 2023 & 2030
Figure 9. Cosmetics
Figure 10. Pharmaceutical
Figure 11. Health Care Products
Figure 12. Animal Feed
Figure 13. Others
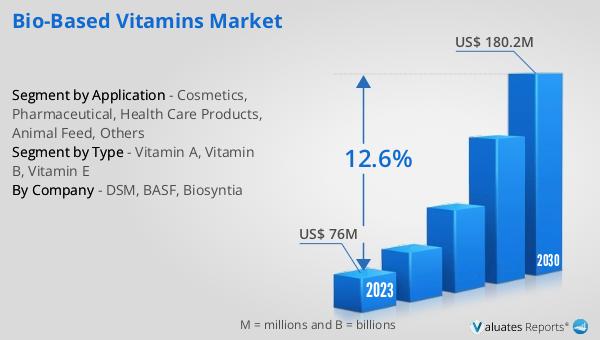
Figure 14. Global Bio-based Vitamins Revenue, (US$ Million), 2019 VS 2023 VS 2030
Figure 15. Global Bio-based Vitamins Market Size (2019-2030) & (US$ Million)
Figure 16. Global Bio-based Vitamins Sales (2019-2030) & (Kg)
Figure 17. Global Bio-based Vitamins Average Price (US$/Kg) & (2019-2030)
Figure 18. Bio-based Vitamins Report Years Considered
Figure 19. Bio-based Vitamins Sales Share by Manufacturers in 2023
Figure 20. Global Bio-based Vitamins Revenue Share by Manufacturers in 2023
Figure 21. The Global 5 and 10 Largest Bio-based Vitamins Players: Market Share by Revenue in 2023
Figure 22. Bio-based Vitamins Market Share by Company Type (Tier 1, Tier 2 and Tier 3): 2019 VS 2023
Figure 23. Global Bio-based Vitamins Market Size by Region (US$ Million): 2019 VS 2023 VS 2030
Figure 24. North America Bio-based Vitamins Sales Market Share by Country (2019-2030)
Figure 25. North America Bio-based Vitamins Revenue Market Share by Country (2019-2030)
Figure 26. United States Bio-based Vitamins Revenue Growth Rate (2019-2030) & (US$ Million)
Figure 27. Canada Bio-based Vitamins Revenue Growth Rate (2019-2030) & (US$ Million)
Figure 28. Europe Bio-based Vitamins Sales Market Share by Country (2019-2030)
Figure 29. Europe Bio-based Vitamins Revenue Market Share by Country (2019-2030)
Figure 30. Germany Bio-based Vitamins Revenue Growth Rate (2019-2030) & (US$ Million)
Figure 31. France Bio-based Vitamins Revenue Growth Rate (2019-2030) & (US$ Million)
Figure 32. U.K. Bio-based Vitamins Revenue Growth Rate (2019-2030) & (US$ Million)
Figure 33. Italy Bio-based Vitamins Revenue Growth Rate (2019-2030) & (US$ Million)
Figure 34. Russia Bio-based Vitamins Revenue Growth Rate (2019-2030) & (US$ Million)
Figure 35. Asia Pacific Bio-based Vitamins Sales Market Share by Region (2019-2030)
Figure 36. Asia Pacific Bio-based Vitamins Revenue Market Share by Region (2019-2030)
Figure 37. China Bio-based Vitamins Revenue Growth Rate (2019-2030) & (US$ Million)
Figure 38. Japan Bio-based Vitamins Revenue Growth Rate (2019-2030) & (US$ Million)
Figure 39. South Korea Bio-based Vitamins Revenue Growth Rate (2019-2030) & (US$ Million)
Figure 40. India Bio-based Vitamins Revenue Growth Rate (2019-2030) & (US$ Million)
Figure 41. Australia Bio-based Vitamins Revenue Growth Rate (2019-2030) & (US$ Million)
Figure 42. China Taiwan Bio-based Vitamins Revenue Growth Rate (2019-2030) & (US$ Million)
Figure 43. Southeast Asia Bio-based Vitamins Revenue Growth Rate (2019-2030) & (US$ Million)
Figure 44. Latin America Bio-based Vitamins Sales Market Share by Country (2019-2030)
Figure 45. Latin America Bio-based Vitamins Revenue Market Share by Country (2019-2030)
Figure 46. Mexico Bio-based Vitamins Revenue Growth Rate (2019-2030) & (US$ Million)
Figure 47. Brazil Bio-based Vitamins Revenue Growth Rate (2019-2030) & (US$ Million)
Figure 48. Argentina Bio-based Vitamins Revenue Growth Rate (2019-2030) & (US$ Million)
Figure 49. Middle East & Africa Bio-based Vitamins Sales Market Share by Country (2019-2030)
Figure 50. Middle East & Africa Bio-based Vitamins Revenue Market Share by Country (2019-2030)
Figure 51. Turkey Bio-based Vitamins Revenue Growth Rate (2019-2030) & (US$ Million)
Figure 52. Saudi Arabia Bio-based Vitamins Revenue Growth Rate (2019-2030) & (US$ Million)
Figure 53. UAE Bio-based Vitamins Revenue Growth Rate (2019-2030) & (US$ Million)
Figure 54. Global Sales Market Share of Bio-based Vitamins by Type (2019-2030)
Figure 55. Global Revenue Market Share of Bio-based Vitamins by Type (2019-2030)
Figure 56. Global Bio-based Vitamins Price (US$/Kg) by Type (2019-2030)
Figure 57. Global Sales Market Share of Bio-based Vitamins by Application (2019-2030)
Figure 58. Global Revenue Market Share of Bio-based Vitamins by Application (2019-2030)
Figure 59. Global Bio-based Vitamins Price (US$/Kg) by Application (2019-2030)
Figure 60. Bio-based Vitamins Value Chain
Figure 61. Bio-based Vitamins Production Process
Figure 62. Channels of Distribution (Direct Vs Distribution)
Figure 63. Distributors Profiles
Figure 64. Bottom-up and Top-down Approaches for This Report
Figure 65. Data Triangulation
Figure 66. Key Executives Interviewed