List of Tables
Table 1. Global Peptide Modification Service Market Size Growth Rate by Type (US$ Million): 2020 VS 2024 VS 2031
Table 2. Key Players of N-Terminal Modifications
Table 3. Key Players of C-Terminal Modifications
Table 4. Key Players of Fluorescence Dye Labeling
Table 5. Key Players of Phosphorylation
Table 6. Key Players of Others
Table 7. Global Peptide Modification Service Market Size Growth Rate by Modification Purpose/Function (US$ Million): 2020 VS 2024 VS 2031
Table 8. Key Players of Stability Optimization (amidation, cyclization, PEGylation)
Table 9. Key Players of Targeting/Delivery (antibody conjugation, cell-penetrating peptide)
Table 10. Key Players of Detection/Labeling (FITC, Cy3/Cy5, biotin, DOTA)
Table 11. Key Players of PTM Mimicry (phosphorylation, glycosylation, methylation)
Table 12. Key Players of Immunoenhancement (KLH/BSA conjugation, MAPs)
Table 13. Global Peptide Modification Service Market Size Growth Rate by Synthesis & Process Route (US$ Million): 2020 VS 2024 VS 2031
Table 14. Key Players of Solid-phase Peptide Synthesis (SPPS)-integrated
Table 15. Key Players of Solution-phase Synthesis
Table 16. Key Players of Post-synthesis Modification
Table 17. Key Players of In-situ Modification During Synthesis
Table 18. Global Peptide Modification Service Market Size Growth by Application (US$ Million): 2020 VS 2024 VS 2031
Table 19. Global Peptide Modification Service Market Size by Region (US$ Million): 2020 VS 2024 VS 2031
Table 20. Global Peptide Modification Service Market Size by Region (2020-2025) & (US$ Million)
Table 21. Global Peptide Modification Service Market Share by Region (2020-2025)
Table 22. Global Peptide Modification Service Forecasted Market Size by Region (2026-2031) & (US$ Million)
Table 23. Global Peptide Modification Service Market Share by Region (2026-2031)
Table 24. Peptide Modification Service Market Trends
Table 25. Peptide Modification Service Market Drivers
Table 26. Peptide Modification Service Market Challenges
Table 27. Peptide Modification Service Market Restraints
Table 28. Global Peptide Modification Service Revenue by Players (2020-2025) & (US$ Million)
Table 29. Global Peptide Modification Service Market Share by Players (2020-2025)
Table 30. Global Top Peptide Modification Service Players by Company Type (Tier 1, Tier 2, and Tier 3) & (based on the Revenue in Peptide Modification Service as of 2024)
Table 31. Ranking of Global Top Peptide Modification Service Companies by Revenue (US$ Million) in 2024
Table 32. Global 5 Largest Players Market Share by Peptide Modification Service Revenue (CR5 and HHI) & (2020-2025)
Table 33. Global Key Players of Peptide Modification Service, Headquarters and Area Served
Table 34. Global Key Players of Peptide Modification Service, Product and Application
Table 35. Global Key Players of Peptide Modification Service, Date of Enter into This Industry
Table 36. Mergers & Acquisitions, Expansion Plans
Table 37. Global Peptide Modification Service Market Size by Type (2020-2025) & (US$ Million)
Table 38. Global Peptide Modification Service Revenue Market Share by Type (2020-2025)
Table 39. Global Peptide Modification Service Forecasted Market Size by Type (2026-2031) & (US$ Million)
Table 40. Global Peptide Modification Service Revenue Market Share by Type (2026-2031)
Table 41. Global Peptide Modification Service Market Size by Application (2020-2025) & (US$ Million)
Table 42. Global Peptide Modification Service Revenue Market Share by Application (2020-2025)
Table 43. Global Peptide Modification Service Forecasted Market Size by Application (2026-2031) & (US$ Million)
Table 44. Global Peptide Modification Service Revenue Market Share by Application (2026-2031)
Table 45. North America Peptide Modification Service Market Size Growth Rate by Country (US$ Million): 2020 VS 2024 VS 2031
Table 46. North America Peptide Modification Service Market Size by Country (2020-2025) & (US$ Million)
Table 47. North America Peptide Modification Service Market Size by Country (2026-2031) & (US$ Million)
Table 48. Europe Peptide Modification Service Market Size Growth Rate by Country (US$ Million): 2020 VS 2024 VS 2031
Table 49. Europe Peptide Modification Service Market Size by Country (2020-2025) & (US$ Million)
Table 50. Europe Peptide Modification Service Market Size by Country (2026-2031) & (US$ Million)
Table 51. Asia-Pacific Peptide Modification Service Market Size Growth Rate by Region (US$ Million): 2020 VS 2024 VS 2031
Table 52. Asia-Pacific Peptide Modification Service Market Size by Region (2020-2025) & (US$ Million)
Table 53. Asia-Pacific Peptide Modification Service Market Size by Region (2026-2031) & (US$ Million)
Table 54. Latin America Peptide Modification Service Market Size Growth Rate by Country (US$ Million): 2020 VS 2024 VS 2031
Table 55. Latin America Peptide Modification Service Market Size by Country (2020-2025) & (US$ Million)
Table 56. Latin America Peptide Modification Service Market Size by Country (2026-2031) & (US$ Million)
Table 57. Middle East & Africa Peptide Modification Service Market Size Growth Rate by Country (US$ Million): 2020 VS 2024 VS 2031
Table 58. Middle East & Africa Peptide Modification Service Market Size by Country (2020-2025) & (US$ Million)
Table 59. Middle East & Africa Peptide Modification Service Market Size by Country (2026-2031) & (US$ Million)
Table 60. GenScript Company Details
Table 61. GenScript Business Overview
Table 62. GenScript Peptide Modification Service Product
Table 63. GenScript Revenue in Peptide Modification Service Business (2020-2025) & (US$ Million)
Table 64. GenScript Recent Development
Table 65. Biosynth Company Details
Table 66. Biosynth Business Overview
Table 67. Biosynth Peptide Modification Service Product
Table 68. Biosynth Revenue in Peptide Modification Service Business (2020-2025) & (US$ Million)
Table 69. Biosynth Recent Development
Table 70. Bio-Synthesis Company Details
Table 71. Bio-Synthesis Business Overview
Table 72. Bio-Synthesis Peptide Modification Service Product
Table 73. Bio-Synthesis Revenue in Peptide Modification Service Business (2020-2025) & (US$ Million)
Table 74. Bio-Synthesis Recent Development
Table 75. Thermo Fisher Scientific Company Details
Table 76. Thermo Fisher Scientific Business Overview
Table 77. Thermo Fisher Scientific Peptide Modification Service Product
Table 78. Thermo Fisher Scientific Revenue in Peptide Modification Service Business (2020-2025) & (US$ Million)
Table 79. Thermo Fisher Scientific Recent Development
Table 80. Syd Labs Company Details
Table 81. Syd Labs Business Overview
Table 82. Syd Labs Peptide Modification Service Product
Table 83. Syd Labs Revenue in Peptide Modification Service Business (2020-2025) & (US$ Million)
Table 84. Syd Labs Recent Development
Table 85. JPT Company Details
Table 86. JPT Business Overview
Table 87. JPT Peptide Modification Service Product
Table 88. JPT Revenue in Peptide Modification Service Business (2020-2025) & (US$ Million)
Table 89. JPT Recent Development
Table 90. LifeTein Company Details
Table 91. LifeTein Business Overview
Table 92. LifeTein Peptide Modification Service Product
Table 93. LifeTein Revenue in Peptide Modification Service Business (2020-2025) & (US$ Million)
Table 94. LifeTein Recent Development
Table 95. Creative Peptides Company Details
Table 96. Creative Peptides Business Overview
Table 97. Creative Peptides Peptide Modification Service Product
Table 98. Creative Peptides Revenue in Peptide Modification Service Business (2020-2025) & (US$ Million)
Table 99. Creative Peptides Recent Development
Table 100. Elabscience Company Details
Table 101. Elabscience Business Overview
Table 102. Elabscience Peptide Modification Service Product
Table 103. Elabscience Revenue in Peptide Modification Service Business (2020-2025) & (US$ Million)
Table 104. Elabscience Recent Development
Table 105. Genosphere Biotechnologies Company Details
Table 106. Genosphere Biotechnologies Business Overview
Table 107. Genosphere Biotechnologies Peptide Modification Service Product
Table 108. Genosphere Biotechnologies Revenue in Peptide Modification Service Business (2020-2025) & (US$ Million)
Table 109. Genosphere Biotechnologies Recent Development
Table 110. ProSci Company Details
Table 111. ProSci Business Overview
Table 112. ProSci Peptide Modification Service Product
Table 113. ProSci Revenue in Peptide Modification Service Business (2020-2025) & (US$ Million)
Table 114. ProSci Recent Development
Table 115. Giotto Biotech Company Details
Table 116. Giotto Biotech Business Overview
Table 117. Giotto Biotech Peptide Modification Service Product
Table 118. Giotto Biotech Revenue in Peptide Modification Service Business (2020-2025) & (US$ Million)
Table 119. Giotto Biotech Recent Development
Table 120. SB-PEPTIDE Company Details
Table 121. SB-PEPTIDE Business Overview
Table 122. SB-PEPTIDE Peptide Modification Service Product
Table 123. SB-PEPTIDE Revenue in Peptide Modification Service Business (2020-2025) & (US$ Million)
Table 124. SB-PEPTIDE Recent Development
Table 125. Biomatik Company Details
Table 126. Biomatik Business Overview
Table 127. Biomatik Peptide Modification Service Product
Table 128. Biomatik Revenue in Peptide Modification Service Business (2020-2025) & (US$ Million)
Table 129. Biomatik Recent Development
Table 130. allele life sciences Company Details
Table 131. allele life sciences Business Overview
Table 132. allele life sciences Peptide Modification Service Product
Table 133. allele life sciences Revenue in Peptide Modification Service Business (2020-2025) & (US$ Million)
Table 134. allele life sciences Recent Development
Table 135. Synpeptide Company Details
Table 136. Synpeptide Business Overview
Table 137. Synpeptide Peptide Modification Service Product
Table 138. Synpeptide Revenue in Peptide Modification Service Business (2020-2025) & (US$ Million)
Table 139. Synpeptide Recent Development
Table 140. Omizzur Company Details
Table 141. Omizzur Business Overview
Table 142. Omizzur Peptide Modification Service Product
Table 143. Omizzur Revenue in Peptide Modification Service Business (2020-2025) & (US$ Million)
Table 144. Omizzur Recent Development
Table 145. KMD Bioscience Company Details
Table 146. KMD Bioscience Business Overview
Table 147. KMD Bioscience Peptide Modification Service Product
Table 148. KMD Bioscience Revenue in Peptide Modification Service Business (2020-2025) & (US$ Million)
Table 149. KMD Bioscience Recent Development
Table 150. Leadgene Biomedical Company Details
Table 151. Leadgene Biomedical Business Overview
Table 152. Leadgene Biomedical Peptide Modification Service Product
Table 153. Leadgene Biomedical Revenue in Peptide Modification Service Business (2020-2025) & (US$ Million)
Table 154. Leadgene Biomedical Recent Development
Table 155. KenPeptide Company Details
Table 156. KenPeptide Business Overview
Table 157. KenPeptide Peptide Modification Service Product
Table 158. KenPeptide Revenue in Peptide Modification Service Business (2020-2025) & (US$ Million)
Table 159. KenPeptide Recent Development
Table 160. CASLO Company Details
Table 161. CASLO Business Overview
Table 162. CASLO Peptide Modification Service Product
Table 163. CASLO Revenue in Peptide Modification Service Business (2020-2025) & (US$ Million)
Table 164. CASLO Recent Development
Table 165. TGpeptide Company Details
Table 166. TGpeptide Business Overview
Table 167. TGpeptide Peptide Modification Service Product
Table 168. TGpeptide Revenue in Peptide Modification Service Business (2020-2025) & (US$ Million)
Table 169. TGpeptide Recent Development
Table 170. Boston Cellron Company Details
Table 171. Boston Cellron Business Overview
Table 172. Boston Cellron Peptide Modification Service Product
Table 173. Boston Cellron Revenue in Peptide Modification Service Business (2020-2025) & (US$ Million)
Table 174. Boston Cellron Recent Development
Table 175. Bio Basic Company Details
Table 176. Bio Basic Business Overview
Table 177. Bio Basic Peptide Modification Service Product
Table 178. Bio Basic Revenue in Peptide Modification Service Business (2020-2025) & (US$ Million)
Table 179. Bio Basic Recent Development
Table 180. ProBioGen Company Details
Table 181. ProBioGen Business Overview
Table 182. ProBioGen Peptide Modification Service Product
Table 183. ProBioGen Revenue in Peptide Modification Service Business (2020-2025) & (US$ Million)
Table 184. ProBioGen Recent Development
Table 185. buchiglasuster Company Details
Table 186. buchiglasuster Business Overview
Table 187. buchiglasuster Peptide Modification Service Product
Table 188. buchiglasuster Revenue in Peptide Modification Service Business (2020-2025) & (US$ Million)
Table 189. buchiglasuster Recent Development
Table 190. Research Programs/Design for This Report
Table 191. Key Data Information from Secondary Sources
Table 192. Key Data Information from Primary Sources
Table 193. Authors List of This Report
List of Figures
Figure 1. Peptide Modification Service Picture
Figure 2. Global Peptide Modification Service Market Size Comparison by Type (2020-2031) & (US$ Million)
Figure 3. Global Peptide Modification Service Market Share by Type: 2024 VS 2031
Figure 4. N-Terminal Modifications Features
Figure 5. C-Terminal Modifications Features
Figure 6. Fluorescence Dye Labeling Features
Figure 7. Phosphorylation Features
Figure 8. Others Features
Figure 9. Global Peptide Modification Service Market Size Comparison by Modification Purpose/Function (2020-2031) & (US$ Million)
Figure 10. Stability Optimization (amidation, cyclization, PEGylation) Features
Figure 11. Targeting/Delivery (antibody conjugation, cell-penetrating peptide) Features
Figure 12. Detection/Labeling (FITC, Cy3/Cy5, biotin, DOTA) Features
Figure 13. PTM Mimicry (phosphorylation, glycosylation, methylation) Features
Figure 14. Immunoenhancement (KLH/BSA conjugation, MAPs) Features
Figure 15. Global Peptide Modification Service Market Size Comparison by Synthesis & Process Route (2020-2031) & (US$ Million)
Figure 16. Solid-phase Peptide Synthesis (SPPS)-integrated Features
Figure 17. Solution-phase Synthesis Features
Figure 18. Post-synthesis Modification Features
Figure 19. In-situ Modification During Synthesis Features
Figure 20. Global Peptide Modification Service Market Size by Application (2020-2031) & (US$ Million)
Figure 21. Global Peptide Modification Service Market Share by Application: 2024 VS 2031
Figure 22. Commercial Case Studies
Figure 23. Academic Research Case Studies
Figure 24. Peptide Modification Service Report Years Considered
Figure 25. Global Peptide Modification Service Market Size (US$ Million), Year-over-Year: 2020-2031
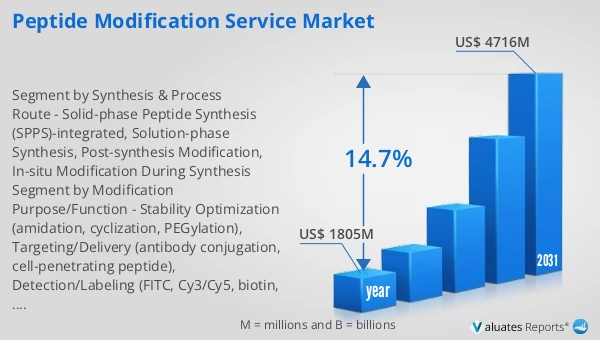
Figure 26. Global Peptide Modification Service Market Size, (US$ Million), 2020 VS 2024 VS 2031
Figure 27. Global Peptide Modification Service Market Share by Region: 2024 VS 2031
Figure 28. Global Peptide Modification Service Market Share by Players in 2024
Figure 29. Global Peptide Modification Service Market Share by Company Type (Tier 1, Tier 2, and Tier 3)
Figure 30. The Top 10 and 5 Players Market Share by Peptide Modification Service Revenue in 2024
Figure 31. North America Peptide Modification Service Market Size YoY Growth (2020-2031) & (US$ Million)
Figure 32. North America Peptide Modification Service Market Share by Country (2020-2031)
Figure 33. United States Peptide Modification Service Market Size YoY Growth (2020-2031) & (US$ Million)
Figure 34. Canada Peptide Modification Service Market Size YoY Growth (2020-2031) & (US$ Million)
Figure 35. Europe Peptide Modification Service Market Size YoY Growth (2020-2031) & (US$ Million)
Figure 36. Europe Peptide Modification Service Market Share by Country (2020-2031)
Figure 37. Germany Peptide Modification Service Market Size YoY Growth (2020-2031) & (US$ Million)
Figure 38. France Peptide Modification Service Market Size YoY Growth (2020-2031) & (US$ Million)
Figure 39. U.K. Peptide Modification Service Market Size YoY Growth (2020-2031) & (US$ Million)
Figure 40. Italy Peptide Modification Service Market Size YoY Growth (2020-2031) & (US$ Million)
Figure 41. Russia Peptide Modification Service Market Size YoY Growth (2020-2031) & (US$ Million)
Figure 42. Ireland Peptide Modification Service Market Size YoY Growth (2020-2031) & (US$ Million)
Figure 43. Asia-Pacific Peptide Modification Service Market Size YoY Growth (2020-2031) & (US$ Million)
Figure 44. Asia-Pacific Peptide Modification Service Market Share by Region (2020-2031)
Figure 45. China Peptide Modification Service Market Size YoY Growth (2020-2031) & (US$ Million)
Figure 46. Japan Peptide Modification Service Market Size YoY Growth (2020-2031) & (US$ Million)
Figure 47. South Korea Peptide Modification Service Market Size YoY Growth (2020-2031) & (US$ Million)
Figure 48. Southeast Asia Peptide Modification Service Market Size YoY Growth (2020-2031) & (US$ Million)
Figure 49. India Peptide Modification Service Market Size YoY Growth (2020-2031) & (US$ Million)
Figure 50. Australia & New Zealand Peptide Modification Service Market Size YoY Growth (2020-2031) & (US$ Million)
Figure 51. Latin America Peptide Modification Service Market Size YoY Growth (2020-2031) & (US$ Million)
Figure 52. Latin America Peptide Modification Service Market Share by Country (2020-2031)
Figure 53. Mexico Peptide Modification Service Market Size YoY Growth (2020-2031) & (US$ Million)
Figure 54. Brazil Peptide Modification Service Market Size YoY Growth (2020-2031) & (US$ Million)
Figure 55. Middle East & Africa Peptide Modification Service Market Size YoY Growth (2020-2031) & (US$ Million)
Figure 56. Middle East & Africa Peptide Modification Service Market Share by Country (2020-2031)
Figure 57. Israel Peptide Modification Service Market Size YoY Growth (2020-2031) & (US$ Million)
Figure 58. Saudi Arabia Peptide Modification Service Market Size YoY Growth (2020-2031) & (US$ Million)
Figure 59. UAE Peptide Modification Service Market Size YoY Growth (2020-2031) & (US$ Million)
Figure 60. GenScript Revenue Growth Rate in Peptide Modification Service Business (2020-2025)
Figure 61. Biosynth Revenue Growth Rate in Peptide Modification Service Business (2020-2025)
Figure 62. Bio-Synthesis Revenue Growth Rate in Peptide Modification Service Business (2020-2025)
Figure 63. Thermo Fisher Scientific Revenue Growth Rate in Peptide Modification Service Business (2020-2025)
Figure 64. Syd Labs Revenue Growth Rate in Peptide Modification Service Business (2020-2025)
Figure 65. JPT Revenue Growth Rate in Peptide Modification Service Business (2020-2025)
Figure 66. LifeTein Revenue Growth Rate in Peptide Modification Service Business (2020-2025)
Figure 67. Creative Peptides Revenue Growth Rate in Peptide Modification Service Business (2020-2025)
Figure 68. Elabscience Revenue Growth Rate in Peptide Modification Service Business (2020-2025)
Figure 69. Genosphere Biotechnologies Revenue Growth Rate in Peptide Modification Service Business (2020-2025)
Figure 70. ProSci Revenue Growth Rate in Peptide Modification Service Business (2020-2025)
Figure 71. Giotto Biotech Revenue Growth Rate in Peptide Modification Service Business (2020-2025)
Figure 72. SB-PEPTIDE Revenue Growth Rate in Peptide Modification Service Business (2020-2025)
Figure 73. Biomatik Revenue Growth Rate in Peptide Modification Service Business (2020-2025)
Figure 74. allele life sciences Revenue Growth Rate in Peptide Modification Service Business (2020-2025)
Figure 75. Synpeptide Revenue Growth Rate in Peptide Modification Service Business (2020-2025)
Figure 76. Omizzur Revenue Growth Rate in Peptide Modification Service Business (2020-2025)
Figure 77. KMD Bioscience Revenue Growth Rate in Peptide Modification Service Business (2020-2025)
Figure 78. Leadgene Biomedical Revenue Growth Rate in Peptide Modification Service Business (2020-2025)
Figure 79. KenPeptide Revenue Growth Rate in Peptide Modification Service Business (2020-2025)
Figure 80. CASLO Revenue Growth Rate in Peptide Modification Service Business (2020-2025)
Figure 81. TGpeptide Revenue Growth Rate in Peptide Modification Service Business (2020-2025)
Figure 82. Boston Cellron Revenue Growth Rate in Peptide Modification Service Business (2020-2025)
Figure 83. Bio Basic Revenue Growth Rate in Peptide Modification Service Business (2020-2025)
Figure 84. ProBioGen Revenue Growth Rate in Peptide Modification Service Business (2020-2025)
Figure 85. buchiglasuster Revenue Growth Rate in Peptide Modification Service Business (2020-2025)
Figure 86. Bottom-up and Top-down Approaches for This Report
Figure 87. Data Triangulation
Figure 88. Key Executives Interviewed