

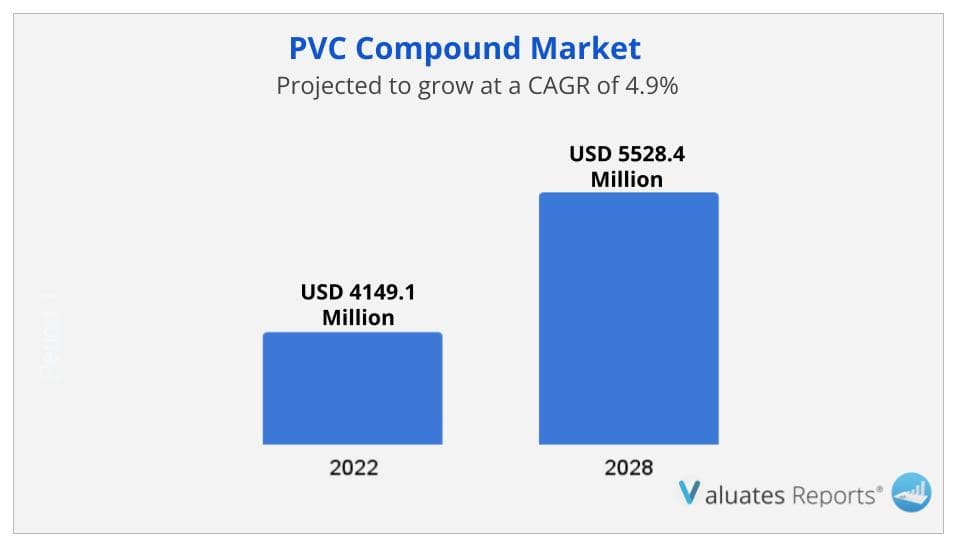
Due to the COVID-19 pandemic, the global PVC Compound market size is estimated to be worth USD 4149.1 Million in 2022 and is forecast to a readjusted size of USD 5528.4 Million by 2028 with a CAGR of 4.9% during the review period.
The most versatile thermoplastic material commercially available in a variety of compounded forms to cover a wide range of hardness and flexibility applications is PVC. It has good physical strength and excellent resistance to water and chemicals. The PVC characteristics are when the flame is withdrawn and difficult to ignite and have self-extinguishing.
PVC resin is liable to degradation on heating and is a very tricky material to process, unless properly compounded. This places a great deal of responsibility on the compounding technologist. The use of compounding is to mix the resin and other additives into a homogeneous state of processing. These compounds use for the manufacture of finished products. It is impossible to process PVC resin without the addition of certain compounding ingredients such as heat stabilizers and lubricants.
Fully considering the economic change by this health crisis, Non-Plasticised PVC accounting for % of the PVC Compound global market in 2021, is projected to value US$ million by 2028, growing at a revised % CAGR in the post-COVID-19 period. While Pipe & Fitting segment is altered to an % CAGR throughout this forecast period.
The global PVC Compound industry has a low concentration. The major manufacturers are concentrated in USA, and Europe, such as Westlake Chemical, Mexichem, Aurora Plastics, Benvic Europe and INEOS Compounds. At present, Westlake Chemical is the world leader, holding 23% production market share.
The global PVC Compound consumption market is led by North America and Europe. And North America is the largest region consumption market, accounting for about 52% of global consumption of PVC Compound.
PVC Compound downstream is wide and recently PVC Compound has acquired increasing significance in various fields of Wire & Cable, Pipe & Fitting, the PVC Compound market is mainly driven by growing demand for Profiles & Tubes. Profiles & Tubes accounts for nearly 25% of total downstream consumption of PVC Compound in global.
PVC Compound can be mainly divided into Non-Plasticised PVC and Plasticised PVC, which Plasticised PVC captures about 65% of PVC Compound market.
In terms of production side, this report researches the PVC Compound capacity, production, growth rate, market share by manufacturers and by region (region level and country level), from 2017 to 2022, and forecast to 2028.
In terms of sales side, this report focuses on the sales of PVC Compound by region (region level and country level), by company, by Type and by Application. from 2017 to 2022 and forecast to 2028.
The authors of this research report have explored the key segments: Type and Application. The report offers an in-depth breakdown of type and application segments and their sub-segments. The lucrativeness and growth potential have been looked into by the industry experts in this report. This section of the report also provides sales and revenue forecast data by type and application segments based on sales, price, and revenue for the period 2017-2028. The specialists, to broaden the understanding of the users, have done value chain and raw material analysis in this section.
The authors of this study have enlightened the readers on the rise and effect of the Covid-19 outbreak on the development. They have investigated the changes brought about in the demand/supply side, consumption, supply chain, and production/manufacturing. The readers will get familiar with the measures that have helped the key players to bring the PVC Compound market back to the pre-covid levels.
In this segment of the report, the specialists have delved into the key growth opportunities that are likely to emerge. This will aid the key players to simplify complex issues related to business and frame future strategies to compete in this competitive environment. This section will certainly assist the players to boldly position their business.
In this section of the report, the researchers have done a comprehensive analysis of the prominent players operating and the strategies they are focusing on to combat the intense competition. Company profiles and share analysis of the prominent players are also provided in this section. They have also provided reliable sales and revenue data of the manufacturers for the period 2017-2022. With the assistance of this report, key players, stakeholders, and other participants will be able to stay abreast of the recent and upcoming developments in the business.
1.1 PVC Compound Product Introduction
1.2 Market by Type
1.2.1 Global PVC Compound Market Size by Type, 2017 VS 2021 VS 2028
1.2.2 Non-Plasticised PVC
1.2.3 Plasticised PVC
1.3 Market by Application
1.3.1 Global PVC Compound Market Size by Application, 2017 VS 2021 VS 2028
1.3.2 Pipe & Fitting
1.3.3 Profiles & Tubes
1.3.4 Wire & Cable
1.3.5 Film & Sheet
1.3.6 Others
1.4 Study Objectives
1.5 Years Considered
2 Global PVC Compound Production
2.1 Global PVC Compound Production Capacity (2017-2028)
2.2 Global PVC Compound Production by Region: 2017 VS 2021 VS 2028
2.3 Global PVC Compound Production by Region
2.3.1 Global PVC Compound Historic Production by Region (2017-2022)
2.3.2 Global PVC Compound Forecasted Production by Region (2023-2028)
2.4 North America
2.5 Europe
2.6 Middle East & Africa
2.7 Southeast Asia
2.8 Japan
2.9 China
2.10 South Korea
2.11 India
3 Global PVC Compound Sales in Volume & Value Estimates and Forecasts
3.1 Global PVC Compound Sales Estimates and Forecasts 2017-2028
3.2 Global PVC Compound Revenue Estimates and Forecasts 2017-2028
3.3 Global PVC Compound Revenue by Region: 2017 VS 2021 VS 2028
3.4 Global PVC Compound Sales by Region
3.4.1 Global PVC Compound Sales by Region (2017-2022)
3.4.2 Global Sales PVC Compound by Region (2023-2028)
3.5 Global PVC Compound Revenue by Region
3.5.1 Global PVC Compound Revenue by Region (2017-2022)
3.5.2 Global PVC Compound Revenue by Region (2023-2028)
3.6 North America
3.7 Europe
3.8 Asia-Pacific
3.9 Latin America
3.10 Middle East & Africa
4 Competition by Manufactures
4.1 Global PVC Compound Production Capacity by Manufacturers
4.2 Global PVC Compound Sales by Manufacturers
4.2.1 Global PVC Compound Sales by Manufacturers (2017-2022)
4.2.2 Global PVC Compound Sales Market Share by Manufacturers (2017-2022)
4.2.3 Global Top 10 and Top 5 Largest Manufacturers of PVC Compound in 2021
4.3 Global PVC Compound Revenue by Manufacturers
4.3.1 Global PVC Compound Revenue by Manufacturers (2017-2022)
4.3.2 Global PVC Compound Revenue Market Share by Manufacturers (2017-2022)
4.3.3 Global Top 10 and Top 5 Companies by PVC Compound Revenue in 2021
4.4 Global PVC Compound Sales Price by Manufacturers
4.5 Analysis of Competitive Landscape
4.5.1 Manufacturers Market Concentration Ratio (CR5 and HHI)
4.5.2 Global PVC Compound Market Share by Company Type (Tier 1, Tier 2, and Tier 3)
4.5.3 Global PVC Compound Manufacturers Geographical Distribution
4.6 Mergers & Acquisitions, Expansion Plans
5 Market Size by Type
5.1 Global PVC Compound Sales by Type
5.1.1 Global PVC Compound Historical Sales by Type (2017-2022)
5.1.2 Global PVC Compound Forecasted Sales by Type (2023-2028)
5.1.3 Global PVC Compound Sales Market Share by Type (2017-2028)
5.2 Global PVC Compound Revenue by Type
5.2.1 Global PVC Compound Historical Revenue by Type (2017-2022)
5.2.2 Global PVC Compound Forecasted Revenue by Type (2023-2028)
5.2.3 Global PVC Compound Revenue Market Share by Type (2017-2028)
5.3 Global PVC Compound Price by Type
5.3.1 Global PVC Compound Price by Type (2017-2022)
5.3.2 Global PVC Compound Price Forecast by Type (2023-2028)
6 Market Size by Application
6.1 Global PVC Compound Sales by Application
6.1.1 Global PVC Compound Historical Sales by Application (2017-2022)
6.1.2 Global PVC Compound Forecasted Sales by Application (2023-2028)
6.1.3 Global PVC Compound Sales Market Share by Application (2017-2028)
6.2 Global PVC Compound Revenue by Application
6.2.1 Global PVC Compound Historical Revenue by Application (2017-2022)
6.2.2 Global PVC Compound Forecasted Revenue by Application (2023-2028)
6.2.3 Global PVC Compound Revenue Market Share by Application (2017-2028)
6.3 Global PVC Compound Price by Application
6.3.1 Global PVC Compound Price by Application (2017-2022)
6.3.2 Global PVC Compound Price Forecast by Application (2023-2028)
7 North America
7.1 North America PVC Compound Market Size by Type
7.1.1 North America PVC Compound Sales by Type (2017-2028)
7.1.2 North America PVC Compound Revenue by Type (2017-2028)
7.2 North America PVC Compound Market Size by Application
7.2.1 North America PVC Compound Sales by Application (2017-2028)
7.2.2 North America PVC Compound Revenue by Application (2017-2028)
7.3 North America PVC Compound Sales by Country
7.3.1 North America PVC Compound Sales by Country (2017-2028)
7.3.2 North America PVC Compound Revenue by Country (2017-2028)
7.3.3 U.S.
7.3.4 Canada
8 Europe
8.1 Europe PVC Compound Market Size by Type
8.1.1 Europe PVC Compound Sales by Type (2017-2028)
8.1.2 Europe PVC Compound Revenue by Type (2017-2028)
8.2 Europe PVC Compound Market Size by Application
8.2.1 Europe PVC Compound Sales by Application (2017-2028)
8.2.2 Europe PVC Compound Revenue by Application (2017-2028)
8.3 Europe PVC Compound Sales by Country
8.3.1 Europe PVC Compound Sales by Country (2017-2028)
8.3.2 Europe PVC Compound Revenue by Country (2017-2028)
8.3.3 Germany
8.3.4 France
8.3.5 U.K.
8.3.6 Italy
8.3.7 Russia
9 Asia Pacific
9.1 Asia Pacific PVC Compound Market Size by Type
9.1.1 Asia Pacific PVC Compound Sales by Type (2017-2028)
9.1.2 Asia Pacific PVC Compound Revenue by Type (2017-2028)
9.2 Asia Pacific PVC Compound Market Size by Application
9.2.1 Asia Pacific PVC Compound Sales by Application (2017-2028)
9.2.2 Asia Pacific PVC Compound Revenue by Application (2017-2028)
9.3 Asia Pacific PVC Compound Sales by Region
9.3.1 Asia Pacific PVC Compound Sales by Region (2017-2028)
9.3.2 Asia Pacific PVC Compound Revenue by Region (2017-2028)
9.3.3 China
9.3.4 Japan
9.3.5 South Korea
9.3.6 India
9.3.7 Australia
9.3.8 Taiwan
9.3.9 Indonesia
9.3.10 Thailand
9.3.11 Malaysia
9.3.12 Philippines
10 Latin America
10.1 Latin America PVC Compound Market Size by Type
10.1.1 Latin America PVC Compound Sales by Type (2017-2028)
10.1.2 Latin America PVC Compound Revenue by Type (2017-2028)
10.2 Latin America PVC Compound Market Size by Application
10.2.1 Latin America PVC Compound Sales by Application (2017-2028)
10.2.2 Latin America PVC Compound Revenue by Application (2017-2028)
10.3 Latin America PVC Compound Sales by Country
10.3.1 Latin America PVC Compound Sales by Country (2017-2028)
10.3.2 Latin America PVC Compound Revenue by Country (2017-2028)
10.3.3 Mexico
10.3.4 Brazil
10.3.5 Argentina
11 Middle East and Africa
11.1 Middle East and Africa PVC Compound Market Size by Type
11.1.1 Middle East and Africa PVC Compound Sales by Type (2017-2028)
11.1.2 Middle East and Africa PVC Compound Revenue by Type (2017-2028)
11.2 Middle East and Africa PVC Compound Market Size by Application
11.2.1 Middle East and Africa PVC Compound Sales by Application (2017-2028)
11.2.2 Middle East and Africa PVC Compound Revenue by Application (2017-2028)
11.3 Middle East and Africa PVC Compound Sales by Country
11.3.1 Middle East and Africa PVC Compound Sales by Country (2017-2028)
11.3.2 Middle East and Africa PVC Compound Revenue by Country (2017-2028)
11.3.3 Turkey
11.3.4 Saudi Arabia
11.3.5 U.A.E
12 Corporate Profiles
12.1 Westlake Chemical
12.1.1 Westlake Chemical Corporation Information
12.1.2 Westlake Chemical Overview
12.1.3 Westlake Chemical PVC Compound Sales, Price, Revenue and Gross Margin (2017-2022)
12.1.4 Westlake Chemical PVC Compound Product Model Numbers, Pictures, Descriptions and Specifications
12.1.5 Westlake Chemical Recent Developments
12.2 Mexichem
12.2.1 Mexichem Corporation Information
12.2.2 Mexichem Overview
12.2.3 Mexichem PVC Compound Sales, Price, Revenue and Gross Margin (2017-2022)
12.2.4 Mexichem PVC Compound Product Model Numbers, Pictures, Descriptions and Specifications
12.2.5 Mexichem Recent Developments
12.3 Aurora Plastics
12.3.1 Aurora Plastics Corporation Information
12.3.2 Aurora Plastics Overview
12.3.3 Aurora Plastics PVC Compound Sales, Price, Revenue and Gross Margin (2017-2022)
12.3.4 Aurora Plastics PVC Compound Product Model Numbers, Pictures, Descriptions and Specifications
12.3.5 Aurora Plastics Recent Developments
12.4 Benvic Europe
12.4.1 Benvic Europe Corporation Information
12.4.2 Benvic Europe Overview
12.4.3 Benvic Europe PVC Compound Sales, Price, Revenue and Gross Margin (2017-2022)
12.4.4 Benvic Europe PVC Compound Product Model Numbers, Pictures, Descriptions and Specifications
12.4.5 Benvic Europe Recent Developments
12.5 INEOS Compounds
12.5.1 INEOS Compounds Corporation Information
12.5.2 INEOS Compounds Overview
12.5.3 INEOS Compounds PVC Compound Sales, Price, Revenue and Gross Margin (2017-2022)
12.5.4 INEOS Compounds PVC Compound Product Model Numbers, Pictures, Descriptions and Specifications
12.5.5 INEOS Compounds Recent Developments
12.6 Vinyl Compounds
12.6.1 Vinyl Compounds Corporation Information
12.6.2 Vinyl Compounds Overview
12.6.3 Vinyl Compounds PVC Compound Sales, Price, Revenue and Gross Margin (2017-2022)
12.6.4 Vinyl Compounds PVC Compound Product Model Numbers, Pictures, Descriptions and Specifications
12.6.5 Vinyl Compounds Recent Developments
12.7 Teknor Apex
12.7.1 Teknor Apex Corporation Information
12.7.2 Teknor Apex Overview
12.7.3 Teknor Apex PVC Compound Sales, Price, Revenue and Gross Margin (2017-2022)
12.7.4 Teknor Apex PVC Compound Product Model Numbers, Pictures, Descriptions and Specifications
12.7.5 Teknor Apex Recent Developments
12.8 Flex Technologies
12.8.1 Flex Technologies Corporation Information
12.8.2 Flex Technologies Overview
12.8.3 Flex Technologies PVC Compound Sales, Price, Revenue and Gross Margin (2017-2022)
12.8.4 Flex Technologies PVC Compound Product Model Numbers, Pictures, Descriptions and Specifications
12.8.5 Flex Technologies Recent Developments
12.9 Roscom
12.9.1 Roscom Corporation Information
12.9.2 Roscom Overview
12.9.3 Roscom PVC Compound Sales, Price, Revenue and Gross Margin (2017-2022)
12.9.4 Roscom PVC Compound Product Model Numbers, Pictures, Descriptions and Specifications
12.9.5 Roscom Recent Developments
12.10 EMPOL/IFFCO
12.10.1 EMPOL/IFFCO Corporation Information
12.10.2 EMPOL/IFFCO Overview
12.10.3 EMPOL/IFFCO PVC Compound Sales, Price, Revenue and Gross Margin (2017-2022)
12.10.4 EMPOL/IFFCO PVC Compound Product Model Numbers, Pictures, Descriptions and Specifications
12.10.5 EMPOL/IFFCO Recent Developments
12.11 Cary Compound
12.11.1 Cary Compound Corporation Information
12.11.2 Cary Compound Overview
12.11.3 Cary Compound PVC Compound Sales, Price, Revenue and Gross Margin (2017-2022)
12.11.4 Cary Compound PVC Compound Product Model Numbers, Pictures, Descriptions and Specifications
12.11.5 Cary Compound Recent Developments
12.12 S&E Specialty Polymers
12.12.1 S&E Specialty Polymers Corporation Information
12.12.2 S&E Specialty Polymers Overview
12.12.3 S&E Specialty Polymers PVC Compound Sales, Price, Revenue and Gross Margin (2017-2022)
12.12.4 S&E Specialty Polymers PVC Compound Product Model Numbers, Pictures, Descriptions and Specifications
12.12.5 S&E Specialty Polymers Recent Developments
12.13 Sylvin Technologies
12.13.1 Sylvin Technologies Corporation Information
12.13.2 Sylvin Technologies Overview
12.13.3 Sylvin Technologies PVC Compound Sales, Price, Revenue and Gross Margin (2017-2022)
12.13.4 Sylvin Technologies PVC Compound Product Model Numbers, Pictures, Descriptions and Specifications
12.13.5 Sylvin Technologies Recent Developments
12.14 Konnark Polymer
12.14.1 Konnark Polymer Corporation Information
12.14.2 Konnark Polymer Overview
12.14.3 Konnark Polymer PVC Compound Sales, Price, Revenue and Gross Margin (2017-2022)
12.14.4 Konnark Polymer PVC Compound Product Model Numbers, Pictures, Descriptions and Specifications
12.14.5 Konnark Polymer Recent Developments
12.15 Mazda Plastic
12.15.1 Mazda Plastic Corporation Information
12.15.2 Mazda Plastic Overview
12.15.3 Mazda Plastic PVC Compound Sales, Price, Revenue and Gross Margin (2017-2022)
12.15.4 Mazda Plastic PVC Compound Product Model Numbers, Pictures, Descriptions and Specifications
12.15.5 Mazda Plastic Recent Developments
12.16 Thevinyl
12.16.1 Thevinyl Corporation Information
12.16.2 Thevinyl Overview
12.16.3 Thevinyl PVC Compound Sales, Price, Revenue and Gross Margin (2017-2022)
12.16.4 Thevinyl PVC Compound Product Model Numbers, Pictures, Descriptions and Specifications
12.16.5 Thevinyl Recent Developments
12.17 ACTEGA
12.17.1 ACTEGA Corporation Information
12.17.2 ACTEGA Overview
12.17.3 ACTEGA PVC Compound Sales, Price, Revenue and Gross Margin (2017-2022)
12.17.4 ACTEGA PVC Compound Product Model Numbers, Pictures, Descriptions and Specifications
12.17.5 ACTEGA Recent Developments
12.18 PolyOne
12.18.1 PolyOne Corporation Information
12.18.2 PolyOne Overview
12.18.3 PolyOne PVC Compound Sales, Price, Revenue and Gross Margin (2017-2022)
12.18.4 PolyOne PVC Compound Product Model Numbers, Pictures, Descriptions and Specifications
12.18.5 PolyOne Recent Developments
12.19 Hanwha (Korea)
12.19.1 Hanwha (Korea) Corporation Information
12.19.2 Hanwha (Korea) Overview
12.19.3 Hanwha (Korea) PVC Compound Sales, Price, Revenue and Gross Margin (2017-2022)
12.19.4 Hanwha (Korea) PVC Compound Product Model Numbers, Pictures, Descriptions and Specifications
12.19.5 Hanwha (Korea) Recent Developments
12.20 Kingfa (China)
12.20.1 Kingfa (China) Corporation Information
12.20.2 Kingfa (China) Overview
12.20.3 Kingfa (China) PVC Compound Sales, Price, Revenue and Gross Margin (2017-2022)
12.20.4 Kingfa (China) PVC Compound Product Model Numbers, Pictures, Descriptions and Specifications
12.20.5 Kingfa (China) Recent Developments
12.21 Thai Plastics
12.21.1 Thai Plastics Corporation Information
12.21.2 Thai Plastics Overview
12.21.3 Thai Plastics PVC Compound Sales, Price, Revenue and Gross Margin (2017-2022)
12.21.4 Thai Plastics PVC Compound Product Model Numbers, Pictures, Descriptions and Specifications
12.21.5 Thai Plastics Recent Developments
13 Industry Chain and Sales Channels Analysis
13.1 PVC Compound Industry Chain Analysis
13.2 PVC Compound Key Raw Materials
13.2.1 Key Raw Materials
13.2.2 Raw Materials Key Suppliers
13.3 PVC Compound Production Mode & Process
13.4 PVC Compound Sales and Marketing
13.4.1 PVC Compound Sales Channels
13.4.2 PVC Compound Distributors
13.5 PVC Compound Customers
14 Market Drivers, Opportunities, Challenges and Risks Factors Analysis
14.1 PVC Compound Industry Trends
14.2 PVC Compound Market Drivers
14.3 PVC Compound Market Challenges
14.4 PVC Compound Market Restraints
15 Key Finding in The Global PVC Compound Study
16 Appendix
16.1 Research Methodology
16.1.1 Methodology/Research Approach
16.1.2 Data Source
16.2 Author Details
16.3 Disclaimer
List of Tables
Table 1. Global PVC Compound Market Size Growth Rate by Type, 2017 VS 2021 VS 2028 (US$ Million)
Table 2. Major Manufacturers of Non-Plasticised PVC
Table 3. Major Manufacturers of Plasticised PVC
Table 4. Global PVC Compound Market Size Growth Rate by Application, 2017 VS 2021 2028 (US$ Million)
Table 5. Global PVC Compound Production by Region: 2017 VS 2021 VS 2028 (K MT)
Table 6. Global PVC Compound Production by Region (2017-2022) & (K MT)
Table 7. Global PVC Compound Production Market Share by Region (2017-2022)
Table 8. Global PVC Compound Production by Region (2023-2028) & (K MT)
Table 9. Global PVC Compound Production Market Share by Region (2023-2028)
Table 10. Global PVC Compound Revenue by Region: 2017 VS 2021 VS 2028 (US$ Million)
Table 11. Global PVC Compound Sales by Region (2017-2022) & (K MT)
Table 12. Global PVC Compound Sales Market Share by Region (2017-2022)
Table 13. Global PVC Compound Sales by Region (2023-2028) & (K MT)
Table 14. Global PVC Compound Sales Market Share by Region (2023-2028)
Table 15. Global PVC Compound Revenue by Region (2017-2022) & (US$ Million)
Table 16. Global PVC Compound Revenue Market Share by Region (2017-2022)
Table 17. Global PVC Compound Revenue by Region (2023-2028) & (US$ Million)
Table 18. Global PVC Compound Revenue Market Share by Region (2023-2028)
Table 19. Global PVC Compound Production Capacity by Manufacturers (2017-2022) & (K MT)
Table 20. Global PVC Compound Capacity Market Share by Manufacturers (2017-2022)
Table 21. Global PVC Compound Sales by Manufacturers (2017-2022) & (K MT)
Table 22. Global PVC Compound Sales Market Share by Manufacturers (2017-2022)
Table 23. Global PVC Compound Revenue by Manufacturers (2017-2022) & (US$ Million)
Table 24. Global PVC Compound Revenue Share by Manufacturers (2017-2022)
Table 25. PVC Compound Price by Manufacturers 2017-2022 (USD/MT)
Table 26. Global PVC Compound Manufacturers Market Concentration Ratio (CR5 and HHI)
Table 27. Global PVC Compound by Company Type (Tier 1, Tier 2, and Tier 3) & (based on the Revenue in PVC Compound as of 2021)
Table 28. PVC Compound Manufacturing Base Distribution and Headquarters
Table 29. Manufacturers PVC Compound Product Offered
Table 30. Date of Manufacturers Enter into PVC Compound Market
Table 31. Mergers & Acquisitions, Expansion Plans
Table 32. Global PVC Compound Sales by Type (2017-2022) & (K MT)
Table 33. Global PVC Compound Sales by Type (2023-2028) & (K MT)
Table 34. Global PVC Compound Sales Share by Type (2017-2022)
Table 35. Global PVC Compound Sales Share by Type (2023-2028)
Table 36. Global PVC Compound Revenue by Type (2017-2022) & (US$ Million)
Table 37. Global PVC Compound Revenue by Type (2023-2028) & (US$ Million)
Table 38. Global PVC Compound Revenue Share by Type (2017-2022)
Table 39. Global PVC Compound Revenue Share by Type (2023-2028)
Table 40. PVC Compound Price by Type (2017-2022) & (USD/MT)
Table 41. Global PVC Compound Price Forecast by Type (2023-2028) & (USD/MT)
Table 42. Global PVC Compound Sales by Application (2017-2022) & (K MT)
Table 43. Global PVC Compound Sales by Application (2023-2028) & (K MT)
Table 44. Global PVC Compound Sales Share by Application (2017-2022)
Table 45. Global PVC Compound Sales Share by Application (2023-2028)
Table 46. Global PVC Compound Revenue by Application (2017-2022) & (US$ Million)
Table 47. Global PVC Compound Revenue by Application (2023-2028) & (US$ Million)
Table 48. Global PVC Compound Revenue Share by Application (2017-2022)
Table 49. Global PVC Compound Revenue Share by Application (2023-2028)
Table 50. PVC Compound Price by Application (2017-2022) & (USD/MT)
Table 51. Global PVC Compound Price Forecast by Application (2023-2028) & (USD/MT)
Table 52. North America PVC Compound Sales by Type (2017-2022) & (K MT)
Table 53. North America PVC Compound Sales by Type (2023-2028) & (K MT)
Table 54. North America PVC Compound Revenue by Type (2017-2022) & (US$ Million)
Table 55. North America PVC Compound Revenue by Type (2023-2028) & (US$ Million)
Table 56. North America PVC Compound Sales by Application (2017-2022) & (K MT)
Table 57. North America PVC Compound Sales by Application (2023-2028) & (K MT)
Table 58. North America PVC Compound Revenue by Application (2017-2022) & (US$ Million)
Table 59. North America PVC Compound Revenue by Application (2023-2028) & (US$ Million)
Table 60. North America PVC Compound Sales by Country (2017-2022) & (K MT)
Table 61. North America PVC Compound Sales by Country (2023-2028) & (K MT)
Table 62. North America PVC Compound Revenue by Country (2017-2022) & (US$ Million)
Table 63. North America PVC Compound Revenue by Country (2023-2028) & (US$ Million)
Table 64. Europe PVC Compound Sales by Type (2017-2022) & (K MT)
Table 65. Europe PVC Compound Sales by Type (2023-2028) & (K MT)
Table 66. Europe PVC Compound Revenue by Type (2017-2022) & (US$ Million)
Table 67. Europe PVC Compound Revenue by Type (2023-2028) & (US$ Million)
Table 68. Europe PVC Compound Sales by Application (2017-2022) & (K MT)
Table 69. Europe PVC Compound Sales by Application (2023-2028) & (K MT)
Table 70. Europe PVC Compound Revenue by Application (2017-2022) & (US$ Million)
Table 71. Europe PVC Compound Revenue by Application (2023-2028) & (US$ Million)
Table 72. Europe PVC Compound Sales by Country (2017-2022) & (K MT)
Table 73. Europe PVC Compound Sales by Country (2023-2028) & (K MT)
Table 74. Europe PVC Compound Revenue by Country (2017-2022) & (US$ Million)
Table 75. Europe PVC Compound Revenue by Country (2023-2028) & (US$ Million)
Table 76. Asia Pacific PVC Compound Sales by Type (2017-2022) & (K MT)
Table 77. Asia Pacific PVC Compound Sales by Type (2023-2028) & (K MT)
Table 78. Asia Pacific PVC Compound Revenue by Type (2017-2022) & (US$ Million)
Table 79. Asia Pacific PVC Compound Revenue by Type (2023-2028) & (US$ Million)
Table 80. Asia Pacific PVC Compound Sales by Application (2017-2022) & (K MT)
Table 81. Asia Pacific PVC Compound Sales by Application (2023-2028) & (K MT)
Table 82. Asia Pacific PVC Compound Revenue by Application (2017-2022) & (US$ Million)
Table 83. Asia Pacific PVC Compound Revenue by Application (2023-2028) & (US$ Million)
Table 84. Asia Pacific PVC Compound Sales by Region (2017-2022) & (K MT)
Table 85. Asia Pacific PVC Compound Sales by Region (2023-2028) & (K MT)
Table 86. Asia Pacific PVC Compound Revenue by Region (2017-2022) & (US$ Million)
Table 87. Asia Pacific PVC Compound Revenue by Region (2023-2028) & (US$ Million)
Table 88. Latin America PVC Compound Sales by Type (2017-2022) & (K MT)
Table 89. Latin America PVC Compound Sales by Type (2023-2028) & (K MT)
Table 90. Latin America PVC Compound Revenue by Type (2017-2022) & (US$ Million)
Table 91. Latin America PVC Compound Revenue by Type (2023-2028) & (US$ Million)
Table 92. Latin America PVC Compound Sales by Application (2017-2022) & (K MT)
Table 93. Latin America PVC Compound Sales by Application (2023-2028) & (K MT)
Table 94. Latin America PVC Compound Revenue by Application (2017-2022) & (US$ Million)
Table 95. Latin America PVC Compound Revenue by Application (2023-2028) & (US$ Million)
Table 96. Latin America PVC Compound Sales by Country (2017-2022) & (K MT)
Table 97. Latin America PVC Compound Sales by Country (2023-2028) & (K MT)
Table 98. Latin America PVC Compound Revenue by Country (2017-2022) & (US$ Million)
Table 99. Latin America PVC Compound Revenue by Country (2023-2028) & (US$ Million)
Table 100. Middle East and Africa PVC Compound Sales by Type (2017-2022) & (K MT)
Table 101. Middle East and Africa PVC Compound Sales by Type (2023-2028) & (K MT)
Table 102. Middle East and Africa PVC Compound Revenue by Type (2017-2022) & (US$ Million)
Table 103. Middle East and Africa PVC Compound Revenue by Type (2023-2028) & (US$ Million)
Table 104. Middle East and Africa PVC Compound Sales by Application (2017-2022) & (K MT)
Table 105. Middle East and Africa PVC Compound Sales by Application (2023-2028) & (K MT)
Table 106. Middle East and Africa PVC Compound Revenue by Application (2017-2022) & (US$ Million)
Table 107. Middle East and Africa PVC Compound Revenue by Application (2023-2028) & (US$ Million)
Table 108. Middle East and Africa PVC Compound Sales by Country (2017-2022) & (K MT)
Table 109. Middle East and Africa PVC Compound Sales by Country (2023-2028) & (K MT)
Table 110. Middle East and Africa PVC Compound Revenue by Country (2017-2022) & (US$ Million)
Table 111. Middle East and Africa PVC Compound Revenue by Country (2023-2028) & (US$ Million)
Table 112. Westlake Chemical Corporation Information
Table 113. Westlake Chemical Description and Major Businesses
Table 114. Westlake Chemical PVC Compound Sales (K MT), Revenue (US$ Million), Price (USD/MT) and Gross Margin (2017-2022)
Table 115. Westlake Chemical PVC Compound Product Model Numbers, Pictures, Descriptions and Specifications
Table 116. Westlake Chemical Recent Development
Table 117. Mexichem Corporation Information
Table 118. Mexichem Description and Major Businesses
Table 119. Mexichem PVC Compound Sales (K MT), Revenue (US$ Million), Price (USD/MT) and Gross Margin (2017-2022)
Table 120. Mexichem PVC Compound Product Model Numbers, Pictures, Descriptions and Specifications
Table 121. Mexichem Recent Development
Table 122. Aurora Plastics Corporation Information
Table 123. Aurora Plastics Description and Major Businesses
Table 124. Aurora Plastics PVC Compound Sales (K MT), Revenue (US$ Million), Price (USD/MT) and Gross Margin (2017-2022)
Table 125. Aurora Plastics PVC Compound Product Model Numbers, Pictures, Descriptions and Specifications
Table 126. Aurora Plastics Recent Development
Table 127. Benvic Europe Corporation Information
Table 128. Benvic Europe Description and Major Businesses
Table 129. Benvic Europe PVC Compound Sales (K MT), Revenue (US$ Million), Price (USD/MT) and Gross Margin (2017-2022)
Table 130. Benvic Europe PVC Compound Product Model Numbers, Pictures, Descriptions and Specifications
Table 131. Benvic Europe Recent Development
Table 132. INEOS Compounds Corporation Information
Table 133. INEOS Compounds Description and Major Businesses
Table 134. INEOS Compounds PVC Compound Sales (K MT), Revenue (US$ Million), Price (USD/MT) and Gross Margin (2017-2022)
Table 135. INEOS Compounds PVC Compound Product Model Numbers, Pictures, Descriptions and Specifications
Table 136. INEOS Compounds Recent Development
Table 137. Vinyl Compounds Corporation Information
Table 138. Vinyl Compounds Description and Major Businesses
Table 139. Vinyl Compounds PVC Compound Sales (K MT), Revenue (US$ Million), Price (USD/MT) and Gross Margin (2017-2022)
Table 140. Vinyl Compounds PVC Compound Product Model Numbers, Pictures, Descriptions and Specifications
Table 141. Vinyl Compounds Recent Development
Table 142. Teknor Apex Corporation Information
Table 143. Teknor Apex Description and Major Businesses
Table 144. Teknor Apex PVC Compound Sales (K MT), Revenue (US$ Million), Price (USD/MT) and Gross Margin (2017-2022)
Table 145. Teknor Apex PVC Compound Product Model Numbers, Pictures, Descriptions and Specifications
Table 146. Teknor Apex Recent Development
Table 147. Flex Technologies Corporation Information
Table 148. Flex Technologies Description and Major Businesses
Table 149. Flex Technologies PVC Compound Sales (K MT), Revenue (US$ Million), Price (USD/MT) and Gross Margin (2017-2022)
Table 150. Flex Technologies PVC Compound Product Model Numbers, Pictures, Descriptions and Specifications
Table 151. Flex Technologies Recent Development
Table 152. Roscom Corporation Information
Table 153. Roscom Description and Major Businesses
Table 154. Roscom PVC Compound Sales (K MT), Revenue (US$ Million), Price (USD/MT) and Gross Margin (2017-2022)
Table 155. Roscom PVC Compound Product Model Numbers, Pictures, Descriptions and Specifications
Table 156. Roscom Recent Development
Table 157. EMPOL/IFFCO Corporation Information
Table 158. EMPOL/IFFCO Description and Major Businesses
Table 159. EMPOL/IFFCO PVC Compound Sales (K MT), Revenue (US$ Million), Price (USD/MT) and Gross Margin (2017-2022)
Table 160. EMPOL/IFFCO PVC Compound Product Model Numbers, Pictures, Descriptions and Specifications
Table 161. EMPOL/IFFCO Recent Development
Table 162. Cary Compound Corporation Information
Table 163. Cary Compound Description and Major Businesses
Table 164. Cary Compound PVC Compound Sales (K MT), Revenue (US$ Million), Price (USD/MT) and Gross Margin (2017-2022)
Table 165. Cary Compound PVC Compound Product Model Numbers, Pictures, Descriptions and Specifications
Table 166. Cary Compound Recent Development
Table 167. S&E Specialty Polymers Corporation Information
Table 168. S&E Specialty Polymers Description and Major Businesses
Table 169. S&E Specialty Polymers PVC Compound Sales (K MT), Revenue (US$ Million), Price (USD/MT) and Gross Margin (2017-2022)
Table 170. S&E Specialty Polymers PVC Compound Product Model Numbers, Pictures, Descriptions and Specifications
Table 171. S&E Specialty Polymers Recent Development
Table 172. Sylvin Technologies Corporation Information
Table 173. Sylvin Technologies Description and Major Businesses
Table 174. Sylvin Technologies PVC Compound Sales (K MT), Revenue (US$ Million), Price (USD/MT) and Gross Margin (2017-2022)
Table 175. Sylvin Technologies PVC Compound Product Model Numbers, Pictures, Descriptions and Specifications
Table 176. Sylvin Technologies Recent Development
Table 177. Konnark Polymer Corporation Information
Table 178. Konnark Polymer Description and Major Businesses
Table 179. Konnark Polymer PVC Compound Sales (K MT), Revenue (US$ Million), Price (USD/MT) and Gross Margin (2017-2022)
Table 180. Konnark Polymer PVC Compound Product Model Numbers, Pictures, Descriptions and Specifications
Table 181. Konnark Polymer Recent Development
Table 182. Mazda Plastic Corporation Information
Table 183. Mazda Plastic Description and Major Businesses
Table 184. Mazda Plastic PVC Compound Sales (K MT), Revenue (US$ Million), Price (USD/MT) and Gross Margin (2017-2022)
Table 185. Mazda Plastic PVC Compound Product Model Numbers, Pictures, Descriptions and Specifications
Table 186. Mazda Plastic Recent Development
Table 187. Thevinyl Corporation Information
Table 188. Thevinyl Description and Major Businesses
Table 189. Thevinyl PVC Compound Sales (K MT), Revenue (US$ Million), Price (USD/MT) and Gross Margin (2017-2022)
Table 190. Thevinyl PVC Compound Product Model Numbers, Pictures, Descriptions and Specifications
Table 191. Thevinyl Recent Development
Table 192. ACTEGA Corporation Information
Table 193. ACTEGA Description and Major Businesses
Table 194. ACTEGA PVC Compound Sales (K MT), Revenue (US$ Million), Price (USD/MT) and Gross Margin (2017-2022)
Table 195. ACTEGA PVC Compound Product Model Numbers, Pictures, Descriptions and Specifications
Table 196. ACTEGA Recent Development
Table 197. PolyOne Corporation Information
Table 198. PolyOne Description and Major Businesses
Table 199. PolyOne PVC Compound Sales (K MT), Revenue (US$ Million), Price (USD/MT) and Gross Margin (2017-2022)
Table 200. PolyOne PVC Compound Product Model Numbers, Pictures, Descriptions and Specifications
Table 201. PolyOne Recent Development
Table 202. Hanwha (Korea) Corporation Information
Table 203. Hanwha (Korea) Description and Major Businesses
Table 204. Hanwha (Korea) PVC Compound Sales (K MT), Revenue (US$ Million), Price (USD/MT) and Gross Margin (2017-2022)
Table 205. Hanwha (Korea) PVC Compound Product Model Numbers, Pictures, Descriptions and Specifications
Table 206. Hanwha (Korea) Recent Development
Table 207. Kingfa (China) Corporation Information
Table 208. Kingfa (China) Description and Major Businesses
Table 209. Kingfa (China) PVC Compound Sales (K MT), Revenue (US$ Million), Price (USD/MT) and Gross Margin (2017-2022)
Table 210. Kingfa (China) PVC Compound Product Model Numbers, Pictures, Descriptions and Specifications
Table 211. Kingfa (China) Recent Development
Table 212. Thai Plastics Corporation Information
Table 213. Thai Plastics Description and Major Businesses
Table 214. Thai Plastics PVC Compound Sales (K MT), Revenue (US$ Million), Price (USD/MT) and Gross Margin (2017-2022)
Table 215. Thai Plastics PVC Compound Product Model Numbers, Pictures, Descriptions and Specifications
Table 216. Thai Plastics Recent Development
Table 217. Key Raw Materials Lists
Table 218. Raw Materials Key Suppliers Lists
Table 219. PVC Compound Distributors List
Table 220. PVC Compound Customers List
Table 221. PVC Compound Market Trends
Table 222. PVC Compound Market Drivers
Table 223. PVC Compound Market Challenges
Table 224. PVC Compound Market Restraints
Table 225. Research Programs/Design for This Report
Table 226. Key Data Information from Secondary Sources
Table 227. Key Data Information from Primary Sources
List of Figures
Figure 1. PVC Compound Product Picture
Figure 2. Global PVC Compound Market Share by Type in 2021 & 2028
Figure 3. Non-Plasticised PVC Product Picture
Figure 4. Plasticised PVC Product Picture
Figure 5. Global PVC Compound Market Share by Application in 2021 & 2028
Figure 6. Pipe & Fitting
Figure 7. Profiles & Tubes
Figure 8. Wire & Cable
Figure 9. Film & Sheet
Figure 10. Others
Figure 11. PVC Compound Report Years Considered
Figure 12. Global PVC Compound Capacity, Production and Utilization (2017-2028) & (K MT)
Figure 13. Global PVC Compound Production Market Share by Region in Percentage: 2021 Versus 2028
Figure 14. Global PVC Compound Production Market Share by Region (2017-2022)
Figure 15. Global PVC Compound Production Market Share by Region (2023-2028)
Figure 16. PVC Compound Production Growth Rate in North America (2017-2028) & (K MT)
Figure 17. PVC Compound Production Growth Rate in Europe (2017-2028) & (K MT)
Figure 18. PVC Compound Production Growth Rate in Middle East & Africa (2017-2028) & (K MT)
Figure 19. PVC Compound Production Growth Rate in Southeast Asia (2017-2028) & (K MT)
Figure 20. PVC Compound Production Growth Rate in Japan (2017-2028) & (K MT)
Figure 21. PVC Compound Production Growth Rate in China (2017-2028) & (K MT)
Figure 22. PVC Compound Production Growth Rate in South Korea (2017-2028) & (K MT)
Figure 23. PVC Compound Production Growth Rate in India (2017-2028) & (K MT)
Figure 24. Global PVC Compound Sales 2017-2028 (K MT)
Figure 25. Global PVC Compound Revenue, (US$ Million), 2017 VS 2021 VS 2028
Figure 26. Global PVC Compound Revenue 2017-2028 (US$ Million)
Figure 27. Global PVC Compound Revenue Market Share by Region in Percentage: 2021 Versus 2028
Figure 28. Global PVC Compound Sales Market Share by Region (2017-2022)
Figure 29. Global PVC Compound Sales Market Share by Region (2023-2028)
Figure 30. North America PVC Compound Sales YoY (2017-2028) & (K MT)
Figure 31. North America PVC Compound Revenue YoY (2017-2028) & (US$ Million)
Figure 32. Europe PVC Compound Sales YoY (2017-2028) & (K MT)
Figure 33. Europe PVC Compound Revenue YoY (2017-2028) & (US$ Million)
Figure 34. Asia-Pacific PVC Compound Sales YoY (2017-2028) & (K MT)
Figure 35. Asia-Pacific PVC Compound Revenue YoY (2017-2028) & (US$ Million)
Figure 36. Latin America PVC Compound Sales YoY (2017-2028) & (K MT)
Figure 37. Latin America PVC Compound Revenue YoY (2017-2028) & (US$ Million)
Figure 38. Middle East & Africa PVC Compound Sales YoY (2017-2028) & (K MT)
Figure 39. Middle East & Africa PVC Compound Revenue YoY (2017-2028) & (US$ Million)
Figure 40. The PVC Compound Market Share of Top 10 and Top 5 Largest Manufacturers Around the World in 2021
Figure 41. The Top 5 and 10 Largest Manufacturers of PVC Compound in the World: Market Share by PVC Compound Revenue in 2021
Figure 42. PVC Compound Market Share by Company Type (Tier 1, Tier 2, and Tier 3): 2017 VS 2021
Figure 43. Global PVC Compound Sales Market Share by Type (2017-2028)
Figure 44. Global PVC Compound Revenue Market Share by Type (2017-2028)
Figure 45. Global PVC Compound Sales Market Share by Application (2017-2028)
Figure 46. Global PVC Compound Revenue Market Share by Application (2017-2028)
Figure 47. North America PVC Compound Sales Market Share by Type (2017-2028)
Figure 48. North America PVC Compound Revenue Market Share by Type (2017-2028)
Figure 49. North America PVC Compound Sales Market Share by Application (2017-2028)
Figure 50. North America PVC Compound Revenue Market Share by Application (2017-2028)
Figure 51. North America PVC Compound Sales Share by Country (2017-2028)
Figure 52. North America PVC Compound Revenue Share by Country (2017-2028)
Figure 53. U.S. PVC Compound Revenue (2017-2028) & (US$ Million)
Figure 54. Canada PVC Compound Revenue (2017-2028) & (US$ Million)
Figure 55. Europe PVC Compound Sales Market Share by Type (2017-2028)
Figure 56. Europe PVC Compound Revenue Market Share by Type (2017-2028)
Figure 57. Europe PVC Compound Sales Market Share by Application (2017-2028)
Figure 58. Europe PVC Compound Revenue Market Share by Application (2017-2028)
Figure 59. Europe PVC Compound Sales Share by Country (2017-2028)
Figure 60. Europe PVC Compound Revenue Share by Country (2017-2028)
Figure 61. Germany PVC Compound Revenue (2017-2028) & (US$ Million)
Figure 62. France PVC Compound Revenue (2017-2028) & (US$ Million)
Figure 63. U.K. PVC Compound Revenue (2017-2028) & (US$ Million)
Figure 64. Italy PVC Compound Revenue (2017-2028) & (US$ Million)
Figure 65. Russia PVC Compound Revenue (2017-2028) & (US$ Million)
Figure 66. Asia Pacific PVC Compound Sales Market Share by Type (2017-2028)
Figure 67. Asia Pacific PVC Compound Revenue Market Share by Type (2017-2028)
Figure 68. Asia Pacific PVC Compound Sales Market Share by Application (2017-2028)
Figure 69. Asia Pacific PVC Compound Revenue Market Share by Application (2017-2028)
Figure 70. Asia Pacific PVC Compound Sales Share by Region (2017-2028)
Figure 71. Asia Pacific PVC Compound Revenue Share by Region (2017-2028)
Figure 72. China PVC Compound Revenue (2017-2028) & (US$ Million)
Figure 73. Japan PVC Compound Revenue (2017-2028) & (US$ Million)
Figure 74. South Korea PVC Compound Revenue (2017-2028) & (US$ Million)
Figure 75. India PVC Compound Revenue (2017-2028) & (US$ Million)
Figure 76. Australia PVC Compound Revenue (2017-2028) & (US$ Million)
Figure 77. Taiwan PVC Compound Revenue (2017-2028) & (US$ Million)
Figure 78. Indonesia PVC Compound Revenue (2017-2028) & (US$ Million)
Figure 79. Thailand PVC Compound Revenue (2017-2028) & (US$ Million)
Figure 80. Malaysia PVC Compound Revenue (2017-2028) & (US$ Million)
Figure 81. Philippines PVC Compound Revenue (2017-2028) & (US$ Million)
Figure 82. Latin America PVC Compound Sales Market Share by Type (2017-2028)
Figure 83. Latin America PVC Compound Revenue Market Share by Type (2017-2028)
Figure 84. Latin America PVC Compound Sales Market Share by Application (2017-2028)
Figure 85. Latin America PVC Compound Revenue Market Share by Application (2017-2028)
Figure 86. Latin America PVC Compound Sales Share by Country (2017-2028)
Figure 87. Latin America PVC Compound Revenue Share by Country (2017-2028)
Figure 88. Mexico PVC Compound Revenue (2017-2028) & (US$ Million)
Figure 89. Brazil PVC Compound Revenue (2017-2028) & (US$ Million)
Figure 90. Argentina PVC Compound Revenue (2017-2028) & (US$ Million)
Figure 91. Middle East and Africa PVC Compound Sales Market Share by Type (2017-2028)
Figure 92. Middle East and Africa PVC Compound Revenue Market Share by Type (2017-2028)
Figure 93. Middle East and Africa PVC Compound Sales Market Share by Application (2017-2028)
Figure 94. Middle East and Africa PVC Compound Revenue Market Share by Application (2017-2028)
Figure 95. Middle East and Africa PVC Compound Sales Share by Country (2017-2028)
Figure 96. Middle East and Africa PVC Compound Revenue Share by Country (2017-2028)
Figure 97. Turkey PVC Compound Revenue (2017-2028) & (US$ Million)
Figure 98. Saudi Arabia PVC Compound Revenue (2017-2028) & (US$ Million)
Figure 99. U.A.E PVC Compound Revenue (2017-2028) & (US$ Million)
Figure 100. PVC Compound Value Chain
Figure 101. PVC Compound Production Process
Figure 102. Channels of Distribution
Figure 103. Distributors Profiles
Figure 104. Bottom-up and Top-down Approaches for This Report
Figure 105. Data Triangulation
Figure 106. Key Executives Interviewed
$4900
$9800
