0
U.S. (TOLL FREE)
+1 (315) 215-3225
Automative

0
U.S. (TOLL FREE)
+1 (315) 215-3225
Global Plant Protein Flour Market Research Report 2026
Published Date: 2026-03-02
|
Report Code: QYRE-Auto-15V20345
Home | Market Reports | Food & Drink| Food
Global Plant Protein Flour Market Research Report 2026
BUY CHAPTERS

Global Plant Protein Flour Market Research Report 2026

Code: QYRE-Auto-15V20345
Report
2026-03-02
Pages:133
QYResearch
Buy Now with 15% Discount
DESCRIPTION
TABLE OF CONTENT
TABLES & FIGURES

Plant Protein Flour Market Size

The global Plant Protein Flour market was valued at US$ 4500 million in 2025 and is anticipated to reach US$ 5947 million by 2032, at a CAGR of 4.0% from 2026 to 2032.

Plant Protein Flour Market

Plant Protein Flour Market

The 2025 U.S. tariff policies introduce profound uncertainty into the global economic landscape. This report critically examines the implications of recent tariff adjustments and international strategic countermeasures on Plant Protein Flour competitive dynamics, regional economic interdependencies, and supply chain reconfigurations.
Plant protein flour is a protein-enriched powder ingredient primarily derived from plants such as soy, pea, chickpea, and fava bean, produced via processes including defatting, roasting or heat treatment, milling, and classification. It is typically supplied as a pale-yellow to off-white fine flour that retains part of the starch and fiber fraction, delivering materially higher protein than conventional cereal flours and serving as a formulation base that provides both protein and functional performance in “flour form.” In practice, the category is often summarized into defatted soy protein flour and pulse-based protein flours: the former is commonly made from defatted soy meal and positioned for higher protein and low-fat attributes, while the latter is produced by milling and fractionation of pulse raw materials to achieve targeted protein levels and granulation. Key applications concentrate in bakery, noodles and staple foods for protein fortification and structure improvement, and extend to snacks and cereals, meat products and plant-based meat for binding and water retention, soups and sauces for thickening and emulsification, and feed and pet food where cost-effective protein enhancement is required.
In 2025, global plant protein flour (dominated by defatted soy protein flour and pulse-based protein-enriched flours in commercial powder form for food and feed applications) is reasonably estimated to reach about 5.0–7.0 million metric tons in annual output. On a manufacturer ex-works basis approximating FOB, mainstream pricing typically falls around USD 450–900 per metric ton, with meaningful dispersion driven by protein-grade positioning, particle size and dispersibility, heat treatment and deodorization, and food-grade compliance and allergen management.
Against the global shift toward protein-forward eating and formulation-driven cost efficiency, plant protein flour is emerging as a critical “bridge ingredient” between commodity flour and high-purity proteins. It fits mainstream bakery and staple categories with process familiarity similar to traditional flours, while offering a lower cost-per-protein route for solid foods beyond beverage-centric protein delivery. This is accelerating multi-ingredient blending systems built on protein flours and helping protein-enriched products move from niche supplements into everyday grocery shelves.
At the same time, rising sensory and consistency expectations are reshaping the competitive landscape. Managing beany off-notes and astringency, mitigating anti-nutritional factors, controlling hydration and rheology variability across origins and batches, and meeting region-specific allergen and labeling requirements are increasing the process and quality-system bar for suppliers. Downstream demand is expected to concentrate further on more consistent particle and protein grades, improved flavor and color, processing solutions such as optimized heat treatment and pregelatinization for continuous manufacturing, and stronger traceability and compliance documentation, shifting competition from scale to application performance and stability.
This report delivers a comprehensive overview of the global Plant Protein Flour market, with both quantitative and qualitative analyses, to help readers develop growth strategies, assess the competitive landscape, evaluate their position in the current market, and make informed business decisions regarding Plant Protein Flour. The Plant Protein Flour market size, estimates, and forecasts are provided in terms of sales volume (Kilotons) and revenue (US$ millions), with 2025 as the base year and historical and forecast data for 2021–2032.
The report segments the global Plant Protein Flour market comprehensively. Regional market sizes by Type, by Application, by Protein Content, and by company are also provided. For deeper insight, the report profiles the competitive landscape, key competitors, and their respective market rankings, and discusses technological trends and new product developments.
This report will assist Plant Protein Flour manufacturers, new entrants, and companies across the industry value chain with information on revenues, sales volume, and average prices for the overall market and its sub-segments, by company, by Type, by Application, and by region.
Market Segmentation

Scope of Plant Protein Flour Market Report

Report Metric Details
Report Name Plant Protein Flour Market
Accounted market size in 2025 US$ 4500 million
Forecasted market size in 2032 US$ 5947 million
CAGR 4.0%
Base Year 2025
Forecasted years 2026 - 2032
Segment by Type
  • Soy Protein Flour
  • Pea Protein Flour
  • Wheat Protein Flour
  • Others
Segment by Protein Content
  • Medium Protein (40% to 60%)
  • Standard Protein (20% to 40%)
  • Blended or Fortified Flour
Segment by Target Industry
  • Industrial Food Manufacturing
  • Foodservice and Catering
  • Retail for Home Baking and Cooking
  • Others
Segment by Distribution Channel
  • Business-to-Business Ingredient Supply
  • Wholesale and Distributors
  • Retail Packaging for Consumers
  • Others
by Application
  • Bakery and Snack Products
  • Meat and Seafood Alternatives
  • Noodles, Pasta and Extruded Foods
  • Others
Consumption by Region
  • North America (United States, Canada)
  • Europe (Germany, France, UK, Italy, Russia)
  • Asia-Pacific (China, Japan, South Korea, Taiwan)
  • Southeast Asia (India)
  • Latin America (Mexico, Brazil)
By Company Shandong Yuxin Bio-Tech Co., Ltd., Shandong Sanwei Soybean Protein Co., Ltd., Shandong Huangshi Food Co., Ltd., Xinrui Group, Henan Kunhua Biotechnology Co., Ltd., Shandong Yuwang Ecological Food Industry Co., Ltd., Zaozhuang Jinshan Soy Products Co., Ltd., Gushen Biotechnology Group Co., Ltd., Shandong Wonderful Biotech Co., Ltd., Ningbo Sobo Protein Technology Co., Ltd., Archer Daniels Midland Company, Cargill, Incorporated, CHS Inc., Ingredion Incorporated, AGT Food and Ingredients Inc., Limagrain Ingredients, Essantis Pty Ltd, Sonic Biochem Extractions Pvt. Ltd., Grain Processing Corporation, Benson Hill, Inc.
Forecast units USD million in value
Report coverage Revenue and volume forecast, company share, competitive landscape, growth factors and trends

Chapter Outline

  • Chapter 1: Defines the scope of the report and presents an executive summary of market segments (by Type, by Application, by Protein Content, etc.), including the size of each segment and its future growth potential. It offers a high-level view of the current market and its likely evolution in the short, medium, and long term.
  • Chapter 2: Provides a detailed analysis of the competitive landscape for Plant Protein Flour manufacturers, covering pricing, sales and revenue shares, latest development plans, and mergers and acquisitions.
  • Chapter 3: Examines Plant Protein Flour sales and revenue at the regional and country levels. It quantifies market size and growth potential for each region and its key countries, and outlines market development, outlook, addressable space, and national market size.
  • Chapter 4: Analyzes segments by Type, detailing the size and growth potential of each segment to help readers identify “blue ocean” opportunities.
  • Chapter 5: Analyzes market segments by Application, covering the size and growth potential of each segment to help readers identify “blue ocean” opportunities in downstream markets.
  • Chapter 6: Profiles key players, presenting core information on leading companies, including product sales, revenue, pricing, gross margin, product portfolio/introductions, and recent developments.
  • Chapter 7: Reviews the industry value chain, including upstream and downstream segments.
  • Chapter 8: Discusses market dynamics and recent developments, including drivers, restraints, challenges and risks for manufacturers, U.S. Tariffs and relevant policy analysis.
  • Chapter 9: Summarizes the key findings and conclusions of the report.

FAQ for this report

How fast is Plant Protein Flour Market growing?

Ans: The Plant Protein Flour Market witnessing a CAGR of 4.0% during the forecast period 2026-2032.

What is the Plant Protein Flour Market size in 2032?

Ans: The Plant Protein Flour Market size in 2032 will be US$ 5947 million.

Who are the main players in the Plant Protein Flour Market report?

Ans: The main players in the Plant Protein Flour Market are Shandong Yuxin Bio-Tech Co., Ltd., Shandong Sanwei Soybean Protein Co., Ltd., Shandong Huangshi Food Co., Ltd., Xinrui Group, Henan Kunhua Biotechnology Co., Ltd., Shandong Yuwang Ecological Food Industry Co., Ltd., Zaozhuang Jinshan Soy Products Co., Ltd., Gushen Biotechnology Group Co., Ltd., Shandong Wonderful Biotech Co., Ltd., Ningbo Sobo Protein Technology Co., Ltd., Archer Daniels Midland Company, Cargill, Incorporated, CHS Inc., Ingredion Incorporated, AGT Food and Ingredients Inc., Limagrain Ingredients, Essantis Pty Ltd, Sonic Biochem Extractions Pvt. Ltd., Grain Processing Corporation, Benson Hill, Inc.

What are the Application segmentation covered in the Plant Protein Flour Market report?

Ans: The Applications covered in the Plant Protein Flour Market report are Bakery and Snack Products, Meat and Seafood Alternatives, Noodles, Pasta and Extruded Foods, Others

What are the Type segmentation covered in the Plant Protein Flour Market report?

Ans: The Types covered in the Plant Protein Flour Market report are Soy Protein Flour, Pea Protein Flour, Wheat Protein Flour, Others

1 Plant Protein Flour Market Overview
1.1 Product Definition
1.2 Plant Protein Flour by Type
1.2.1 Global Plant Protein Flour Market Value by Type: 2025 vs 2032
1.2.2 Soy Protein Flour
1.2.3 Pea Protein Flour
1.2.4 Wheat Protein Flour
1.2.5 Others
1.3 Plant Protein Flour by Protein Content
1.3.1 Global Plant Protein Flour Market Value by Protein Content: 2025 vs 2032
1.3.2 Medium Protein (40% to 60%)
1.3.3 Standard Protein (20% to 40%)
1.3.4 Blended or Fortified Flour
1.4 Plant Protein Flour by Target Industry
1.4.1 Global Plant Protein Flour Market Value by Target Industry: 2025 vs 2032
1.4.2 Industrial Food Manufacturing
1.4.3 Foodservice and Catering
1.4.4 Retail for Home Baking and Cooking
1.4.5 Others
1.5 Plant Protein Flour by Distribution Channel
1.5.1 Global Plant Protein Flour Market Value by Distribution Channel: 2025 vs 2032
1.5.2 Business-to-Business Ingredient Supply
1.5.3 Wholesale and Distributors
1.5.4 Retail Packaging for Consumers
1.5.5 Others
1.6 Plant Protein Flour by Application
1.6.1 Global Plant Protein Flour Market Value by Application: 2025 vs 2032
1.6.2 Bakery and Snack Products
1.6.3 Meat and Seafood Alternatives
1.6.4 Noodles, Pasta and Extruded Foods
1.6.5 Others
1.7 Global Plant Protein Flour Market Size Estimates and Forecasts
1.7.1 Global Plant Protein Flour Revenue 2021–2032
1.7.2 Global Plant Protein Flour Sales 2021–2032
1.7.3 Global Plant Protein Flour Market Average Price (2021–2032)
1.8 Assumptions and Limitations
2 Plant Protein Flour Market Competition by Manufacturers
2.1 Global Plant Protein Flour Sales Market Share by Manufacturers (2021–2026)
2.2 Global Plant Protein Flour Revenue Market Share by Manufacturers (2021–2026)
2.3 Global Plant Protein Flour Average Price by Manufacturers (2021–2026)
2.4 Global Key Players of Plant Protein Flour, Industry Ranking, 2023 vs 2024 vs 2025
2.5 Global Key Manufacturers of Plant Protein Flour, Manufacturing Sites and Headquarters
2.6 Global Key Manufacturers of Plant Protein Flour, Product Types and Applications
2.7 Global Key Manufacturers of Plant Protein Flour, Date of Entry into the Industry
2.8 Global Plant Protein Flour Market Competitive Situation and Trends
2.8.1 Global Plant Protein Flour Market Concentration Rate
2.8.2 The Top 5 and Top 10 Global Plant Protein Flour Players Market Share by Revenue
2.8.3 Global Plant Protein Flour Market Share by Company Tier (Tier 1, Tier 2, Tier 3)
2.9 Manufacturers Mergers & Acquisitions, Expansion Plans
3 Global Plant Protein Flour Market Scenario by Region
3.1 Global Plant Protein Flour Market Size by Region: 2021 vs 2025 vs 2032
3.2 Global Plant Protein Flour Sales by Region: 2021–2032
3.2.1 Global Plant Protein Flour Sales by Region: 2021–2026
3.2.2 Global Plant Protein Flour Sales by Region: 2027–2032
3.3 Global Plant Protein Flour Revenue by Region: 2021–2032
3.3.1 Global Plant Protein Flour Revenue by Region: 2021–2026
3.3.2 Global Plant Protein Flour Revenue by Region: 2027–2032
3.4 North America Plant Protein Flour Market Facts & Figures by Country
3.4.1 North America Plant Protein Flour Market Size by Country: 2021 vs 2025 vs 2032
3.4.2 North America Plant Protein Flour Sales by Country (2021–2032)
3.4.3 North America Plant Protein Flour Revenue by Country (2021–2032)
3.4.4 U.S.
3.4.5 Canada
3.5 Europe Plant Protein Flour Market Facts & Figures by Country
3.5.1 Europe Plant Protein Flour Market Size by Country: 2021 vs 2025 vs 2032
3.5.2 Europe Plant Protein Flour Sales by Country (2021–2032)
3.5.3 Europe Plant Protein Flour Revenue by Country (2021–2032)
3.5.4 Germany
3.5.5 France
3.5.6 U.K.
3.5.7 Italy
3.5.8 Russia
3.6 Asia Pacific Plant Protein Flour Market Facts & Figures by Region
3.6.1 Asia Pacific Plant Protein Flour Market Size by Region: 2021 vs 2025 vs 2032
3.6.2 Asia Pacific Plant Protein Flour Sales by Region (2021–2032)
3.6.3 Asia Pacific Plant Protein Flour Revenue by Region (2021–2032)
3.6.4 China
3.6.5 Japan
3.6.6 South Korea
3.6.7 India
3.6.8 Australia
3.6.9 Taiwan
3.6.10 Indonesia
3.6.11 Thailand
3.6.12 Malaysia
3.6.13 Philippines
3.7 Latin America Plant Protein Flour Market Facts & Figures by Country
3.7.1 Latin America Plant Protein Flour Market Size by Country: 2021 vs 2025 vs 2032
3.7.2 Latin America Plant Protein Flour Sales by Country (2021–2032)
3.7.3 Latin America Plant Protein Flour Revenue by Country (2021–2032)
3.7.4 Mexico
3.7.5 Brazil
3.7.6 Argentina
3.8 Middle East and Africa Plant Protein Flour Market Facts & Figures by Country
3.8.1 Middle East and Africa Plant Protein Flour Market Size by Country: 2021 vs 2025 vs 2032
3.8.2 Middle East and Africa Plant Protein Flour Sales by Country (2021–2032)
3.8.3 Middle East and Africa Plant Protein Flour Revenue by Country (2021–2032)
3.8.4 Turkey
3.8.5 Saudi Arabia
3.8.6 UAE
4 Segment by Type
4.1 Global Plant Protein Flour Sales by Type (2021–2032)
4.1.1 Global Plant Protein Flour Sales by Type (2021–2026)
4.1.2 Global Plant Protein Flour Sales by Type (2027–2032)
4.1.3 Global Plant Protein Flour Sales Market Share by Type (2021–2032)
4.2 Global Plant Protein Flour Revenue by Type (2021–2032)
4.2.1 Global Plant Protein Flour Revenue by Type (2021–2026)
4.2.2 Global Plant Protein Flour Revenue by Type (2027–2032)
4.2.3 Global Plant Protein Flour Revenue Market Share by Type (2021–2032)
4.3 Global Plant Protein Flour Price by Type (2021–2032)
5 Segment by Application
5.1 Global Plant Protein Flour Sales by Application (2021–2032)
5.1.1 Global Plant Protein Flour Sales by Application (2021–2026)
5.1.2 Global Plant Protein Flour Sales by Application (2027–2032)
5.1.3 Global Plant Protein Flour Sales Market Share by Application (2021–2032)
5.2 Global Plant Protein Flour Revenue by Application (2021–2032)
5.2.1 Global Plant Protein Flour Revenue by Application (2021–2026)
5.2.2 Global Plant Protein Flour Revenue by Application (2027–2032)
5.2.3 Global Plant Protein Flour Revenue Market Share by Application (2021–2032)
5.3 Global Plant Protein Flour Price by Application (2021–2032)
6 Key Companies Profiled
6.1 Shandong Yuxin Bio-Tech Co., Ltd.
6.1.1 Shandong Yuxin Bio-Tech Co., Ltd. Company Information
6.1.2 Shandong Yuxin Bio-Tech Co., Ltd. Description and Business Overview
6.1.3 Shandong Yuxin Bio-Tech Co., Ltd. Plant Protein Flour Sales, Revenue, and Gross Margin (2021–2026)
6.1.4 Shandong Yuxin Bio-Tech Co., Ltd. Plant Protein Flour Product Portfolio
6.1.5 Shandong Yuxin Bio-Tech Co., Ltd. Recent Developments/Updates
6.2 Shandong Sanwei Soybean Protein Co., Ltd.
6.2.1 Shandong Sanwei Soybean Protein Co., Ltd. Company Information
6.2.2 Shandong Sanwei Soybean Protein Co., Ltd. Description and Business Overview
6.2.3 Shandong Sanwei Soybean Protein Co., Ltd. Plant Protein Flour Sales, Revenue, and Gross Margin (2021–2026)
6.2.4 Shandong Sanwei Soybean Protein Co., Ltd. Plant Protein Flour Product Portfolio
6.2.5 Shandong Sanwei Soybean Protein Co., Ltd. Recent Developments/Updates
6.3 Shandong Huangshi Food Co., Ltd.
6.3.1 Shandong Huangshi Food Co., Ltd. Company Information
6.3.2 Shandong Huangshi Food Co., Ltd. Description and Business Overview
6.3.3 Shandong Huangshi Food Co., Ltd. Plant Protein Flour Sales, Revenue, and Gross Margin (2021–2026)
6.3.4 Shandong Huangshi Food Co., Ltd. Plant Protein Flour Product Portfolio
6.3.5 Shandong Huangshi Food Co., Ltd. Recent Developments/Updates
6.4 Xinrui Group
6.4.1 Xinrui Group Company Information
6.4.2 Xinrui Group Description and Business Overview
6.4.3 Xinrui Group Plant Protein Flour Sales, Revenue, and Gross Margin (2021–2026)
6.4.4 Xinrui Group Plant Protein Flour Product Portfolio
6.4.5 Xinrui Group Recent Developments/Updates
6.5 Henan Kunhua Biotechnology Co., Ltd.
6.5.1 Henan Kunhua Biotechnology Co., Ltd. Company Information
6.5.2 Henan Kunhua Biotechnology Co., Ltd. Description and Business Overview
6.5.3 Henan Kunhua Biotechnology Co., Ltd. Plant Protein Flour Sales, Revenue, and Gross Margin (2021–2026)
6.5.4 Henan Kunhua Biotechnology Co., Ltd. Plant Protein Flour Product Portfolio
6.5.5 Henan Kunhua Biotechnology Co., Ltd. Recent Developments/Updates
6.6 Shandong Yuwang Ecological Food Industry Co., Ltd.
6.6.1 Shandong Yuwang Ecological Food Industry Co., Ltd. Company Information
6.6.2 Shandong Yuwang Ecological Food Industry Co., Ltd. Description and Business Overview
6.6.3 Shandong Yuwang Ecological Food Industry Co., Ltd. Plant Protein Flour Sales, Revenue, and Gross Margin (2021–2026)
6.6.4 Shandong Yuwang Ecological Food Industry Co., Ltd. Plant Protein Flour Product Portfolio
6.6.5 Shandong Yuwang Ecological Food Industry Co., Ltd. Recent Developments/Updates
6.7 Zaozhuang Jinshan Soy Products Co., Ltd.
6.7.1 Zaozhuang Jinshan Soy Products Co., Ltd. Company Information
6.7.2 Zaozhuang Jinshan Soy Products Co., Ltd. Description and Business Overview
6.7.3 Zaozhuang Jinshan Soy Products Co., Ltd. Plant Protein Flour Sales, Revenue, and Gross Margin (2021–2026)
6.7.4 Zaozhuang Jinshan Soy Products Co., Ltd. Plant Protein Flour Product Portfolio
6.7.5 Zaozhuang Jinshan Soy Products Co., Ltd. Recent Developments/Updates
6.8 Gushen Biotechnology Group Co., Ltd.
6.8.1 Gushen Biotechnology Group Co., Ltd. Company Information
6.8.2 Gushen Biotechnology Group Co., Ltd. Description and Business Overview
6.8.3 Gushen Biotechnology Group Co., Ltd. Plant Protein Flour Sales, Revenue, and Gross Margin (2021–2026)
6.8.4 Gushen Biotechnology Group Co., Ltd. Plant Protein Flour Product Portfolio
6.8.5 Gushen Biotechnology Group Co., Ltd. Recent Developments/Updates
6.9 Shandong Wonderful Biotech Co., Ltd.
6.9.1 Shandong Wonderful Biotech Co., Ltd. Company Information
6.9.2 Shandong Wonderful Biotech Co., Ltd. Description and Business Overview
6.9.3 Shandong Wonderful Biotech Co., Ltd. Plant Protein Flour Sales, Revenue, and Gross Margin (2021–2026)
6.9.4 Shandong Wonderful Biotech Co., Ltd. Plant Protein Flour Product Portfolio
6.9.5 Shandong Wonderful Biotech Co., Ltd. Recent Developments/Updates
6.10 Ningbo Sobo Protein Technology Co., Ltd.
6.10.1 Ningbo Sobo Protein Technology Co., Ltd. Company Information
6.10.2 Ningbo Sobo Protein Technology Co., Ltd. Description and Business Overview
6.10.3 Ningbo Sobo Protein Technology Co., Ltd. Plant Protein Flour Sales, Revenue, and Gross Margin (2021–2026)
6.10.4 Ningbo Sobo Protein Technology Co., Ltd. Plant Protein Flour Product Portfolio
6.10.5 Ningbo Sobo Protein Technology Co., Ltd. Recent Developments/Updates
6.11 Archer Daniels Midland Company
6.11.1 Archer Daniels Midland Company Company Information
6.11.2 Archer Daniels Midland Company Description and Business Overview
6.11.3 Archer Daniels Midland Company Plant Protein Flour Sales, Revenue, and Gross Margin (2021–2026)
6.11.4 Archer Daniels Midland Company Plant Protein Flour Product Portfolio
6.11.5 Archer Daniels Midland Company Recent Developments/Updates
6.12 Cargill, Incorporated
6.12.1 Cargill, Incorporated Company Information
6.12.2 Cargill, Incorporated Description and Business Overview
6.12.3 Cargill, Incorporated Plant Protein Flour Sales, Revenue, and Gross Margin (2021–2026)
6.12.4 Cargill, Incorporated Plant Protein Flour Product Portfolio
6.12.5 Cargill, Incorporated Recent Developments/Updates
6.13 CHS Inc.
6.13.1 CHS Inc. Company Information
6.13.2 CHS Inc. Description and Business Overview
6.13.3 CHS Inc. Plant Protein Flour Sales, Revenue, and Gross Margin (2021–2026)
6.13.4 CHS Inc. Plant Protein Flour Product Portfolio
6.13.5 CHS Inc. Recent Developments/Updates
6.14 Ingredion Incorporated
6.14.1 Ingredion Incorporated Company Information
6.14.2 Ingredion Incorporated Description and Business Overview
6.14.3 Ingredion Incorporated Plant Protein Flour Sales, Revenue, and Gross Margin (2021–2026)
6.14.4 Ingredion Incorporated Plant Protein Flour Product Portfolio
6.14.5 Ingredion Incorporated Recent Developments/Updates
6.15 AGT Food and Ingredients Inc.
6.15.1 AGT Food and Ingredients Inc. Company Information
6.15.2 AGT Food and Ingredients Inc. Description and Business Overview
6.15.3 AGT Food and Ingredients Inc. Plant Protein Flour Sales, Revenue, and Gross Margin (2021–2026)
6.15.4 AGT Food and Ingredients Inc. Plant Protein Flour Product Portfolio
6.15.5 AGT Food and Ingredients Inc. Recent Developments/Updates
6.16 Limagrain Ingredients
6.16.1 Limagrain Ingredients Company Information
6.16.2 Limagrain Ingredients Description and Business Overview
6.16.3 Limagrain Ingredients Plant Protein Flour Sales, Revenue, and Gross Margin (2021–2026)
6.16.4 Limagrain Ingredients Plant Protein Flour Product Portfolio
6.16.5 Limagrain Ingredients Recent Developments/Updates
6.17 Essantis Pty Ltd
6.17.1 Essantis Pty Ltd Company Information
6.17.2 Essantis Pty Ltd Description and Business Overview
6.17.3 Essantis Pty Ltd Plant Protein Flour Sales, Revenue, and Gross Margin (2021–2026)
6.17.4 Essantis Pty Ltd Plant Protein Flour Product Portfolio
6.17.5 Essantis Pty Ltd Recent Developments/Updates
6.18 Sonic Biochem Extractions Pvt. Ltd.
6.18.1 Sonic Biochem Extractions Pvt. Ltd. Company Information
6.18.2 Sonic Biochem Extractions Pvt. Ltd. Description and Business Overview
6.18.3 Sonic Biochem Extractions Pvt. Ltd. Plant Protein Flour Sales, Revenue, and Gross Margin (2021–2026)
6.18.4 Sonic Biochem Extractions Pvt. Ltd. Plant Protein Flour Product Portfolio
6.18.5 Sonic Biochem Extractions Pvt. Ltd. Recent Developments/Updates
6.19 Grain Processing Corporation
6.19.1 Grain Processing Corporation Company Information
6.19.2 Grain Processing Corporation Description and Business Overview
6.19.3 Grain Processing Corporation Plant Protein Flour Sales, Revenue, and Gross Margin (2021–2026)
6.19.4 Grain Processing Corporation Plant Protein Flour Product Portfolio
6.19.5 Grain Processing Corporation Recent Developments/Updates
6.20 Benson Hill, Inc.
6.20.1 Benson Hill, Inc. Company Information
6.20.2 Benson Hill, Inc. Description and Business Overview
6.20.3 Benson Hill, Inc. Plant Protein Flour Sales, Revenue, and Gross Margin (2021–2026)
6.20.4 Benson Hill, Inc. Plant Protein Flour Product Portfolio
6.20.5 Benson Hill, Inc. Recent Developments/Updates
7 Industry Chain and Sales Channels Analysis
7.1 Plant Protein Flour Industry Chain Analysis
7.2 Plant Protein Flour Raw Material Supply Analysis
7.2.1 Key Raw Materials
7.2.2 Raw Materials Key Suppliers
7.3 Plant Protein Flour Production Mode & Process Analysis
7.4 Plant Protein Flour Sales and Marketing
7.4.1 Plant Protein Flour Sales Channels
7.4.2 Plant Protein Flour Distributors
7.5 Plant Protein Flour Customer Analysis
8 Plant Protein Flour Market Dynamics
8.1 Plant Protein Flour Industry Trends
8.2 Plant Protein Flour Market Drivers
8.3 Plant Protein Flour Market Challenges
8.4 Plant Protein Flour Market Restraints
8.5 Impact of U.S. Tariffs
9 Research Findings and Conclusion
10 Methodology and Data Source
10.1 Methodology/Research Approach
10.1.1 Research Programs/Design
10.1.2 Market Size Estimation
10.1.3 Market Breakdown and Data Triangulation
10.2 Data Source
10.2.1 Secondary Sources
10.2.2 Primary Sources
10.3 Author List
10.4 Disclaimer
List of Tables
 Table 1. Global Plant Protein Flour Market Value by Type (US$ Million), 2025 vs 2032
 Table 2. Global Plant Protein Flour Market Value by Protein Content (US$ Million), 2025 vs 2032
 Table 3. Global Plant Protein Flour Market Value by Target Industry (US$ Million), 2025 vs 2032
 Table 4. Global Plant Protein Flour Market Value by Distribution Channel (US$ Million), 2025 vs 2032
 Table 5. Global Plant Protein Flour Market Value by Application (US$ Million), 2025 vs 2032
 Table 6. Global Plant Protein Flour Market Competitive Situation by Manufacturers in 2025
 Table 7. Global Plant Protein Flour Sales (Kilotons) of Key Manufacturers (2021–2026)
 Table 8. Global Plant Protein Flour Sales Market Share by Manufacturers (2021–2026)
 Table 9. Global Plant Protein Flour Revenue (US$ Million) by Manufacturers (2021–2026)
 Table 10. Global Plant Protein Flour Revenue Share by Manufacturers (2021–2026)
 Table 11. Global Market Plant Protein Flour Average Price (US$/Ton) of Key Manufacturers (2021–2026)
 Table 12. Global Key Players of Plant Protein Flour, Industry Ranking, 2023 vs 2024 vs 2025
 Table 13. Global Key Manufacturers of Plant Protein Flour, Manufacturing Sites and Headquarters
 Table 14. Global Key Manufacturers of Plant Protein Flour, Product Types and Applications
 Table 15. Global Key Manufacturers of Plant Protein Flour, Date of Entry into the Industry
 Table 16. Global Manufacturers Market Concentration Ratio (CR5 and HHI)
 Table 17. Global Plant Protein Flour Companies by Tier (Tier 1, Tier 2, Tier 3), based on Plant Protein Flour Revenue, 2025
 Table 18. Manufacturers Mergers & Acquisitions, Expansion Plans
 Table 19. Global Plant Protein Flour Market Size by Region (US$ Million): 2021 vs 2025 vs 2032
 Table 20. Global Plant Protein Flour Sales by Region (Kilotons), 2021–2026
 Table 21. Global Plant Protein Flour Sales Market Share by Region (2021–2026)
 Table 22. Global Plant Protein Flour Sales by Region (Kilotons), 2027–2032
 Table 23. Global Plant Protein Flour Sales Market Share by Region (2027–2032)
 Table 24. Global Plant Protein Flour Revenue by Region (US$ Million), 2021–2026
 Table 25. Global Plant Protein Flour Revenue Market Share by Region (2021–2026)
 Table 26. Global Plant Protein Flour Revenue by Region (US$ Million), 2027–2032
 Table 27. Global Plant Protein Flour Revenue Market Share by Region (2027–2032)
 Table 28. North America Plant Protein Flour Revenue by Country: 2021 vs 2025 vs 2032 (US$ Million)
 Table 29. North America Plant Protein Flour Sales by Country (Kilotons), 2021–2026
 Table 30. North America Plant Protein Flour Sales by Country (Kilotons), 2027–2032
 Table 31. North America Plant Protein Flour Revenue by Country (US$ Million), 2021–2026
 Table 32. North America Plant Protein Flour Revenue by Country (US$ Million), 2027–2032
 Table 33. Europe Plant Protein Flour Revenue by Country: 2021 vs 2025 vs 2032 (US$ Million)
 Table 34. Europe Plant Protein Flour Sales by Country (Kilotons), 2021–2026
 Table 35. Europe Plant Protein Flour Sales by Country (Kilotons), 2027–2032
 Table 36. Europe Plant Protein Flour Revenue by Country (US$ Million), 2021–2026
 Table 37. Europe Plant Protein Flour Revenue by Country (US$ Million), 2027–2032
 Table 38. Asia Pacific Plant Protein Flour Revenue by Region: 2021 vs 2025 vs 2032 (US$ Million)
 Table 39. Asia Pacific Plant Protein Flour Sales by Region (Kilotons), 2021–2026
 Table 40. Asia Pacific Plant Protein Flour Sales by Region (Kilotons), 2027–2032
 Table 41. Asia Pacific Plant Protein Flour Revenue by Region (US$ Million), 2021–2026
 Table 42. Asia Pacific Plant Protein Flour Revenue by Region (US$ Million), 2027–2032
 Table 43. Latin America Plant Protein Flour Revenue by Country: 2021 vs 2025 vs 2032 (US$ Million)
 Table 44. Latin America Plant Protein Flour Sales by Country (Kilotons), 2021–2026
 Table 45. Latin America Plant Protein Flour Sales by Country (Kilotons), 2027–2032
 Table 46. Latin America Plant Protein Flour Revenue by Country (US$ Million), 2021–2026
 Table 47. Latin America Plant Protein Flour Revenue by Country (US$ Million), 2027–2032
 Table 48. Middle East and Africa Plant Protein Flour Revenue by Country: 2021 vs 2025 vs 2032 (US$ Million)
 Table 49. Middle East and Africa Plant Protein Flour Sales by Country (Kilotons), 2021–2026
 Table 50. Middle East and Africa Plant Protein Flour Sales by Country (Kilotons), 2027–2032
 Table 51. Middle East and Africa Plant Protein Flour Revenue by Country (US$ Million), 2021–2026
 Table 52. Middle East and Africa Plant Protein Flour Revenue by Country (US$ Million), 2027–2032
 Table 53. Global Plant Protein Flour Sales (Kilotons) by Type (2021–2026)
 Table 54. Global Plant Protein Flour Sales (Kilotons) by Type (2027–2032)
 Table 55. Global Plant Protein Flour Sales Market Share by Type (2021–2026)
 Table 56. Global Plant Protein Flour Sales Market Share by Type (2027–2032)
 Table 57. Global Plant Protein Flour Revenue (US$ Million) by Type (2021–2026)
 Table 58. Global Plant Protein Flour Revenue (US$ Million) by Type (2027–2032)
 Table 59. Global Plant Protein Flour Revenue Market Share by Type (2021–2026)
 Table 60. Global Plant Protein Flour Revenue Market Share by Type (2027–2032)
 Table 61. Global Plant Protein Flour Price (US$/Ton) by Type (2021–2026)
 Table 62. Global Plant Protein Flour Price (US$/Ton) by Type (2027–2032)
 Table 63. Global Plant Protein Flour Sales (Kilotons) by Application (2021–2026)
 Table 64. Global Plant Protein Flour Sales (Kilotons) by Application (2027–2032)
 Table 65. Global Plant Protein Flour Sales Market Share by Application (2021–2026)
 Table 66. Global Plant Protein Flour Sales Market Share by Application (2027–2032)
 Table 67. Global Plant Protein Flour Revenue (US$ Million) by Application (2021–2026)
 Table 68. Global Plant Protein Flour Revenue (US$ Million) by Application (2027–2032)
 Table 69. Global Plant Protein Flour Revenue Market Share by Application (2021–2026)
 Table 70. Global Plant Protein Flour Revenue Market Share by Application (2027–2032)
 Table 71. Global Plant Protein Flour Price (US$/Ton) by Application (2021–2026)
 Table 72. Global Plant Protein Flour Price (US$/Ton) by Application (2027–2032)
 Table 73. Shandong Yuxin Bio-Tech Co., Ltd. Company Information
 Table 74. Shandong Yuxin Bio-Tech Co., Ltd. Description and Business Overview
 Table 75. Shandong Yuxin Bio-Tech Co., Ltd. Plant Protein Flour Sales (Kilotons), Revenue (US$ Million), Price (US$/Ton), and Gross Margin (2021–2026)
 Table 76. Shandong Yuxin Bio-Tech Co., Ltd. Plant Protein Flour Product
 Table 77. Shandong Yuxin Bio-Tech Co., Ltd. Recent Developments/Updates
 Table 78. Shandong Sanwei Soybean Protein Co., Ltd. Company Information
 Table 79. Shandong Sanwei Soybean Protein Co., Ltd. Description and Business Overview
 Table 80. Shandong Sanwei Soybean Protein Co., Ltd. Plant Protein Flour Sales (Kilotons), Revenue (US$ Million), Price (US$/Ton), and Gross Margin (2021–2026)
 Table 81. Shandong Sanwei Soybean Protein Co., Ltd. Plant Protein Flour Product
 Table 82. Shandong Sanwei Soybean Protein Co., Ltd. Recent Developments/Updates
 Table 83. Shandong Huangshi Food Co., Ltd. Company Information
 Table 84. Shandong Huangshi Food Co., Ltd. Description and Business Overview
 Table 85. Shandong Huangshi Food Co., Ltd. Plant Protein Flour Sales (Kilotons), Revenue (US$ Million), Price (US$/Ton), and Gross Margin (2021–2026)
 Table 86. Shandong Huangshi Food Co., Ltd. Plant Protein Flour Product
 Table 87. Shandong Huangshi Food Co., Ltd. Recent Developments/Updates
 Table 88. Xinrui Group Company Information
 Table 89. Xinrui Group Description and Business Overview
 Table 90. Xinrui Group Plant Protein Flour Sales (Kilotons), Revenue (US$ Million), Price (US$/Ton), and Gross Margin (2021–2026)
 Table 91. Xinrui Group Plant Protein Flour Product
 Table 92. Xinrui Group Recent Developments/Updates
 Table 93. Henan Kunhua Biotechnology Co., Ltd. Company Information
 Table 94. Henan Kunhua Biotechnology Co., Ltd. Description and Business Overview
 Table 95. Henan Kunhua Biotechnology Co., Ltd. Plant Protein Flour Sales (Kilotons), Revenue (US$ Million), Price (US$/Ton), and Gross Margin (2021–2026)
 Table 96. Henan Kunhua Biotechnology Co., Ltd. Plant Protein Flour Product
 Table 97. Henan Kunhua Biotechnology Co., Ltd. Recent Developments/Updates
 Table 98. Shandong Yuwang Ecological Food Industry Co., Ltd. Company Information
 Table 99. Shandong Yuwang Ecological Food Industry Co., Ltd. Description and Business Overview
 Table 100. Shandong Yuwang Ecological Food Industry Co., Ltd. Plant Protein Flour Sales (Kilotons), Revenue (US$ Million), Price (US$/Ton), and Gross Margin (2021–2026)
 Table 101. Shandong Yuwang Ecological Food Industry Co., Ltd. Plant Protein Flour Product
 Table 102. Shandong Yuwang Ecological Food Industry Co., Ltd. Recent Developments/Updates
 Table 103. Zaozhuang Jinshan Soy Products Co., Ltd. Company Information
 Table 104. Zaozhuang Jinshan Soy Products Co., Ltd. Description and Business Overview
 Table 105. Zaozhuang Jinshan Soy Products Co., Ltd. Plant Protein Flour Sales (Kilotons), Revenue (US$ Million), Price (US$/Ton), and Gross Margin (2021–2026)
 Table 106. Zaozhuang Jinshan Soy Products Co., Ltd. Plant Protein Flour Product
 Table 107. Zaozhuang Jinshan Soy Products Co., Ltd. Recent Developments/Updates
 Table 108. Gushen Biotechnology Group Co., Ltd. Company Information
 Table 109. Gushen Biotechnology Group Co., Ltd. Description and Business Overview
 Table 110. Gushen Biotechnology Group Co., Ltd. Plant Protein Flour Sales (Kilotons), Revenue (US$ Million), Price (US$/Ton), and Gross Margin (2021–2026)
 Table 111. Gushen Biotechnology Group Co., Ltd. Plant Protein Flour Product
 Table 112. Gushen Biotechnology Group Co., Ltd. Recent Developments/Updates
 Table 113. Shandong Wonderful Biotech Co., Ltd. Company Information
 Table 114. Shandong Wonderful Biotech Co., Ltd. Description and Business Overview
 Table 115. Shandong Wonderful Biotech Co., Ltd. Plant Protein Flour Sales (Kilotons), Revenue (US$ Million), Price (US$/Ton), and Gross Margin (2021–2026)
 Table 116. Shandong Wonderful Biotech Co., Ltd. Plant Protein Flour Product
 Table 117. Shandong Wonderful Biotech Co., Ltd. Recent Developments/Updates
 Table 118. Ningbo Sobo Protein Technology Co., Ltd. Company Information
 Table 119. Ningbo Sobo Protein Technology Co., Ltd. Description and Business Overview
 Table 120. Ningbo Sobo Protein Technology Co., Ltd. Plant Protein Flour Sales (Kilotons), Revenue (US$ Million), Price (US$/Ton), and Gross Margin (2021–2026)
 Table 121. Ningbo Sobo Protein Technology Co., Ltd. Plant Protein Flour Product
 Table 122. Ningbo Sobo Protein Technology Co., Ltd. Recent Developments/Updates
 Table 123. Archer Daniels Midland Company Company Information
 Table 124. Archer Daniels Midland Company Description and Business Overview
 Table 125. Archer Daniels Midland Company Plant Protein Flour Sales (Kilotons), Revenue (US$ Million), Price (US$/Ton), and Gross Margin (2021–2026)
 Table 126. Archer Daniels Midland Company Plant Protein Flour Product
 Table 127. Archer Daniels Midland Company Recent Developments/Updates
 Table 128. Cargill, Incorporated Company Information
 Table 129. Cargill, Incorporated Description and Business Overview
 Table 130. Cargill, Incorporated Plant Protein Flour Sales (Kilotons), Revenue (US$ Million), Price (US$/Ton), and Gross Margin (2021–2026)
 Table 131. Cargill, Incorporated Plant Protein Flour Product
 Table 132. Cargill, Incorporated Recent Developments/Updates
 Table 133. CHS Inc. Company Information
 Table 134. CHS Inc. Description and Business Overview
 Table 135. CHS Inc. Plant Protein Flour Sales (Kilotons), Revenue (US$ Million), Price (US$/Ton), and Gross Margin (2021–2026)
 Table 136. CHS Inc. Plant Protein Flour Product
 Table 137. CHS Inc. Recent Developments/Updates
 Table 138. Ingredion Incorporated Company Information
 Table 139. Ingredion Incorporated Description and Business Overview
 Table 140. Ingredion Incorporated Plant Protein Flour Sales (Kilotons), Revenue (US$ Million), Price (US$/Ton), and Gross Margin (2021–2026)
 Table 141. Ingredion Incorporated Plant Protein Flour Product
 Table 142. Ingredion Incorporated Recent Developments/Updates
 Table 143. AGT Food and Ingredients Inc. Company Information
 Table 144. AGT Food and Ingredients Inc. Description and Business Overview
 Table 145. AGT Food and Ingredients Inc. Plant Protein Flour Sales (Kilotons), Revenue (US$ Million), Price (US$/Ton), and Gross Margin (2021–2026)
 Table 146. AGT Food and Ingredients Inc. Plant Protein Flour Product
 Table 147. AGT Food and Ingredients Inc. Recent Developments/Updates
 Table 148. Limagrain Ingredients Company Information
 Table 149. Limagrain Ingredients Description and Business Overview
 Table 150. Limagrain Ingredients Plant Protein Flour Sales (Kilotons), Revenue (US$ Million), Price (US$/Ton), and Gross Margin (2021–2026)
 Table 151. Limagrain Ingredients Plant Protein Flour Product
 Table 152. Limagrain Ingredients Recent Developments/Updates
 Table 153. Essantis Pty Ltd Company Information
 Table 154. Essantis Pty Ltd Description and Business Overview
 Table 155. Essantis Pty Ltd Plant Protein Flour Sales (Kilotons), Revenue (US$ Million), Price (US$/Ton), and Gross Margin (2021–2026)
 Table 156. Essantis Pty Ltd Plant Protein Flour Product
 Table 157. Essantis Pty Ltd Recent Developments/Updates
 Table 158. Sonic Biochem Extractions Pvt. Ltd. Company Information
 Table 159. Sonic Biochem Extractions Pvt. Ltd. Description and Business Overview
 Table 160. Sonic Biochem Extractions Pvt. Ltd. Plant Protein Flour Sales (Kilotons), Revenue (US$ Million), Price (US$/Ton), and Gross Margin (2021–2026)
 Table 161. Sonic Biochem Extractions Pvt. Ltd. Plant Protein Flour Product
 Table 162. Sonic Biochem Extractions Pvt. Ltd. Recent Developments/Updates
 Table 163. Grain Processing Corporation Company Information
 Table 164. Grain Processing Corporation Description and Business Overview
 Table 165. Grain Processing Corporation Plant Protein Flour Sales (Kilotons), Revenue (US$ Million), Price (US$/Ton), and Gross Margin (2021–2026)
 Table 166. Grain Processing Corporation Plant Protein Flour Product
 Table 167. Grain Processing Corporation Recent Developments/Updates
 Table 168. Benson Hill, Inc. Company Information
 Table 169. Benson Hill, Inc. Description and Business Overview
 Table 170. Benson Hill, Inc. Plant Protein Flour Sales (Kilotons), Revenue (US$ Million), Price (US$/Ton), and Gross Margin (2021–2026)
 Table 171. Benson Hill, Inc. Plant Protein Flour Product
 Table 172. Benson Hill, Inc. Recent Developments/Updates
 Table 173. Key Raw Materials Lists
 Table 174. Raw Materials Key Suppliers Lists
 Table 175. Plant Protein Flour Distributors List
 Table 176. Plant Protein Flour Customers List
 Table 177. Plant Protein Flour Market Trends
 Table 178. Plant Protein Flour Market Drivers
 Table 179. Plant Protein Flour Market Challenges
 Table 180. Plant Protein Flour Market Restraints
 Table 181. Research Programs/Design for This Report
 Table 182. Key Data Information from Secondary Sources
 Table 183. Key Data Information from Primary Sources
 Table 184. Authors List of This Report


List of Figures
 Figure 1. Product Picture of Plant Protein Flour
 Figure 2. Global Plant Protein Flour Market Value by Type (US$ Million), 2021–2032
 Figure 3. Global Plant Protein Flour Market Share by Type: 2025 & 2032
 Figure 4. Soy Protein Flour Product Picture
 Figure 5. Pea Protein Flour Product Picture
 Figure 6. Wheat Protein Flour Product Picture
 Figure 7. Others Product Picture
 Figure 8. Global Plant Protein Flour Market Value by Protein Content (US$ Million), 2021–2032
 Figure 9. Global Plant Protein Flour Market Share by Protein Content: 2025 vs 2032
 Figure 10. Medium Protein (40% to 60%) Product Picture
 Figure 11. Standard Protein (20% to 40%) Product Picture
 Figure 12. Blended or Fortified Flour Product Picture
 Figure 13. Global Plant Protein Flour Market Value by Target Industry (US$ Million), 2021–2032
 Figure 14. Global Plant Protein Flour Market Share by Target Industry: 2025 vs 2032
 Figure 15. Industrial Food Manufacturing Product Picture
 Figure 16. Foodservice and Catering Product Picture
 Figure 17. Retail for Home Baking and Cooking Product Picture
 Figure 18. Others Product Picture
 Figure 19. Global Plant Protein Flour Market Value by Distribution Channel (US$ Million), 2021–2032
 Figure 20. Global Plant Protein Flour Market Share by Distribution Channel: 2025 vs 2032
 Figure 21. Business-to-Business Ingredient Supply Product Picture
 Figure 22. Wholesale and Distributors Product Picture
 Figure 23. Retail Packaging for Consumers Product Picture
 Figure 24. Others Product Picture
 Figure 25. Global Plant Protein Flour Market Value by Application (US$ Million), 2021–2032
 Figure 26. Global Plant Protein Flour Market Share by Application: 2025 & 2032
 Figure 27. Bakery and Snack Products
 Figure 28. Meat and Seafood Alternatives
 Figure 29. Noodles, Pasta and Extruded Foods
 Figure 30. Others
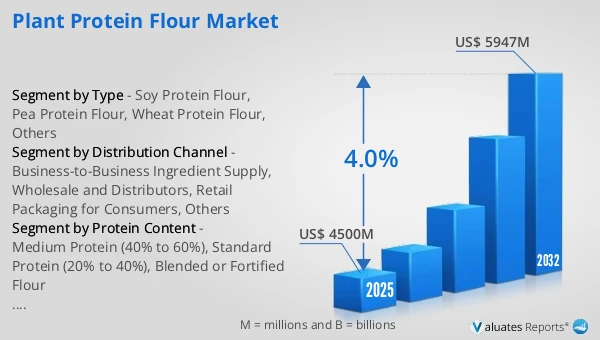
 Figure 31. Global Plant Protein Flour Revenue, (US$ Million), 2021 vs 2025 vs 2032
 Figure 32. Global Plant Protein Flour Market Size (US$ Million), 2021–2032
 Figure 33. Global Plant Protein Flour Sales (Kilotons), 2021–2032
 Figure 34. Global Plant Protein Flour Average Price (US$/Ton), 2021–2032
 Figure 35. Plant Protein Flour Report Years Considered
 Figure 36. Plant Protein Flour Sales Share by Manufacturers in 2025
 Figure 37. Global Plant Protein Flour Revenue Share by Manufacturers in 2025
 Figure 38. Top 5 and Top 10 Global Plant Protein Flour Players: Market Share by Revenue in Plant Protein Flour in 2025
 Figure 39. Plant Protein Flour Market Share by Company Type (Tier 1, Tier 2, and Tier 3): 2021 vs 2025
 Figure 40. Global Plant Protein Flour Market Size by Region (US$ Million): 2021 vs 2025 vs 2032
 Figure 41. North America Plant Protein Flour Sales Market Share by Country (2021–2032)
 Figure 42. North America Plant Protein Flour Revenue Market Share by Country (2021–2032)
 Figure 43. U.S. Plant Protein Flour Revenue Growth Rate (US$ Million), 2021–2032
 Figure 44. Canada Plant Protein Flour Revenue Growth Rate (US$ Million), 2021–2032
 Figure 45. Europe Plant Protein Flour Sales Market Share by Country (2021–2032)
 Figure 46. Europe Plant Protein Flour Revenue Market Share by Country (2021–2032)
 Figure 47. Germany Plant Protein Flour Revenue Growth Rate (US$ Million), 2021–2032
 Figure 48. France Plant Protein Flour Revenue Growth Rate (US$ Million), 2021–2032
 Figure 49. U.K. Plant Protein Flour Revenue Growth Rate (US$ Million), 2021–2032
 Figure 50. Italy Plant Protein Flour Revenue Growth Rate (US$ Million), 2021–2032
 Figure 51. Russia Plant Protein Flour Revenue Growth Rate (US$ Million), 2021–2032
 Figure 52. Asia Pacific Plant Protein Flour Sales Market Share by Region (2021–2032)
 Figure 53. Asia Pacific Plant Protein Flour Revenue Market Share by Region (2021–2032)
 Figure 54. China Plant Protein Flour Revenue Growth Rate (US$ Million), 2021–2032
 Figure 55. Japan Plant Protein Flour Revenue Growth Rate (US$ Million), 2021–2032
 Figure 56. South Korea Plant Protein Flour Revenue Growth Rate (US$ Million), 2021–2032
 Figure 57. India Plant Protein Flour Revenue Growth Rate (US$ Million), 2021–2032
 Figure 58. Australia Plant Protein Flour Revenue Growth Rate (US$ Million), 2021–2032
 Figure 59. Taiwan Plant Protein Flour Revenue Growth Rate (US$ Million), 2021–2032
 Figure 60. Indonesia Plant Protein Flour Revenue Growth Rate (US$ Million), 2021–2032
 Figure 61. Thailand Plant Protein Flour Revenue Growth Rate (US$ Million), 2021–2032
 Figure 62. Malaysia Plant Protein Flour Revenue Growth Rate (US$ Million), 2021–2032
 Figure 63. Philippines Plant Protein Flour Revenue Growth Rate (US$ Million), 2021–2032
 Figure 64. Latin America Plant Protein Flour Sales Market Share by Country (2021–2032)
 Figure 65. Latin America Plant Protein Flour Revenue Market Share by Country (2021–2032)
 Figure 66. Mexico Plant Protein Flour Revenue Growth Rate (US$ Million), 2021–2032
 Figure 67. Brazil Plant Protein Flour Revenue Growth Rate (US$ Million), 2021–2032
 Figure 68. Argentina Plant Protein Flour Revenue Growth Rate (US$ Million), 2021–2032
 Figure 69. Middle East and Africa Plant Protein Flour Sales Market Share by Country (2021–2032)
 Figure 70. Middle East and Africa Plant Protein Flour Revenue Market Share by Country (2021–2032)
 Figure 71. Turkey Plant Protein Flour Revenue Growth Rate (US$ Million), 2021–2032
 Figure 72. Saudi Arabia Plant Protein Flour Revenue Growth Rate (US$ Million), 2021–2032
 Figure 73. UAE Plant Protein Flour Revenue Growth Rate (US$ Million), 2021–2032
 Figure 74. Global Sales Market Share of Plant Protein Flour by Type (2021–2032)
 Figure 75. Global Revenue Market Share of Plant Protein Flour by Type (2021–2032)
 Figure 76. Global Plant Protein Flour Price (US$/Ton) by Type (2021–2032)
 Figure 77. Global Sales Market Share of Plant Protein Flour by Application (2021–2032)
 Figure 78. Global Revenue Market Share of Plant Protein Flour by Application (2021–2032)
 Figure 79. Global Plant Protein Flour Price (US$/Ton) by Application (2021–2032)
 Figure 80. Plant Protein Flour Value Chain
 Figure 81. Channels of Distribution (Direct Vs Distribution)
 Figure 82. Bottom-up and Top-down Approaches for This Report
 Figure 83. Data Triangulation
 Figure 84. Key Executives Interviewed
SELECT A FORMAT
Added to Cart
Electronic

$2900

Single User License
Electronic

$4350

Multi User License
Electronic

$5800

Enterprise License
Add to Cart
Buy Now (15% Discount)

OUR CUSTOMER

Strategic Venue Partners

SIMILAR REPORTS