List of Tables
Table 1. Pain Relievers Market Trends
Table 2. Pain Relievers Market Drivers & Opportunity
Table 3. Pain Relievers Market Challenges
Table 4. Pain Relievers Market Restraints
Table 5. Global Pain Relievers Revenue by Company (2019-2024) & (US$ Million)
Table 6. Global Pain Relievers Revenue Market Share by Company (2019-2024)
Table 7. Key Companies Pain Relievers Manufacturing Base Distribution and Headquarters
Table 8. Key Companies Pain Relievers Product Type
Table 9. Key Companies Time to Begin Mass Production of Pain Relievers
Table 10. Global Pain Relievers Companies Market Concentration Ratio (CR5 and HHI)
Table 11. Global Top Companies Market Share by Company Type (Tier 1, Tier 2, and Tier 3) & (based on the Revenue in Pain Relievers as of 2023)
Table 12. Mergers & Acquisitions, Expansion Plans
Table 13. Global Pain Relievers Sales Value by Type: 2019 VS 2023 VS 2030 (US$ Million)
Table 14. Global Pain Relievers Sales Value by Type (2019-2024) & (US$ Million)
Table 15. Global Pain Relievers Sales Value by Type (2025-2030) & (US$ Million)
Table 16. Global Pain Relievers Sales Market Share in Value by Type (2019-2024) & (%)
Table 17. Global Pain Relievers Sales Market Share in Value by Type (2025-2030) & (%)
Table 18. Global Pain Relievers Sales Value by Application: 2019 VS 2023 VS 2030 (US$ Million)
Table 19. Global Pain Relievers Sales Value by Application (2019-2024) & (US$ Million)
Table 20. Global Pain Relievers Sales Value by Application (2025-2030) & (US$ Million)
Table 21. Global Pain Relievers Sales Market Share in Value by Application (2019-2024) & (%)
Table 22. Global Pain Relievers Sales Market Share in Value by Application (2025-2030) & (%)
Table 23. Global Pain Relievers Sales Value by Region: 2019 VS 2023 VS 2030 (US$ Million)
Table 24. Global Pain Relievers Sales Value by Region (2019-2024) & (US$ Million)
Table 25. Global Pain Relievers Sales Value by Region (2025-2030) & (US$ Million)
Table 26. Global Pain Relievers Sales Value by Region (2019-2024) & (%)
Table 27. Global Pain Relievers Sales Value by Region (2025-2030) & (%)
Table 28. Key Countries/Regions Pain Relievers Sales Value Growth Trends, (US$ Million): 2019 VS 2023 VS 2030
Table 29. Key Countries/Regions Pain Relievers Sales Value, (2019-2024) & (US$ Million)
Table 30. Key Countries/Regions Pain Relievers Sales Value, (2025-2030) & (US$ Million)
Table 31. Pfizer Basic Information List
Table 32. Pfizer Description and Business Overview
Table 33. Pfizer Pain Relievers Products, Services and Solutions
Table 34. Revenue (US$ Million) in Pain Relievers Business of Pfizer (2019-2024)
Table 35. Pfizer Recent Developments
Table 36. GSK Basic Information List
Table 37. GSK Description and Business Overview
Table 38. GSK Pain Relievers Products, Services and Solutions
Table 39. Revenue (US$ Million) in Pain Relievers Business of GSK (2019-2024)
Table 40. GSK Recent Developments
Table 41. Grunenthal Basic Information List
Table 42. Grunenthal Description and Business Overview
Table 43. Grunenthal Pain Relievers Products, Services and Solutions
Table 44. Revenue (US$ Million) in Pain Relievers Business of Grunenthal (2019-2024)
Table 45. Grunenthal Recent Developments
Table 46. Bayer Basic Information List
Table 47. Bayer Description and Business Overview
Table 48. Bayer Pain Relievers Products, Services and Solutions
Table 49. Revenue (US$ Million) in Pain Relievers Business of Bayer (2019-2024)
Table 50. Bayer Recent Developments
Table 51. Sanofi Basic Information List
Table 52. Sanofi Description and Business Overview
Table 53. Sanofi Pain Relievers Products, Services and Solutions
Table 54. Revenue (US$ Million) in Pain Relievers Business of Sanofi (2019-2024)
Table 55. Sanofi Recent Developments
Table 56. Eli Lilly Basic Information List
Table 57. Eli Lilly Description and Business Overview
Table 58. Eli Lilly Pain Relievers Products, Services and Solutions
Table 59. Revenue (US$ Million) in Pain Relievers Business of Eli Lilly (2019-2024)
Table 60. Eli Lilly Recent Developments
Table 61. AstraZeneca Basic Information List
Table 62. AstraZeneca Description and Business Overview
Table 63. AstraZeneca Pain Relievers Products, Services and Solutions
Table 64. Revenue (US$ Million) in Pain Relievers Business of AstraZeneca (2019-2024)
Table 65. AstraZeneca Recent Developments
Table 66. Endo Basic Information List
Table 67. Endo Description and Business Overview
Table 68. Endo Pain Relievers Products, Services and Solutions
Table 69. Revenue (US$ Million) in Pain Relievers Business of Endo (2019-2024)
Table 70. Endo Recent Developments
Table 71. Merck Basic Information List
Table 72. Merck Description and Business Overview
Table 73. Merck Pain Relievers Products, Services and Solutions
Table 74. Revenue (US$ Million) in Pain Relievers Business of Merck (2019-2024)
Table 75. Merck Recent Developments
Table 76. Depomed Basic Information List
Table 77. Depomed Description and Business Overview
Table 78. Depomed Pain Relievers Products, Services and Solutions
Table 79. Revenue (US$ Million) in Pain Relievers Business of Depomed (2019-2024)
Table 80. Depomed Recent Developments
Table 81. Yunnan Baiyao Basic Information List
Table 82. Yunnan Baiyao Description and Business Overview
Table 83. Yunnan Baiyao Pain Relievers Products, Services and Solutions
Table 84. Revenue (US$ Million) in Pain Relievers Business of Yunnan Baiyao (2019-2024)
Table 85. Yunnan Baiyao Recent Developments
Table 86. Teva Basic Information List
Table 87. Teva Description and Business Overview
Table 88. Teva Pain Relievers Products, Services and Solutions
Table 89. Revenue (US$ Million) in Pain Relievers Business of Teva (2019-2024)
Table 90. Teva Recent Developments
Table 91. J&J Basic Information List
Table 92. J&J Description and Business Overview
Table 93. J&J Pain Relievers Products, Services and Solutions
Table 94. Revenue (US$ Million) in Pain Relievers Business of J&J (2019-2024)
Table 95. J&J Recent Developments
Table 96. Allergan Basic Information List
Table 97. Allergan Description and Business Overview
Table 98. Allergan Pain Relievers Products, Services and Solutions
Table 99. Revenue (US$ Million) in Pain Relievers Business of Allergan (2019-2024)
Table 100. Allergan Recent Developments
Table 101. Purdue Basic Information List
Table 102. Purdue Description and Business Overview
Table 103. Purdue Pain Relievers Products, Services and Solutions
Table 104. Revenue (US$ Million) in Pain Relievers Business of Purdue (2019-2024)
Table 105. Purdue Recent Developments
Table 106. Reckitt Benckiser Group Plc Basic Information List
Table 107. Reckitt Benckiser Group Plc Description and Business Overview
Table 108. Reckitt Benckiser Group Plc Pain Relievers Products, Services and Solutions
Table 109. Revenue (US$ Million) in Pain Relievers Business of Reckitt Benckiser Group Plc (2019-2024)
Table 110. Reckitt Benckiser Group Plc Recent Developments
Table 111. Novartis AG Basic Information List
Table 112. Novartis AG Description and Business Overview
Table 113. Novartis AG Pain Relievers Products, Services and Solutions
Table 114. Revenue (US$ Million) in Pain Relievers Business of Novartis AG (2019-2024)
Table 115. Novartis AG Recent Developments
Table 116. Topical BioMedics Basic Information List
Table 117. Topical BioMedics Description and Business Overview
Table 118. Topical BioMedics Pain Relievers Products, Services and Solutions
Table 119. Revenue (US$ Million) in Pain Relievers Business of Topical BioMedics (2019-2024)
Table 120. Topical BioMedics Recent Developments
Table 121. AdvaCare Pharma Basic Information List
Table 122. AdvaCare Pharma Description and Business Overview
Table 123. AdvaCare Pharma Pain Relievers Products, Services and Solutions
Table 124. Revenue (US$ Million) in Pain Relievers Business of AdvaCare Pharma (2019-2024)
Table 125. AdvaCare Pharma Recent Developments
Table 126. Sun Pharmaceutical Basic Information List
Table 127. Sun Pharmaceutical Description and Business Overview
Table 128. Sun Pharmaceutical Pain Relievers Products, Services and Solutions
Table 129. Revenue (US$ Million) in Pain Relievers Business of Sun Pharmaceutical (2019-2024)
Table 130. Sun Pharmaceutical Recent Developments
Table 131. Key Raw Materials Lists
Table 132. Raw Materials Key Suppliers Lists
Table 133. Pain Relievers Downstream Customers
Table 134. Pain Relievers Distributors List
Table 135. Research Programs/Design for This Report
Table 136. Key Data Information from Secondary Sources
Table 137. Key Data Information from Primary Sources
Table 138. Business Unit and Senior & Team Lead Analysts
List of Figures
Figure 1. Pain Relievers Product Picture
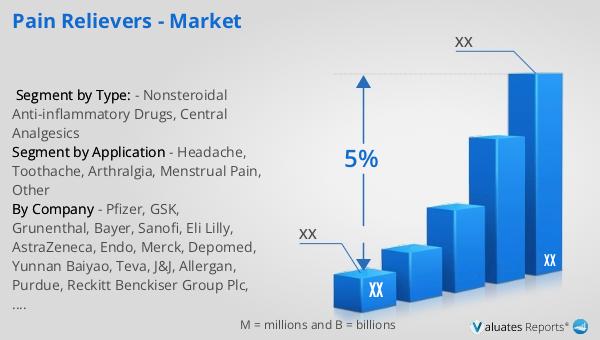
Figure 2. Global Pain Relievers Sales Value, 2019 VS 2023 VS 2030 (US$ Million)
Figure 3. Global Pain Relievers Sales Value (2019-2030) & (US$ Million)
Figure 4. Pain Relievers Report Years Considered
Figure 5. Global Pain Relievers Players Revenue Ranking (2023) & (US$ Million)
Figure 6. The 5 and 10 Largest Manufacturers in the World: Market Share by Pain Relievers Revenue in 2023
Figure 7. Pain Relievers Market Share by Company Type (Tier 1, Tier 2, and Tier 3): 2019 VS 2023
Figure 8. Nonsteroidal Anti-inflammatory Drugs Picture
Figure 9. Central Analgesics Picture
Figure 10. Global Pain Relievers Sales Value by Type (2019 VS 2023 VS 2030) & (US$ Million)
Figure 11. Global Pain Relievers Sales Value Market Share by Type, 2023 & 2030
Figure 12. Product Picture of Headache
Figure 13. Product Picture of Toothache
Figure 14. Product Picture of Arthralgia
Figure 15. Product Picture of Menstrual Pain
Figure 16. Product Picture of Other
Figure 17. Global Pain Relievers Sales Value by Application (2019 VS 2023 VS 2030) & (US$ Million)
Figure 18. Global Pain Relievers Sales Value Market Share by Application, 2023 & 2030
Figure 19. North America Pain Relievers Sales Value (2019-2030) & (US$ Million)
Figure 20. North America Pain Relievers Sales Value by Country (%), 2023 VS 2030
Figure 21. Europe Pain Relievers Sales Value (2019-2030) & (US$ Million)
Figure 22. Europe Pain Relievers Sales Value by Country (%), 2023 VS 2030
Figure 23. Asia Pacific Pain Relievers Sales Value (2019-2030) & (US$ Million)
Figure 24. Asia Pacific Pain Relievers Sales Value by Country (%), 2023 VS 2030
Figure 25. South America Pain Relievers Sales Value (2019-2030) & (US$ Million)
Figure 26. South America Pain Relievers Sales Value by Country (%), 2023 VS 2030
Figure 27. Middle East & Africa Pain Relievers Sales Value (2019-2030) & (US$ Million)
Figure 28. Middle East & Africa Pain Relievers Sales Value by Country (%), 2023 VS 2030
Figure 29. Key Countries/Regions Pain Relievers Sales Value (%), (2019-2030)
Figure 30. United States Pain Relievers Sales Value, (2019-2030) & (US$ Million)
Figure 31. United States Pain Relievers Sales Value by Type (%), 2023 VS 2030
Figure 32. United States Pain Relievers Sales Value by Application (%), 2023 VS 2030
Figure 33. Europe Pain Relievers Sales Value, (2019-2030) & (US$ Million)
Figure 34. Europe Pain Relievers Sales Value by Type (%), 2023 VS 2030
Figure 35. Europe Pain Relievers Sales Value by Application (%), 2023 VS 2030
Figure 36. China Pain Relievers Sales Value, (2019-2030) & (US$ Million)
Figure 37. China Pain Relievers Sales Value by Type (%), 2023 VS 2030
Figure 38. China Pain Relievers Sales Value by Application (%), 2023 VS 2030
Figure 39. Japan Pain Relievers Sales Value, (2019-2030) & (US$ Million)
Figure 40. Japan Pain Relievers Sales Value by Type (%), 2023 VS 2030
Figure 41. Japan Pain Relievers Sales Value by Application (%), 2023 VS 2030
Figure 42. South Korea Pain Relievers Sales Value, (2019-2030) & (US$ Million)
Figure 43. South Korea Pain Relievers Sales Value by Type (%), 2023 VS 2030
Figure 44. South Korea Pain Relievers Sales Value by Application (%), 2023 VS 2030
Figure 45. Southeast Asia Pain Relievers Sales Value, (2019-2030) & (US$ Million)
Figure 46. Southeast Asia Pain Relievers Sales Value by Type (%), 2023 VS 2030
Figure 47. Southeast Asia Pain Relievers Sales Value by Application (%), 2023 VS 2030
Figure 48. India Pain Relievers Sales Value, (2019-2030) & (US$ Million)
Figure 49. India Pain Relievers Sales Value by Type (%), 2023 VS 2030
Figure 50. India Pain Relievers Sales Value by Application (%), 2023 VS 2030
Figure 51. Pain Relievers Industrial Chain
Figure 52. Pain Relievers Manufacturing Cost Structure
Figure 53. Channels of Distribution (Direct Sales, and Distribution)
Figure 54. Bottom-up and Top-down Approaches for This Report
Figure 55. Data Triangulation