List of Tables
Table 1. Arm-type Automatic Blood Pressure Monitor Market Trends
Table 2. Arm-type Automatic Blood Pressure Monitor Market Drivers & Opportunity
Table 3. Arm-type Automatic Blood Pressure Monitor Market Challenges
Table 4. Arm-type Automatic Blood Pressure Monitor Market Restraints
Table 5. Global Arm-type Automatic Blood Pressure Monitor Revenue by Company (2020-2025) & (US$ Million)
Table 6. Global Arm-type Automatic Blood Pressure Monitor Revenue Market Share by Company (2020-2025)
Table 7. Global Arm-type Automatic Blood Pressure Monitor Sales Volume by Company (2020-2025) & (K Units)
Table 8. Global Arm-type Automatic Blood Pressure Monitor Sales Volume Market Share by Company (2020-2025)
Table 9. Global Market Arm-type Automatic Blood Pressure Monitor Price by Company (2020-2025) & (US$/Unit)
Table 10. Key Manufacturers Arm-type Automatic Blood Pressure Monitor Manufacturing Base and Headquarters
Table 11. Key Manufacturers Arm-type Automatic Blood Pressure Monitor Product Type
Table 12. Key Manufacturers Time to Begin Mass Production of Arm-type Automatic Blood Pressure Monitor
Table 13. Global Arm-type Automatic Blood Pressure Monitor Manufacturers Market Concentration Ratio (CR5 and HHI)
Table 14. Global Top Manufacturers Market Share by Company Type (Tier 1, Tier 2, and Tier 3) & (based on the Revenue in Arm-type Automatic Blood Pressure Monitor as of 2024)
Table 15. Mergers & Acquisitions, Expansion Plans
Table 16. Global Arm-type Automatic Blood Pressure Monitor Sales Value by Type: 2020 VS 2024 VS 2031 (US$ Million)
Table 17. Global Arm-type Automatic Blood Pressure Monitor Sales Value by Type (2020-2025) & (US$ Million)
Table 18. Global Arm-type Automatic Blood Pressure Monitor Sales Value by Type (2026-2031) & (US$ Million)
Table 19. Global Arm-type Automatic Blood Pressure Monitor Sales Market Share in Value by Type (2020-2025)
Table 20. Global Arm-type Automatic Blood Pressure Monitor Sales Market Share in Value by Type (2026-2031)
Table 21. Global Arm-type Automatic Blood Pressure Monitor Sales Volume by Type: 2020 VS 2024 VS 2031 (K Units)
Table 22. Global Arm-type Automatic Blood Pressure Monitor Sales Volume by Type (2020-2025) & (K Units)
Table 23. Global Arm-type Automatic Blood Pressure Monitor Sales Volume by Type (2026-2031) & (K Units)
Table 24. Global Arm-type Automatic Blood Pressure Monitor Sales Market Share in Volume by Type (2020-2025)
Table 25. Global Arm-type Automatic Blood Pressure Monitor Sales Market Share in Volume by Type (2026-2031)
Table 26. Global Arm-type Automatic Blood Pressure Monitor Price by Type (2020-2025) & (US$/Unit)
Table 27. Global Arm-type Automatic Blood Pressure Monitor Price by Type (2026-2031) & (US$/Unit)
Table 28. Global Arm-type Automatic Blood Pressure Monitor Sales Value by Application: 2020 VS 2024 VS 2031 (US$ Million)
Table 29. Global Arm-type Automatic Blood Pressure Monitor Sales Value by Application (2020-2025) & (US$ Million)
Table 30. Global Arm-type Automatic Blood Pressure Monitor Sales Value by Application (2026-2031) & (US$ Million)
Table 31. Global Arm-type Automatic Blood Pressure Monitor Sales Market Share in Value by Application (2020-2025)
Table 32. Global Arm-type Automatic Blood Pressure Monitor Sales Market Share in Value by Application (2026-2031)
Table 33. Global Arm-type Automatic Blood Pressure Monitor Sales Volume by Application: 2020 VS 2024 VS 2031 (K Units)
Table 34. Global Arm-type Automatic Blood Pressure Monitor Sales Volume by Application (2020-2025) & (K Units)
Table 35. Global Arm-type Automatic Blood Pressure Monitor Sales Volume by Application (2026-2031) & (K Units)
Table 36. Global Arm-type Automatic Blood Pressure Monitor Sales Market Share in Volume by Application (2020-2025)
Table 37. Global Arm-type Automatic Blood Pressure Monitor Sales Market Share in Volume by Application (2026-2031)
Table 38. Global Arm-type Automatic Blood Pressure Monitor Price by Application (2020-2025) & (US$/Unit)
Table 39. Global Arm-type Automatic Blood Pressure Monitor Price by Application (2026-2031) & (US$/Unit)
Table 40. Global Arm-type Automatic Blood Pressure Monitor Sales Value by Region, (2020 VS 2024 VS 2031) & (US$ Million)
Table 41. Global Arm-type Automatic Blood Pressure Monitor Sales Value by Region (2020-2025) & (US$ Million)
Table 42. Global Arm-type Automatic Blood Pressure Monitor Sales Value by Region (2026-2031) & (US$ Million)
Table 43. Global Arm-type Automatic Blood Pressure Monitor Sales Value by Region (2020-2025) & (%)
Table 44. Global Arm-type Automatic Blood Pressure Monitor Sales Value by Region (2026-2031) & (%)
Table 45. Global Arm-type Automatic Blood Pressure Monitor Sales Volume by Region (K Units): 2020 VS 2024 VS 2031
Table 46. Global Arm-type Automatic Blood Pressure Monitor Sales Volume by Region (2020-2025) & (K Units)
Table 47. Global Arm-type Automatic Blood Pressure Monitor Sales Volume by Region (2026-2031) & (K Units)
Table 48. Global Arm-type Automatic Blood Pressure Monitor Sales Volume by Region (2020-2025) & (%)
Table 49. Global Arm-type Automatic Blood Pressure Monitor Sales Volume by Region (2026-2031) & (%)
Table 50. Global Arm-type Automatic Blood Pressure Monitor Average Price by Region (2020-2025) & (US$/Unit)
Table 51. Global Arm-type Automatic Blood Pressure Monitor Average Price by Region (2026-2031) & (US$/Unit)
Table 52. Key Countries/Regions Arm-type Automatic Blood Pressure Monitor Sales Value Growth Trends, (US$ Million): 2020 VS 2024 VS 2031
Table 53. Key Countries/Regions Arm-type Automatic Blood Pressure Monitor Sales Value, (2020-2025) & (US$ Million)
Table 54. Key Countries/Regions Arm-type Automatic Blood Pressure Monitor Sales Value, (2026-2031) & (US$ Million)
Table 55. Key Countries/Regions Arm-type Automatic Blood Pressure Monitor Sales Volume, (2020-2025) & (K Units)
Table 56. Key Countries/Regions Arm-type Automatic Blood Pressure Monitor Sales Volume, (2026-2031) & (K Units)
Table 57. Omron Healthcare Company Information
Table 58. Omron Healthcare Introduction and Business Overview
Table 59. Omron Healthcare Arm-type Automatic Blood Pressure Monitor Sales (K Units), Revenue (US$ Million), Price (US$/Unit) and Gross Margin (2020-2025)
Table 60. Omron Healthcare Arm-type Automatic Blood Pressure Monitor Product Offerings
Table 61. Omron Healthcare Recent Development
Table 62. A&D Medical Company Information
Table 63. A&D Medical Introduction and Business Overview
Table 64. A&D Medical Arm-type Automatic Blood Pressure Monitor Sales (K Units), Revenue (US$ Million), Price (US$/Unit) and Gross Margin (2020-2025)
Table 65. A&D Medical Arm-type Automatic Blood Pressure Monitor Product Offerings
Table 66. A&D Medical Recent Development
Table 67. Beurer Company Information
Table 68. Beurer Introduction and Business Overview
Table 69. Beurer Arm-type Automatic Blood Pressure Monitor Sales (K Units), Revenue (US$ Million), Price (US$/Unit) and Gross Margin (2020-2025)
Table 70. Beurer Arm-type Automatic Blood Pressure Monitor Product Offerings
Table 71. Beurer Recent Development
Table 72. Microlife Corporation Company Information
Table 73. Microlife Corporation Introduction and Business Overview
Table 74. Microlife Corporation Arm-type Automatic Blood Pressure Monitor Sales (K Units), Revenue (US$ Million), Price (US$/Unit) and Gross Margin (2020-2025)
Table 75. Microlife Corporation Arm-type Automatic Blood Pressure Monitor Product Offerings
Table 76. Microlife Corporation Recent Development
Table 77. Kinetik Medical Devices Company Information
Table 78. Kinetik Medical Devices Introduction and Business Overview
Table 79. Kinetik Medical Devices Arm-type Automatic Blood Pressure Monitor Sales (K Units), Revenue (US$ Million), Price (US$/Unit) and Gross Margin (2020-2025)
Table 80. Kinetik Medical Devices Arm-type Automatic Blood Pressure Monitor Product Offerings
Table 81. Kinetik Medical Devices Recent Development
Table 82. Paul Hartmann Company Information
Table 83. Paul Hartmann Introduction and Business Overview
Table 84. Paul Hartmann Arm-type Automatic Blood Pressure Monitor Sales (K Units), Revenue (US$ Million), Price (US$/Unit) and Gross Margin (2020-2025)
Table 85. Paul Hartmann Arm-type Automatic Blood Pressure Monitor Product Offerings
Table 86. Paul Hartmann Recent Development
Table 87. Drive Medical Company Information
Table 88. Drive Medical Introduction and Business Overview
Table 89. Drive Medical Arm-type Automatic Blood Pressure Monitor Sales (K Units), Revenue (US$ Million), Price (US$/Unit) and Gross Margin (2020-2025)
Table 90. Drive Medical Arm-type Automatic Blood Pressure Monitor Product Offerings
Table 91. Drive Medical Recent Development
Table 92. Arise Medical Company Information
Table 93. Arise Medical Introduction and Business Overview
Table 94. Arise Medical Arm-type Automatic Blood Pressure Monitor Sales (K Units), Revenue (US$ Million), Price (US$/Unit) and Gross Margin (2020-2025)
Table 95. Arise Medical Arm-type Automatic Blood Pressure Monitor Product Offerings
Table 96. Arise Medical Recent Development
Table 97. Panasonic Company Information
Table 98. Panasonic Introduction and Business Overview
Table 99. Panasonic Arm-type Automatic Blood Pressure Monitor Sales (K Units), Revenue (US$ Million), Price (US$/Unit) and Gross Margin (2020-2025)
Table 100. Panasonic Arm-type Automatic Blood Pressure Monitor Product Offerings
Table 101. Panasonic Recent Development
Table 102. Cofoe Medical Technology Company Information
Table 103. Cofoe Medical Technology Introduction and Business Overview
Table 104. Cofoe Medical Technology Arm-type Automatic Blood Pressure Monitor Sales (K Units), Revenue (US$ Million), Price (US$/Unit) and Gross Margin (2020-2025)
Table 105. Cofoe Medical Technology Arm-type Automatic Blood Pressure Monitor Product Offerings
Table 106. Cofoe Medical Technology Recent Development
Table 107. Guangdong Transtek Company Information
Table 108. Guangdong Transtek Introduction and Business Overview
Table 109. Guangdong Transtek Arm-type Automatic Blood Pressure Monitor Sales (K Units), Revenue (US$ Million), Price (US$/Unit) and Gross Margin (2020-2025)
Table 110. Guangdong Transtek Arm-type Automatic Blood Pressure Monitor Product Offerings
Table 111. Guangdong Transtek Recent Development
Table 112. Andon Health Company Information
Table 113. Andon Health Introduction and Business Overview
Table 114. Andon Health Arm-type Automatic Blood Pressure Monitor Sales (K Units), Revenue (US$ Million), Price (US$/Unit) and Gross Margin (2020-2025)
Table 115. Andon Health Arm-type Automatic Blood Pressure Monitor Product Offerings
Table 116. Andon Health Recent Development
Table 117. Qardio Company Information
Table 118. Qardio Introduction and Business Overview
Table 119. Qardio Arm-type Automatic Blood Pressure Monitor Sales (K Units), Revenue (US$ Million), Price (US$/Unit) and Gross Margin (2020-2025)
Table 120. Qardio Arm-type Automatic Blood Pressure Monitor Product Offerings
Table 121. Qardio Recent Development
Table 122. Medline Company Information
Table 123. Medline Introduction and Business Overview
Table 124. Medline Arm-type Automatic Blood Pressure Monitor Sales (K Units), Revenue (US$ Million), Price (US$/Unit) and Gross Margin (2020-2025)
Table 125. Medline Arm-type Automatic Blood Pressure Monitor Product Offerings
Table 126. Medline Recent Development
Table 127. Shenzhen AOJ Medical Technology Company Information
Table 128. Shenzhen AOJ Medical Technology Introduction and Business Overview
Table 129. Shenzhen AOJ Medical Technology Arm-type Automatic Blood Pressure Monitor Sales (K Units), Revenue (US$ Million), Price (US$/Unit) and Gross Margin (2020-2025)
Table 130. Shenzhen AOJ Medical Technology Arm-type Automatic Blood Pressure Monitor Product Offerings
Table 131. Shenzhen AOJ Medical Technology Recent Development
Table 132. Shenzhen Viatom Technology Company Information
Table 133. Shenzhen Viatom Technology Introduction and Business Overview
Table 134. Shenzhen Viatom Technology Arm-type Automatic Blood Pressure Monitor Sales (K Units), Revenue (US$ Million), Price (US$/Unit) and Gross Margin (2020-2025)
Table 135. Shenzhen Viatom Technology Arm-type Automatic Blood Pressure Monitor Product Offerings
Table 136. Shenzhen Viatom Technology Recent Development
Table 137. Beijing Lepu Medical Technology Company Information
Table 138. Beijing Lepu Medical Technology Introduction and Business Overview
Table 139. Beijing Lepu Medical Technology Arm-type Automatic Blood Pressure Monitor Sales (K Units), Revenue (US$ Million), Price (US$/Unit) and Gross Margin (2020-2025)
Table 140. Beijing Lepu Medical Technology Arm-type Automatic Blood Pressure Monitor Product Offerings
Table 141. Beijing Lepu Medical Technology Recent Development
Table 142. Jiangsu Yuyue Medical Equipment and Supply Company Information
Table 143. Jiangsu Yuyue Medical Equipment and Supply Introduction and Business Overview
Table 144. Jiangsu Yuyue Medical Equipment and Supply Arm-type Automatic Blood Pressure Monitor Sales (K Units), Revenue (US$ Million), Price (US$/Unit) and Gross Margin (2020-2025)
Table 145. Jiangsu Yuyue Medical Equipment and Supply Arm-type Automatic Blood Pressure Monitor Product Offerings
Table 146. Jiangsu Yuyue Medical Equipment and Supply Recent Development
Table 147. Shenzhen Xingwensheng Hardware Company Information
Table 148. Shenzhen Xingwensheng Hardware Introduction and Business Overview
Table 149. Shenzhen Xingwensheng Hardware Arm-type Automatic Blood Pressure Monitor Sales (K Units), Revenue (US$ Million), Price (US$/Unit) and Gross Margin (2020-2025)
Table 150. Shenzhen Xingwensheng Hardware Arm-type Automatic Blood Pressure Monitor Product Offerings
Table 151. Shenzhen Xingwensheng Hardware Recent Development
Table 152. Jiangsu Honsun Company Information
Table 153. Jiangsu Honsun Introduction and Business Overview
Table 154. Jiangsu Honsun Arm-type Automatic Blood Pressure Monitor Sales (K Units), Revenue (US$ Million), Price (US$/Unit) and Gross Margin (2020-2025)
Table 155. Jiangsu Honsun Arm-type Automatic Blood Pressure Monitor Product Offerings
Table 156. Jiangsu Honsun Recent Development
Table 157. Key Raw Materials Lists
Table 158. Raw Materials Key Suppliers Lists
Table 159. Arm-type Automatic Blood Pressure Monitor Downstream Customers
Table 160. Arm-type Automatic Blood Pressure Monitor Distributors List
Table 161. Research Programs/Design for This Report
Table 162. Key Data Information from Secondary Sources
Table 163. Key Data Information from Primary Sources
List of Figures
Figure 1. Arm-type Automatic Blood Pressure Monitor Product Picture
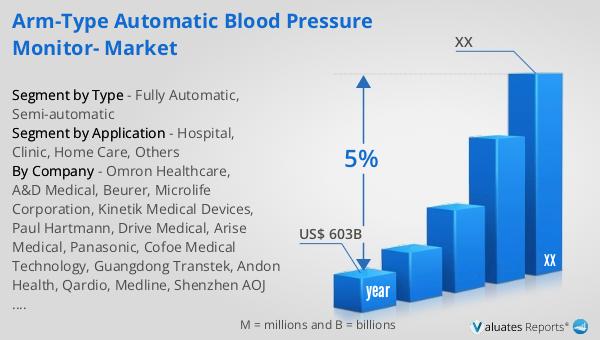
Figure 2. Global Arm-type Automatic Blood Pressure Monitor Sales Value, 2020 VS 2024 VS 2031 (US$ Million)
Figure 3. Global Arm-type Automatic Blood Pressure Monitor Sales Value (2020-2031) & (US$ Million)
Figure 4. Global Arm-type Automatic Blood Pressure Monitor Sales Volume (2020-2031) & (K Units)
Figure 5. Global Arm-type Automatic Blood Pressure Monitor Sales Price (2020-2031) & (US$/Unit)
Figure 6. Arm-type Automatic Blood Pressure Monitor Report Years Considered
Figure 7. Global Arm-type Automatic Blood Pressure Monitor Players Revenue Ranking (2024) & (US$ Million)
Figure 8. Global Arm-type Automatic Blood Pressure Monitor Players Sales Volume Ranking (2024) & (K Units)
Figure 9. The 5 and 10 Largest Manufacturers in the World: Market Share by Arm-type Automatic Blood Pressure Monitor Revenue in 2024
Figure 10. Arm-type Automatic Blood Pressure Monitor Market Share by Company Type (Tier 1, Tier 2, and Tier 3): 2020 VS 2024
Figure 11. Fully Automatic Picture
Figure 12. Semi-automatic Picture
Figure 13. Global Arm-type Automatic Blood Pressure Monitor Sales Value by Type (2020 VS 2024 VS 2031) & (US$ Million)
Figure 14. Global Arm-type Automatic Blood Pressure Monitor Sales Value Market Share by Type, 2024 & 2031
Figure 15. Global Arm-type Automatic Blood Pressure Monitor Sales Volume by Type (2020 VS 2024 VS 2031) & (K Units)
Figure 16. Global Arm-type Automatic Blood Pressure Monitor Sales Volume Market Share by Type, 2024 & 2031
Figure 17. Global Arm-type Automatic Blood Pressure Monitor Price by Type (2020-2031) & (US$/Unit)
Figure 18. Product Picture of Hospital
Figure 19. Product Picture of Clinic
Figure 20. Product Picture of Home Care
Figure 21. Product Picture of Others
Figure 22. Global Arm-type Automatic Blood Pressure Monitor Sales Value by Application (2020 VS 2024 VS 2031) & (US$ Million)
Figure 23. Global Arm-type Automatic Blood Pressure Monitor Sales Value Market Share by Application, 2024 & 2031
Figure 24. Global Arm-type Automatic Blood Pressure Monitor Sales Volume by Application (2020 VS 2024 VS 2031) & (K Units)
Figure 25. Global Arm-type Automatic Blood Pressure Monitor Sales Volume Market Share by Application, 2024 & 2031
Figure 26. Global Arm-type Automatic Blood Pressure Monitor Price by Application (2020-2031) & (US$/Unit)
Figure 27. North America Arm-type Automatic Blood Pressure Monitor Sales Value (2020-2031) & (US$ Million)
Figure 28. North America Arm-type Automatic Blood Pressure Monitor Sales Value by Country (%), 2024 VS 2031
Figure 29. Europe Arm-type Automatic Blood Pressure Monitor Sales Value, (2020-2031) & (US$ Million)
Figure 30. Europe Arm-type Automatic Blood Pressure Monitor Sales Value by Country (%), 2024 VS 2031
Figure 31. Asia Pacific Arm-type Automatic Blood Pressure Monitor Sales Value, (2020-2031) & (US$ Million)
Figure 32. Asia Pacific Arm-type Automatic Blood Pressure Monitor Sales Value by Region (%), 2024 VS 2031
Figure 33. South America Arm-type Automatic Blood Pressure Monitor Sales Value, (2020-2031) & (US$ Million)
Figure 34. South America Arm-type Automatic Blood Pressure Monitor Sales Value by Country (%), 2024 VS 2031
Figure 35. Middle East & Africa Arm-type Automatic Blood Pressure Monitor Sales Value, (2020-2031) & (US$ Million)
Figure 36. Middle East & Africa Arm-type Automatic Blood Pressure Monitor Sales Value by Country (%), 2024 VS 2031
Figure 37. Key Countries/Regions Arm-type Automatic Blood Pressure Monitor Sales Value (%), (2020-2031)
Figure 38. Key Countries/Regions Arm-type Automatic Blood Pressure Monitor Sales Volume (%), (2020-2031)
Figure 39. United States Arm-type Automatic Blood Pressure Monitor Sales Value, (2020-2031) & (US$ Million)
Figure 40. United States Arm-type Automatic Blood Pressure Monitor Sales Value by Type (%), 2024 VS 2031
Figure 41. United States Arm-type Automatic Blood Pressure Monitor Sales Value by Application (%), 2024 VS 2031
Figure 42. Europe Arm-type Automatic Blood Pressure Monitor Sales Value, (2020-2031) & (US$ Million)
Figure 43. Europe Arm-type Automatic Blood Pressure Monitor Sales Value by Type (%), 2024 VS 2031
Figure 44. Europe Arm-type Automatic Blood Pressure Monitor Sales Value by Application (%), 2024 VS 2031
Figure 45. China Arm-type Automatic Blood Pressure Monitor Sales Value, (2020-2031) & (US$ Million)
Figure 46. China Arm-type Automatic Blood Pressure Monitor Sales Value by Type (%), 2024 VS 2031
Figure 47. China Arm-type Automatic Blood Pressure Monitor Sales Value by Application (%), 2024 VS 2031
Figure 48. Japan Arm-type Automatic Blood Pressure Monitor Sales Value, (2020-2031) & (US$ Million)
Figure 49. Japan Arm-type Automatic Blood Pressure Monitor Sales Value by Type (%), 2024 VS 2031
Figure 50. Japan Arm-type Automatic Blood Pressure Monitor Sales Value by Application (%), 2024 VS 2031
Figure 51. South Korea Arm-type Automatic Blood Pressure Monitor Sales Value, (2020-2031) & (US$ Million)
Figure 52. South Korea Arm-type Automatic Blood Pressure Monitor Sales Value by Type (%), 2024 VS 2031
Figure 53. South Korea Arm-type Automatic Blood Pressure Monitor Sales Value by Application (%), 2024 VS 2031
Figure 54. Southeast Asia Arm-type Automatic Blood Pressure Monitor Sales Value, (2020-2031) & (US$ Million)
Figure 55. Southeast Asia Arm-type Automatic Blood Pressure Monitor Sales Value by Type (%), 2024 VS 2031
Figure 56. Southeast Asia Arm-type Automatic Blood Pressure Monitor Sales Value by Application (%), 2024 VS 2031
Figure 57. India Arm-type Automatic Blood Pressure Monitor Sales Value, (2020-2031) & (US$ Million)
Figure 58. India Arm-type Automatic Blood Pressure Monitor Sales Value by Type (%), 2024 VS 2031
Figure 59. India Arm-type Automatic Blood Pressure Monitor Sales Value by Application (%), 2024 VS 2031
Figure 60. Arm-type Automatic Blood Pressure Monitor Industrial Chain
Figure 61. Arm-type Automatic Blood Pressure Monitor Manufacturing Cost Structure
Figure 62. Channels of Distribution (Direct Sales, and Distribution)
Figure 63. Bottom-up and Top-down Approaches for This Report
Figure 64. Data Triangulation
Figure 65. Key Executives Interviewed