
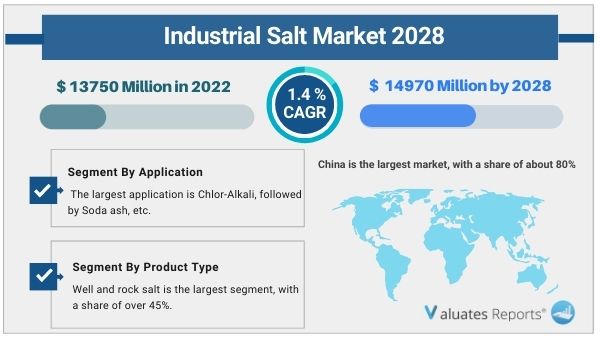
The global Industrial Salt market size is estimated to be valued at US$ 13750 million in 2022 and is projected to reach US$ 14970 million by 2028 with a CAGR of 1.4% during the forecast period. Key drivers of the industrial salts market include increasing demand from the chemical industry and de-icing processes. The rising usage of salts in the oil and gas industry and for water treatment is also expected to drive the growth of the industrial salts market during the forecast period. Moreover, agricultural sector use will provide lucrative opportunities for market growth in the coming years.
Chemical industry and De-icing use
Industrial salt is used majorly as a raw material for producing different chemicals in the chemical industry. The most extensive uses are in the production of caustic soda, soda ash, Chlor-alkali, sodium sulfate, sodium carbonate, sodium bicarbonate, liquid sodium, etc. It is also used as a filler for detergents, soaps, and solvents for mixing chemicals directly into the water. Moreover, salts are scattered across roads for brine formation which prevents or delays the freezing of ice(De-icing). It is also used for melting ice on sidewalks, roads which help in proper maintenance and safety. Thus the demand from the chemical industry and increased use for road maintenance will drive the growth of the industrial salts market in the coming years.
Oil and gas industry and water treatment purposes
The oil and gas industry deploys salt for adding density to mud and soil which then acts as an efficient drilling rig. In addition to it, salts are used as an additive, lubricant, coolant for drilling fluid, and as diverting agents, dispersants, stabilizers, etc. Furthermore, industrial salts are used in water treatment plants as a filtering agent for removing the calcium, magnesium, and other harmful elements thereby reducing the hardness of the water. Thus the growing demand from these industries will propel the growth of the industrial salts market during the forecast period.
Agricultural Sector Use
Silage are plants such as corn, legumes, and grasses which are excellent sources of animal feed. Industrial salts are used as preservatives for increasing the stability, shelf life, and acidification of silage. It prevents bacterial and microorganisms growth thereby retaining the nutritional value of silages. Thus the growing need for preserving silage crops will create huge opportunities for the growth of the industrial salts market during the forecast period.
Based on product, Well and rock salt is the largest segment with a share of 45% and will provide lucrative opportunities for growth in the industrial salts market share during the forecast period.
Based on application, Chlor-Alkali(Chemical processing) is expected to dominate in the industrial salts market share followed by soda ash. This is due to increasing use for manufacturing a variety of household products.
Based on region, Asia-Pacific is expected to provide huge scope for growth in the industrial salts market share with China dominating at 80% and India, Japan together at 15%. This is due to an increasing rate of urbanization, industrialization in the region.
In this section of the report, the researchers have done a comprehensive analysis of the prominent players operating and the strategies they are focusing on to combat the intense competition. Company profiles and share analysis of the prominent players are also provided in this section. They have also provided reliable sales and revenue data of the manufacturers for the period 2017-2022. With the assistance of this report, key players, stakeholders, and other participants will be able to stay abreast of the recent and upcoming developments in the business, further enabling them to make efficient choices.
|
Report Metric |
Details |
|
Report Name |
Industrial Salt Market |
|
The market size in 2022 |
USD 13750 Million |
|
The revenue forecast in 2028 |
USD 14970 Million |
|
Growth Rate |
Compound Annual Growth Rate (CAGR) of 1.4% from 2022 to 2028 |
|
Market size available for years |
2022-2028 |
|
Forecast units |
Value (USD) |
|
Segments covered |
By Type, Application, and Region |
|
Report coverage |
Revenue & volume forecast, company share, competitive landscape, growth factors, and trends |
|
Geographic regions covered |
North America, Europe, Asia Pacific, Latin America, Middle East & Africa |
Ans. The global Industrial Salt market size is projected to reach US$ 14970 million by 2028, from US$ 13750 million in 2022.
Ans. The global Industrial Salt market is expected to grow at a compound annual growth rate of 1.4% from 2022 to 2028.
Ans. Some of the major companies are Archean Group, Ahir Salt, GHCL, Sojitz, Naikai Salt, China National Salt, 9D Group, Yunnan Salt, Lantai Industry, Chengyuan Salt, Jingshen Salt & Chemical, Longwei, Chengkou, Lubei Chemical, Dadi Salt.
Table of Contents
1 Study Coverage
1.1 Industrial Salt Product Introduction
1.2 Market by Type
1.2.1 Global Industrial Salt Market Size by Type, 2017 VS 2021 VS 2028
1.2.2 Sea Salt
1.2.3 Well and Rock Salt
1.2.4 Lake Salt
1.3 Market by Application
1.3.1 Global Industrial Salt Market Size by Application, 2017 VS 2021 VS 2028
1.3.2 Chemical Processing
1.3.3 De-Icing
1.3.4 Oil & Gas
1.3.5 Water Treatment
1.3.6 Agriculture
1.3.7 Others
1.4 Study Objectives
1.5 Years Considered
2 Global Industrial Salt Production
2.1 Global Industrial Salt Production Capacity (2017-2028)
2.2 Global Industrial Salt Production by Region: 2017 VS 2021 VS 2028
2.3 Global Industrial Salt Production by Region
2.3.1 Global Industrial Salt Historic Production by Region (2017-2022)
2.3.2 Global Industrial Salt Forecasted Production by Region (2023-2028)
2.4 North America
2.5 Europe
2.6 China
2.7 Japan
3 Global Industrial Salt Sales in Volume & Value Estimates and Forecasts
3.1 Global Industrial Salt Sales Estimates and Forecasts 2017-2028
3.2 Global Industrial Salt Revenue Estimates and Forecasts 2017-2028
3.3 Global Industrial Salt Revenue by Region: 2017 VS 2021 VS 2028
3.4 Global Industrial Salt Sales by Region
3.4.1 Global Industrial Salt Sales by Region (2017-2022)
3.4.2 Global Sales Industrial Salt by Region (2023-2028)
3.5 Global Industrial Salt Revenue by Region
3.5.1 Global Industrial Salt Revenue by Region (2017-2022)
3.5.2 Global Industrial Salt Revenue by Region (2023-2028)
3.6 North America
3.7 Europe
3.8 Asia-Pacific
3.9 Latin America
3.10 Middle East & Africa
4 Competition by Manufactures
4.1 Global Industrial Salt Production Capacity by Manufacturers
4.2 Global Industrial Salt Sales by Manufacturers
4.2.1 Global Industrial Salt Sales by Manufacturers (2017-2022)
4.2.2 Global Industrial Salt Sales Market Share by Manufacturers (2017-2022)
4.2.3 Global Top 10 and Top 5 Largest Manufacturers of Industrial Salt in 2021
4.3 Global Industrial Salt Revenue by Manufacturers
4.3.1 Global Industrial Salt Revenue by Manufacturers (2017-2022)
4.3.2 Global Industrial Salt Revenue Market Share by Manufacturers (2017-2022)
4.3.3 Global Top 10 and Top 5 Companies by Industrial Salt Revenue in 2021
4.4 Global Industrial Salt Sales Price by Manufacturers
4.5 Analysis of Competitive Landscape
4.5.1 Manufacturers Market Concentration Ratio (CR5 and HHI)
4.5.2 Global Industrial Salt Market Share by Company Type (Tier 1, Tier 2, and Tier 3)
4.5.3 Global Industrial Salt Manufacturers Geographical Distribution
4.6 Mergers & Acquisitions, Expansion Plans
5 Market Size by Type
5.1 Global Industrial Salt Sales by Type
5.1.1 Global Industrial Salt Historical Sales by Type (2017-2022)
5.1.2 Global Industrial Salt Forecasted Sales by Type (2023-2028)
5.1.3 Global Industrial Salt Sales Market Share by Type (2017-2028)
5.2 Global Industrial Salt Revenue by Type
5.2.1 Global Industrial Salt Historical Revenue by Type (2017-2022)
5.2.2 Global Industrial Salt Forecasted Revenue by Type (2023-2028)
5.2.3 Global Industrial Salt Revenue Market Share by Type (2017-2028)
5.3 Global Industrial Salt Price by Type
5.3.1 Global Industrial Salt Price by Type (2017-2022)
5.3.2 Global Industrial Salt Price Forecast by Type (2023-2028)
6 Market Size by Application
6.1 Global Industrial Salt Sales by Application
6.1.1 Global Industrial Salt Historical Sales by Application (2017-2022)
6.1.2 Global Industrial Salt Forecasted Sales by Application (2023-2028)
6.1.3 Global Industrial Salt Sales Market Share by Application (2017-2028)
6.2 Global Industrial Salt Revenue by Application
6.2.1 Global Industrial Salt Historical Revenue by Application (2017-2022)
6.2.2 Global Industrial Salt Forecasted Revenue by Application (2023-2028)
6.2.3 Global Industrial Salt Revenue Market Share by Application (2017-2028)
6.3 Global Industrial Salt Price by Application
6.3.1 Global Industrial Salt Price by Application (2017-2022)
6.3.2 Global Industrial Salt Price Forecast by Application (2023-2028)
7 North America
7.1 North America Industrial Salt Market Size by Type
7.1.1 North America Industrial Salt Sales by Type (2017-2028)
7.1.2 North America Industrial Salt Revenue by Type (2017-2028)
7.2 North America Industrial Salt Market Size by Application
7.2.1 North America Industrial Salt Sales by Application (2017-2028)
7.2.2 North America Industrial Salt Revenue by Application (2017-2028)
7.3 North America Industrial Salt Sales by Country
7.3.1 North America Industrial Salt Sales by Country (2017-2028)
7.3.2 North America Industrial Salt Revenue by Country (2017-2028)
7.3.3 U.S.
7.3.4 Canada
8 Europe
8.1 Europe Industrial Salt Market Size by Type
8.1.1 Europe Industrial Salt Sales by Type (2017-2028)
8.1.2 Europe Industrial Salt Revenue by Type (2017-2028)
8.2 Europe Industrial Salt Market Size by Application
8.2.1 Europe Industrial Salt Sales by Application (2017-2028)
8.2.2 Europe Industrial Salt Revenue by Application (2017-2028)
8.3 Europe Industrial Salt Sales by Country
8.3.1 Europe Industrial Salt Sales by Country (2017-2028)
8.3.2 Europe Industrial Salt Revenue by Country (2017-2028)
8.3.3 Germany
8.3.4 France
8.3.5 U.K.
8.3.6 Italy
8.3.7 Russia
9 Asia Pacific
9.1 Asia Pacific Industrial Salt Market Size by Type
9.1.1 Asia Pacific Industrial Salt Sales by Type (2017-2028)
9.1.2 Asia Pacific Industrial Salt Revenue by Type (2017-2028)
9.2 Asia Pacific Industrial Salt Market Size by Application
9.2.1 Asia Pacific Industrial Salt Sales by Application (2017-2028)
9.2.2 Asia Pacific Industrial Salt Revenue by Application (2017-2028)
9.3 Asia Pacific Industrial Salt Sales by Region
9.3.1 Asia Pacific Industrial Salt Sales by Region (2017-2028)
9.3.2 Asia Pacific Industrial Salt Revenue by Region (2017-2028)
9.3.3 China
9.3.4 Japan
9.3.5 South Korea
9.3.6 India
9.3.7 Australia
9.3.8 China Taiwan
9.3.9 Indonesia
9.3.10 Thailand
9.3.11 Malaysia
10 Latin America
10.1 Latin America Industrial Salt Market Size by Type
10.1.1 Latin America Industrial Salt Sales by Type (2017-2028)
10.1.2 Latin America Industrial Salt Revenue by Type (2017-2028)
10.2 Latin America Industrial Salt Market Size by Application
10.2.1 Latin America Industrial Salt Sales by Application (2017-2028)
10.2.2 Latin America Industrial Salt Revenue by Application (2017-2028)
10.3 Latin America Industrial Salt Sales by Country
10.3.1 Latin America Industrial Salt Sales by Country (2017-2028)
10.3.2 Latin America Industrial Salt Revenue by Country (2017-2028)
10.3.3 Mexico
10.3.4 Brazil
10.3.5 Argentina
11 Middle East and Africa
11.1 Middle East and Africa Industrial Salt Market Size by Type
11.1.1 Middle East and Africa Industrial Salt Sales by Type (2017-2028)
11.1.2 Middle East and Africa Industrial Salt Revenue by Type (2017-2028)
11.2 Middle East and Africa Industrial Salt Market Size by Application
11.2.1 Middle East and Africa Industrial Salt Sales by Application (2017-2028)
11.2.2 Middle East and Africa Industrial Salt Revenue by Application (2017-2028)
11.3 Middle East and Africa Industrial Salt Sales by Country
11.3.1 Middle East and Africa Industrial Salt Sales by Country (2017-2028)
11.3.2 Middle East and Africa Industrial Salt Revenue by Country (2017-2028)
11.3.3 Turkey
11.3.4 Saudi Arabia
11.3.5 UAE
12 Corporate Profiles
12.1 Archean Group
12.1.1 Archean Group Corporation Information
12.1.2 Archean Group Overview
12.1.3 Archean Group Industrial Salt Sales, Price, Revenue and Gross Margin (2017-2022)
12.1.4 Archean Group Industrial Salt Product Model Numbers, Pictures, Descriptions, and Specifications
12.1.5 Archean Group Recent Developments
12.2 Ahir Salt
12.2.1 Ahir Salt Corporation Information
12.2.2 Ahir Salt Overview
12.2.3 Ahir Salt Industrial Salt Sales, Price, Revenue and Gross Margin (2017-2022)
12.2.4 Ahir Salt Industrial Salt Product Model Numbers, Pictures, Descriptions, and Specifications
12.2.5 Ahir Salt Recent Developments
12.3 GHCL
12.3.1 GHCL Corporation Information
12.3.2 GHCL Overview
12.3.3 GHCL Industrial Salt Sales, Price, Revenue and Gross Margin (2017-2022)
12.3.4 GHCL Industrial Salt Product Model Numbers, Pictures, Descriptions, and Specifications
12.3.5 GHCL Recent Developments
12.4 Sojitz
12.4.1 Sojitz Corporation Information
12.4.2 Sojitz Overview
12.4.3 Sojitz Industrial Salt Sales, Price, Revenue and Gross Margin (2017-2022)
12.4.4 Sojitz Industrial Salt Product Model Numbers, Pictures, Descriptions, and Specifications
12.4.5 Sojitz Recent Developments
12.5 Naikai Salt
12.5.1 Naikai Salt Corporation Information
12.5.2 Naikai Salt Overview
12.5.3 Naikai Salt Industrial Salt Sales, Price, Revenue and Gross Margin (2017-2022)
12.5.4 Naikai Salt Industrial Salt Product Model Numbers, Pictures, Descriptions, and Specifications
12.5.5 Naikai Salt Recent Developments
12.6 China National Salt
12.6.1 China National Salt Corporation Information
12.6.2 China National Salt Overview
12.6.3 China National Salt Industrial Salt Sales, Price, Revenue and Gross Margin (2017-2022)
12.6.4 China National Salt Industrial Salt Product Model Numbers, Pictures, Descriptions, and Specifications
12.6.5 China National Salt Recent Developments
12.7 9D Group
12.7.1 9D Group Corporation Information
12.7.2 9D Group Overview
12.7.3 9D Group Industrial Salt Sales, Price, Revenue and Gross Margin (2017-2022)
12.7.4 9D Group Industrial Salt Product Model Numbers, Pictures, Descriptions, and Specifications
12.7.5 9D Group Recent Developments
12.8 Yunnan Salt
12.8.1 Yunnan Salt Corporation Information
12.8.2 Yunnan Salt Overview
12.8.3 Yunnan Salt Industrial Salt Sales, Price, Revenue and Gross Margin (2017-2022)
12.8.4 Yunnan Salt Industrial Salt Product Model Numbers, Pictures, Descriptions, and Specifications
12.8.5 Yunnan Salt Recent Developments
12.9 Lantai Industry
12.9.1 Lantai Industry Corporation Information
12.9.2 Lantai Industry Overview
12.9.3 Lantai Industry Industrial Salt Sales, Price, Revenue and Gross Margin (2017-2022)
12.9.4 Lantai Industry Industrial Salt Product Model Numbers, Pictures, Descriptions, and Specifications
12.9.5 Lantai Industry Recent Developments
12.10 Chengyuan Salt
12.10.1 Chengyuan Salt Corporation Information
12.10.2 Chengyuan Salt Overview
12.10.3 Chengyuan Salt Industrial Salt Sales, Price, Revenue and Gross Margin (2017-2022)
12.10.4 Chengyuan Salt Industrial Salt Product Model Numbers, Pictures, Descriptions, and Specifications
12.10.5 Chengyuan Salt Recent Developments
12.11 Jingshen Salt & Chemical
12.11.1 Jingshen Salt & Chemical Corporation Information
12.11.2 Jingshen Salt & Chemical Overview
12.11.3 Jingshen Salt & Chemical Industrial Salt Sales, Price, Revenue and Gross Margin (2017-2022)
12.11.4 Jingshen Salt & Chemical Industrial Salt Product Model Numbers, Pictures, Descriptions, and Specifications
12.11.5 Jingshen Salt & Chemical Recent Developments
12.12 Longwei
12.12.1 Longwei Corporation Information
12.12.2 Longwei Overview
12.12.3 Longwei Industrial Salt Sales, Price, Revenue and Gross Margin (2017-2022)
12.12.4 Longwei Industrial Salt Product Model Numbers, Pictures, Descriptions, and Specifications
12.12.5 Longwei Recent Developments
12.13 Chengkou
12.13.1 Chengkou Corporation Information
12.13.2 Chengkou Overview
12.13.3 Chengkou Industrial Salt Sales, Price, Revenue and Gross Margin (2017-2022)
12.13.4 Chengkou Industrial Salt Product Model Numbers, Pictures, Descriptions, and Specifications
12.13.5 Chengkou Recent Developments
12.14 Lubei Chemical
12.14.1 Lubei Chemical Corporation Information
12.14.2 Lubei Chemical Overview
12.14.3 Lubei Chemical Industrial Salt Sales, Price, Revenue and Gross Margin (2017-2022)
12.14.4 Lubei Chemical Industrial Salt Product Model Numbers, Pictures, Descriptions, and Specifications
12.14.5 Lubei Chemical Recent Developments
12.15 Dadi Salt
12.15.1 Dadi Salt Corporation Information
12.15.2 Dadi Salt Overview
12.15.3 Dadi Salt Industrial Salt Sales, Price, Revenue and Gross Margin (2017-2022)
12.15.4 Dadi Salt Industrial Salt Product Model Numbers, Pictures, Descriptions, and Specifications
12.15.5 Dadi Salt Recent Developments
13 Industry Chain and Sales Channels Analysis
13.1 Industrial Salt Industry Chain Analysis
13.2 Industrial Salt Key Raw Materials
13.2.1 Key Raw Materials
13.2.2 Raw Materials Key Suppliers
13.3 Industrial Salt Production Mode & Process
13.4 Industrial Salt Sales and Marketing
13.4.1 Industrial Salt Sales Channels
13.4.2 Industrial Salt Distributors
13.5 Industrial Salt Customers
14 Market Drivers, Opportunities, Challenges, and Risks Factors Analysis
14.1 Industrial Salt Industry Trends
14.2 Industrial Salt Market Drivers
14.3 Industrial Salt Market Challenges
14.4 Industrial Salt Market Restraints
15 Key Finding in The Global Industrial Salt Study
16 Appendix
16.1 Research Methodology
16.1.1 Methodology/Research Approach
16.1.2 Data Source
16.2 Author Details
16.3 Disclaimer
List of Tables
Table 1. Global Industrial Salt Market Size Growth Rate by Type, 2017 VS 2021 VS 2028 (US$ Million)
Table 2. Major Manufacturers of Sea Salt
Table 3. Major Manufacturers of Well and Rock Salt
Table 4. Major Manufacturers of Lake Salt
Table 5. Global Industrial Salt Market Size Growth Rate by Application, 2017 VS 2021 2028 (US$ Million)
Table 6. Global Industrial Salt Production by Region: 2017 VS 2021 VS 2028 (K MT)
Table 7. Global Industrial Salt Production by Region (2017-2022) & (K MT)
Table 8. Global Industrial Salt Production Market Share by Region (2017-2022)
Table 9. Global Industrial Salt Production by Region (2023-2028) & (K MT)
Table 10. Global Industrial Salt Production Market Share by Region (2023-2028)
Table 11. Global Industrial Salt Revenue by Region: 2017 VS 2021 VS 2028 (US$ Million)
Table 12. Global Industrial Salt Sales by Region (2017-2022) & (K MT)
Table 13. Global Industrial Salt Sales Market Share by Region (2017-2022)
Table 14. Global Industrial Salt Sales by Region (2023-2028) & (K MT)
Table 15. Global Industrial Salt Sales Market Share by Region (2023-2028)
Table 16. Global Industrial Salt Revenue by Region (2017-2022) & (US$ Million)
Table 17. Global Industrial Salt Revenue Market Share by Region (2017-2022)
Table 18. Global Industrial Salt Revenue by Region (2023-2028) & (US$ Million)
Table 19. Global Industrial Salt Revenue Market Share by Region (2023-2028)
Table 20. Global Industrial Salt Production Capacity by Manufacturers (2017-2022) & (K MT)
Table 21. Global Industrial Salt Capacity Market Share by Manufacturers (2017-2022)
Table 22. Global Industrial Salt Sales by Manufacturers (2017-2022) & (K MT)
Table 23. Global Industrial Salt Sales Market Share by Manufacturers (2017-2022)
Table 24. Global Industrial Salt Revenue by Manufacturers (2017-2022) & (US$ Million)
Table 25. Global Industrial Salt Revenue Share by Manufacturers (2017-2022)
Table 26. Industrial Salt Price by Manufacturers 2017-2022 (USD/MT)
Table 27. Global Industrial Salt Manufacturers Market Concentration Ratio (CR5 and HHI)
Table 28. Global Industrial Salt by Company Type (Tier 1, Tier 2, and Tier 3) & (based on the Revenue in Industrial Salt as of 2021)
Table 29. Industrial Salt Manufacturing Base Distribution and Headquarters
Table 30. Manufacturers Industrial Salt Product Offered
Table 31. Date of Manufacturers Enter into Industrial Salt Market
Table 32. Mergers & Acquisitions, Expansion Plans
Table 33. Global Industrial Salt Sales by Type (2017-2022) & (K MT)
Table 34. Global Industrial Salt Sales by Type (2023-2028) & (K MT)
Table 35. Global Industrial Salt Sales Share by Type (2017-2022)
Table 36. Global Industrial Salt Sales Share by Type (2023-2028)
Table 37. Global Industrial Salt Revenue by Type (2017-2022) & (US$ Million)
Table 38. Global Industrial Salt Revenue by Type (2023-2028) & (US$ Million)
Table 39. Global Industrial Salt Revenue Share by Type (2017-2022)
Table 40. Global Industrial Salt Revenue Share by Type (2023-2028)
Table 41. Industrial Salt Price by Type (2017-2022) & (USD/MT)
Table 42. Global Industrial Salt Price Forecast by Type (2023-2028) & (USD/MT)
Table 43. Global Industrial Salt Sales by Application (2017-2022) & (K MT)
Table 44. Global Industrial Salt Sales by Application (2023-2028) & (K MT)
Table 45. Global Industrial Salt Sales Share by Application (2017-2022)
Table 46. Global Industrial Salt Sales Share by Application (2023-2028)
Table 47. Global Industrial Salt Revenue by Application (2017-2022) & (US$ Million)
Table 48. Global Industrial Salt Revenue by Application (2023-2028) & (US$ Million)
Table 49. Global Industrial Salt Revenue Share by Application (2017-2022)
Table 50. Global Industrial Salt Revenue Share by Application (2023-2028)
Table 51. Industrial Salt Price by Application (2017-2022) & (USD/MT)
Table 52. Global Industrial Salt Price Forecast by Application (2023-2028) & (USD/MT)
Table 53. North America Industrial Salt Sales by Type (2017-2022) & (K MT)
Table 54. North America Industrial Salt Sales by Type (2023-2028) & (K MT)
Table 55. North America Industrial Salt Revenue by Type (2017-2022) & (US$ Million)
Table 56. North America Industrial Salt Revenue by Type (2023-2028) & (US$ Million)
Table 57. North America Industrial Salt Sales by Application (2017-2022) & (K MT)
Table 58. North America Industrial Salt Sales by Application (2023-2028) & (K MT)
Table 59. North America Industrial Salt Revenue by Application (2017-2022) & (US$ Million)
Table 60. North America Industrial Salt Revenue by Application (2023-2028) & (US$ Million)
Table 61. North America Industrial Salt Sales by Country (2017-2022) & (K MT)
Table 62. North America Industrial Salt Sales by Country (2023-2028) & (K MT)
Table 63. North America Industrial Salt Revenue by Country (2017-2022) & (US$ Million)
Table 64. North America Industrial Salt Revenue by Country (2023-2028) & (US$ Million)
Table 65. Europe Industrial Salt Sales by Type (2017-2022) & (K MT)
Table 66. Europe Industrial Salt Sales by Type (2023-2028) & (K MT)
Table 67. Europe Industrial Salt Revenue by Type (2017-2022) & (US$ Million)
Table 68. Europe Industrial Salt Revenue by Type (2023-2028) & (US$ Million)
Table 69. Europe Industrial Salt Sales by Application (2017-2022) & (K MT)
Table 70. Europe Industrial Salt Sales by Application (2023-2028) & (K MT)
Table 71. Europe Industrial Salt Revenue by Application (2017-2022) & (US$ Million)
Table 72. Europe Industrial Salt Revenue by Application (2023-2028) & (US$ Million)
Table 73. Europe Industrial Salt Sales by Country (2017-2022) & (K MT)
Table 74. Europe Industrial Salt Sales by Country (2023-2028) & (K MT)
Table 75. Europe Industrial Salt Revenue by Country (2017-2022) & (US$ Million)
Table 76. Europe Industrial Salt Revenue by Country (2023-2028) & (US$ Million)
Table 77. Asia Pacific Industrial Salt Sales by Type (2017-2022) & (K MT)
Table 78. Asia Pacific Industrial Salt Sales by Type (2023-2028) & (K MT)
Table 79. Asia Pacific Industrial Salt Revenue by Type (2017-2022) & (US$ Million)
Table 80. Asia Pacific Industrial Salt Revenue by Type (2023-2028) & (US$ Million)
Table 81. Asia Pacific Industrial Salt Sales by Application (2017-2022) & (K MT)
Table 82. Asia Pacific Industrial Salt Sales by Application (2023-2028) & (K MT)
Table 83. Asia Pacific Industrial Salt Revenue by Application (2017-2022) & (US$ Million)
Table 84. Asia Pacific Industrial Salt Revenue by Application (2023-2028) & (US$ Million)
Table 85. Asia Pacific Industrial Salt Sales by Region (2017-2022) & (K MT)
Table 86. Asia Pacific Industrial Salt Sales by Region (2023-2028) & (K MT)
Table 87. Asia Pacific Industrial Salt Revenue by Region (2017-2022) & (US$ Million)
Table 88. Asia Pacific Industrial Salt Revenue by Region (2023-2028) & (US$ Million)
Table 89. Latin America Industrial Salt Sales by Type (2017-2022) & (K MT)
Table 90. Latin America Industrial Salt Sales by Type (2023-2028) & (K MT)
Table 91. Latin America Industrial Salt Revenue by Type (2017-2022) & (US$ Million)
Table 92. Latin America Industrial Salt Revenue by Type (2023-2028) & (US$ Million)
Table 93. Latin America Industrial Salt Sales by Application (2017-2022) & (K MT)
Table 94. Latin America Industrial Salt Sales by Application (2023-2028) & (K MT)
Table 95. Latin America Industrial Salt Revenue by Application (2017-2022) & (US$ Million)
Table 96. Latin America Industrial Salt Revenue by Application (2023-2028) & (US$ Million)
Table 97. Latin America Industrial Salt Sales by Country (2017-2022) & (K MT)
Table 98. Latin America Industrial Salt Sales by Country (2023-2028) & (K MT)
Table 99. Latin America Industrial Salt Revenue by Country (2017-2022) & (US$ Million)
Table 100. Latin America Industrial Salt Revenue by Country (2023-2028) & (US$ Million)
Table 101. Middle East and Africa Industrial Salt Sales by Type (2017-2022) & (K MT)
Table 102. Middle East and Africa Industrial Salt Sales by Type (2023-2028) & (K MT)
Table 103. Middle East and Africa Industrial Salt Revenue by Type (2017-2022) & (US$ Million)
Table 104. Middle East and Africa Industrial Salt Revenue by Type (2023-2028) & (US$ Million)
Table 105. Middle East and Africa Industrial Salt Sales by Application (2017-2022) & (K MT)
Table 106. Middle East and Africa Industrial Salt Sales by Application (2023-2028) & (K MT)
Table 107. Middle East and Africa Industrial Salt Revenue by Application (2017-2022) & (US$ Million)
Table 108. Middle East and Africa Industrial Salt Revenue by Application (2023-2028) & (US$ Million)
Table 109. Middle East and Africa Industrial Salt Sales by Country (2017-2022) & (K MT)
Table 110. Middle East and Africa Industrial Salt Sales by Country (2023-2028) & (K MT)
Table 111. Middle East and Africa Industrial Salt Revenue by Country (2017-2022) & (US$ Million)
Table 112. Middle East and Africa Industrial Salt Revenue by Country (2023-2028) & (US$ Million)
Table 113. Archean Group Corporation Information
Table 114. Archean Group Description and Major Businesses
Table 115. Archean Group Industrial Salt Sales (K MT), Revenue (US$ Million), Price (USD/MT), and Gross Margin (2017-2022)
Table 116. Archean Group Industrial Salt Product Model Numbers, Pictures, Descriptions, and Specifications
Table 117. Archean Group Recent Development
Table 118. Ahir Salt Corporation Information
Table 119. Ahir Salt Description and Major Businesses
Table 120. Ahir Salt Industrial Salt Sales (K MT), Revenue (US$ Million), Price (USD/MT), and Gross Margin (2017-2022)
Table 121. Ahir Salt Industrial Salt Product Model Numbers, Pictures, Descriptions, and Specifications
Table 122. Ahir Salt Recent Development
Table 123. GHCL Corporation Information
Table 124. GHCL Description and Major Businesses
Table 125. GHCL Industrial Salt Sales (K MT), Revenue (US$ Million), Price (USD/MT), and Gross Margin (2017-2022)
Table 126. GHCL Industrial Salt Product Model Numbers, Pictures, Descriptions, and Specifications
Table 127. GHCL Recent Development
Table 128. Sojitz Corporation Information
Table 129. Sojitz Description and Major Businesses
Table 130. Sojitz Industrial Salt Sales (K MT), Revenue (US$ Million), Price (USD/MT), and Gross Margin (2017-2022)
Table 131. Sojitz Industrial Salt Product Model Numbers, Pictures, Descriptions, and Specifications
Table 132. Sojitz Recent Development
Table 133. Naikai Salt Corporation Information
Table 134. Naikai Salt Description and Major Businesses
Table 135. Naikai Salt Industrial Salt Sales (K MT), Revenue (US$ Million), Price (USD/MT), and Gross Margin (2017-2022)
Table 136. Naikai Salt Industrial Salt Product Model Numbers, Pictures, Descriptions, and Specifications
Table 137. Naikai Salt Recent Development
Table 138. China National Salt Corporation Information
Table 139. China National Salt Description and Major Businesses
Table 140. China National Salt Industrial Salt Sales (K MT), Revenue (US$ Million), Price (USD/MT), and Gross Margin (2017-2022)
Table 141. China National Salt Industrial Salt Product Model Numbers, Pictures, Descriptions, and Specifications
Table 142. China National Salt Recent Development
Table 143. 9D Group Corporation Information
Table 144. 9D Group Description and Major Businesses
Table 145. 9D Group Industrial Salt Sales (K MT), Revenue (US$ Million), Price (USD/MT), and Gross Margin (2017-2022)
Table 146. 9D Group Industrial Salt Product Model Numbers, Pictures, Descriptions, and Specifications
Table 147. 9D Group Recent Development
Table 148. Yunnan Salt Corporation Information
Table 149. Yunnan Salt Description and Major Businesses
Table 150. Yunnan Salt Industrial Salt Sales (K MT), Revenue (US$ Million), Price (USD/MT), and Gross Margin (2017-2022)
Table 151. Yunnan Salt Industrial Salt Product Model Numbers, Pictures, Descriptions, and Specifications
Table 152. Yunnan Salt Recent Development
Table 153. Lantai Industry Corporation Information
Table 154. Lantai Industry Description and Major Businesses
Table 155. Lantai Industry Industrial Salt Sales (K MT), Revenue (US$ Million), Price (USD/MT), and Gross Margin (2017-2022)
Table 156. Lantai Industry Industrial Salt Product Model Numbers, Pictures, Descriptions, and Specifications
Table 157. Lantai Industry Recent Development
Table 158. Chengyuan Salt Corporation Information
Table 159. Chengyuan Salt Description and Major Businesses
Table 160. Chengyuan Salt Industrial Salt Sales (K MT), Revenue (US$ Million), Price (USD/MT), and Gross Margin (2017-2022)
Table 161. Chengyuan Salt Industrial Salt Product Model Numbers, Pictures, Descriptions, and Specifications
Table 162. Chengyuan Salt Recent Development
Table 163. Jingshen Salt & Chemical Corporation Information
Table 164. Jingshen Salt & Chemical Description and Major Businesses
Table 165. Jingshen Salt & Chemical Industrial Salt Sales (K MT), Revenue (US$ Million), Price (USD/MT), and Gross Margin (2017-2022)
Table 166. Jingshen Salt & Chemical Industrial Salt Product Model Numbers, Pictures, Descriptions, and Specifications
Table 167. Jingshen Salt & Chemical Recent Development
Table 168. Longwei Corporation Information
Table 169. Longwei Description and Major Businesses
Table 170. Longwei Industrial Salt Sales (K MT), Revenue (US$ Million), Price (USD/MT), and Gross Margin (2017-2022)
Table 171. Longwei Industrial Salt Product Model Numbers, Pictures, Descriptions, and Specifications
Table 172. Longwei Recent Development
Table 173. Chengkou Corporation Information
Table 174. Chengkou Description and Major Businesses
Table 175. Chengkou Industrial Salt Sales (K MT), Revenue (US$ Million), Price (USD/MT), and Gross Margin (2017-2022)
Table 176. Chengkou Industrial Salt Product Model Numbers, Pictures, Descriptions, and Specifications
Table 177. Chengkou Recent Development
Table 178. Lubei Chemical Corporation Information
Table 179. Lubei Chemical Description and Major Businesses
Table 180. Lubei Chemical Industrial Salt Sales (K MT), Revenue (US$ Million), Price (USD/MT), and Gross Margin (2017-2022)
Table 181. Lubei Chemical Industrial Salt Product Model Numbers, Pictures, Descriptions, and Specifications
Table 182. Lubei Chemical Recent Development
Table 183. Dadi Salt Corporation Information
Table 184. Dadi Salt Description and Major Businesses
Table 185. Dadi Salt Industrial Salt Sales (K MT), Revenue (US$ Million), Price (USD/MT), and Gross Margin (2017-2022)
Table 186. Dadi Salt Industrial Salt Product Model Numbers, Pictures, Descriptions, and Specifications
Table 187. Dadi Salt Recent Development
Table 188. Key Raw Materials Lists
Table 189. Raw Materials Key Suppliers Lists
Table 190. Industrial Salt Distributors List
Table 191. Industrial Salt Customers List
Table 192. Industrial Salt Market Trends
Table 193. Industrial Salt Market Drivers
Table 194. Industrial Salt Market Challenges
Table 195. Industrial Salt Market Restraints
Table 196. Research Programs/Design for This Report
Table 197. Key Data Information from Secondary Sources
Table 198. Key Data Information from Primary Sources
List of Figures
Figure 1. Industrial Salt Product Picture
Figure 2. Global Industrial Salt Market Share by Type in 2021 & 2028
Figure 3. Sea Salt Product Picture
Figure 4. Well and Rock Salt Product Picture
Figure 5. Lake Salt Product Picture
Figure 6. Global Industrial Salt Market Share by Application in 2021 & 2028
Figure 7. Chemical Processing
Figure 8. De-Icing
Figure 9. Oil & Gas
Figure 10. Water Treatment
Figure 11. Agriculture
Figure 12. Others
Figure 13. Industrial Salt Report Years Considered
Figure 14. Global Industrial Salt Capacity, Production, and Utilization (2017-2028) & (K MT)
Figure 15. Global Industrial Salt Production Market Share by Region in Percentage: 2021 Versus 2028
Figure 16. Global Industrial Salt Production Market Share by Region (2017-2022)
Figure 17. Global Industrial Salt Production Market Share by Region (2023-2028)
Figure 18. Industrial Salt Production Growth Rate in North America (2017-2028) & (K MT)
Figure 19. Industrial Salt Production Growth Rate in Europe (2017-2028) & (K MT)
Figure 20. Industrial Salt Production Growth Rate in China (2017-2028) & (K MT)
Figure 21. Industrial Salt Production Growth Rate in Japan (2017-2028) & (K MT)
Figure 22. Global Industrial Salt Sales 2017-2028 (K MT)
Figure 23. Global Industrial Salt Revenue, (US$ Million), 2017 VS 2021 VS 2028
Figure 24. Global Industrial Salt Revenue 2017-2028 (US$ Million)
Figure 25. Global Industrial Salt Revenue Market Share by Region in Percentage: 2021 Versus 2028
Figure 26. Global Industrial Salt Sales Market Share by Region (2017-2022)
Figure 27. Global Industrial Salt Sales Market Share by Region (2023-2028)
Figure 28. North America Industrial Salt Sales YoY (2017-2028) & (K MT)
Figure 29. North America Industrial Salt Revenue YoY (2017-2028) & (US$ Million)
Figure 30. Europe Industrial Salt Sales YoY (2017-2028) & (K MT)
Figure 31. Europe Industrial Salt Revenue YoY (2017-2028) & (US$ Million)
Figure 32. Asia-Pacific Industrial Salt Sales YoY (2017-2028) & (K MT)
Figure 33. Asia-Pacific Industrial Salt Revenue YoY (2017-2028) & (US$ Million)
Figure 34. Latin America Industrial Salt Sales YoY (2017-2028) & (K MT)
Figure 35. Latin America Industrial Salt Revenue YoY (2017-2028) & (US$ Million)
Figure 36. Middle East & Africa Industrial Salt Sales YoY (2017-2028) & (K MT)
Figure 37. Middle East & Africa Industrial Salt Revenue YoY (2017-2028) & (US$ Million)
Figure 38. The Industrial Salt Market Share of Top 10 and Top 5 Largest Manufacturers Around the World in 2021
Figure 39. The Top 5 and 10 Largest Manufacturers of Industrial Salt in the World: Market Share by Industrial Salt Revenue in 2021
Figure 40. Industrial Salt Market Share by Company Type (Tier 1, Tier 2, and Tier 3): 2017 VS 2021
Figure 41. Global Industrial Salt Sales Market Share by Type (2017-2028)
Figure 42. Global Industrial Salt Revenue Market Share by Type (2017-2028)
Figure 43. Global Industrial Salt Sales Market Share by Application (2017-2028)
Figure 44. Global Industrial Salt Revenue Market Share by Application (2017-2028)
Figure 45. North America Industrial Salt Sales Market Share by Type (2017-2028)
Figure 46. North America Industrial Salt Revenue Market Share by Type (2017-2028)
Figure 47. North America Industrial Salt Sales Market Share by Application (2017-2028)
Figure 48. North America Industrial Salt Revenue Market Share by Application (2017-2028)
Figure 49. North America Industrial Salt Sales Share by Country (2017-2028)
Figure 50. North America Industrial Salt Revenue Share by Country (2017-2028)
Figure 51. U.S. Industrial Salt Revenue (2017-2028) & (US$ Million)
Figure 52. Canada Industrial Salt Revenue (2017-2028) & (US$ Million)
Figure 53. Europe Industrial Salt Sales Market Share by Type (2017-2028)
Figure 54. Europe Industrial Salt Revenue Market Share by Type (2017-2028)
Figure 55. Europe Industrial Salt Sales Market Share by Application (2017-2028)
Figure 56. Europe Industrial Salt Revenue Market Share by Application (2017-2028)
Figure 57. Europe Industrial Salt Sales Share by Country (2017-2028)
Figure 58. Europe Industrial Salt Revenue Share by Country (2017-2028)
Figure 59. Germany Industrial Salt Revenue (2017-2028) & (US$ Million)
Figure 60. France Industrial Salt Revenue (2017-2028) & (US$ Million)
Figure 61. U.K. Industrial Salt Revenue (2017-2028) & (US$ Million)
Figure 62. Italy Industrial Salt Revenue (2017-2028) & (US$ Million)
Figure 63. Russia Industrial Salt Revenue (2017-2028) & (US$ Million)
Figure 64. Asia Pacific Industrial Salt Sales Market Share by Type (2017-2028)
Figure 65. Asia Pacific Industrial Salt Revenue Market Share by Type (2017-2028)
Figure 66. Asia Pacific Industrial Salt Sales Market Share by Application (2017-2028)
Figure 67. Asia Pacific Industrial Salt Revenue Market Share by Application (2017-2028)
Figure 68. Asia Pacific Industrial Salt Sales Share by Region (2017-2028)
Figure 69. Asia Pacific Industrial Salt Revenue Share by Region (2017-2028)
Figure 70. China Industrial Salt Revenue (2017-2028) & (US$ Million)
Figure 71. Japan Industrial Salt Revenue (2017-2028) & (US$ Million)
Figure 72. South Korea Industrial Salt Revenue (2017-2028) & (US$ Million)
Figure 73. India Industrial Salt Revenue (2017-2028) & (US$ Million)
Figure 74. Australia Industrial Salt Revenue (2017-2028) & (US$ Million)
Figure 75. China Taiwan Industrial Salt Revenue (2017-2028) & (US$ Million)
Figure 76. Indonesia Industrial Salt Revenue (2017-2028) & (US$ Million)
Figure 77. Thailand Industrial Salt Revenue (2017-2028) & (US$ Million)
Figure 78. Malaysia Industrial Salt Revenue (2017-2028) & (US$ Million)
Figure 79. Latin America Industrial Salt Sales Market Share by Type (2017-2028)
Figure 80. Latin America Industrial Salt Revenue Market Share by Type (2017-2028)
Figure 81. Latin America Industrial Salt Sales Market Share by Application (2017-2028)
Figure 82. Latin America Industrial Salt Revenue Market Share by Application (2017-2028)
Figure 83. Latin America Industrial Salt Sales Share by Country (2017-2028)
Figure 84. Latin America Industrial Salt Revenue Share by Country (2017-2028)
Figure 85. Mexico Industrial Salt Revenue (2017-2028) & (US$ Million)
Figure 86. Brazil Industrial Salt Revenue (2017-2028) & (US$ Million)
Figure 87. Argentina Industrial Salt Revenue (2017-2028) & (US$ Million)
Figure 88. Middle East and Africa Industrial Salt Sales Market Share by Type (2017-2028)
Figure 89. Middle East and Africa Industrial Salt Revenue Market Share by Type (2017-2028)
Figure 90. Middle East and Africa Industrial Salt Sales Market Share by Application (2017-2028)
Figure 91. Middle East and Africa Industrial Salt Revenue Market Share by Application (2017-2028)
Figure 92. Middle East and Africa Industrial Salt Sales Share by Country (2017-2028)
Figure 93. Middle East and Africa Industrial Salt Revenue Share by Country (2017-2028)
Figure 94. Turkey Industrial Salt Revenue (2017-2028) & (US$ Million)
Figure 95. Saudi Arabia Industrial Salt Revenue (2017-2028) & (US$ Million)
Figure 96. UAE Industrial Salt Revenue (2017-2028) & (US$ Million)
Figure 97. Industrial Salt Value Chain
Figure 98. Industrial Salt Production Process
Figure 99. Channels of Distribution
Figure 100. Distributors Profiles
Figure 101. Bottom-up and Top-down Approaches for This Report
Figure 102. Data Triangulation
Figure 103. Key Executives Interviewed
$4900
$9800
