FEATURED COMPANIES
Amazon Web Services
Microsoft Azure
IBM
Aliyun
Google Cloud Platform
Salesforce
Rackspace
SAP
Oracle
VMware Inc
Dell Inc
EMC
GIANT
Microsoft
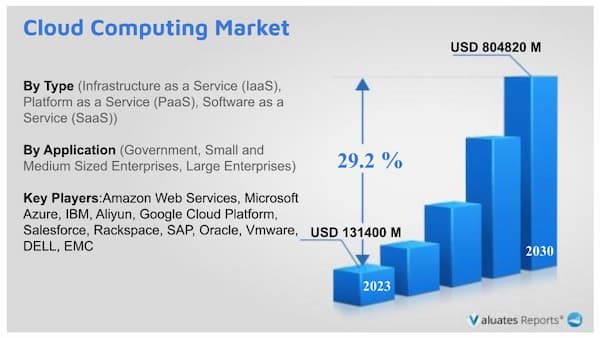
Cloud Computing Market
The global market for Cloud Computing was estimated to be worth US$ 131400 million in 2023 and is forecast to a readjusted size of US$ 804820 million by 2030 with a CAGR of 29.2% during the forecast period 2024-2030.
Cloud Computing is a term that describes a broad range of technology services. It is often described as a stack (see diagram below), as a response to the broad range of services built on top of one another under the moniker “Cloud”. Cloud computing is delivering computing services over the internet, such as servers, storage, databases, networking, software, analytics, and intelligence. These services allow for faster innovation, more flexible resources, and cost savings.
Cloud Computing Market Segment by Type
IaaS contains the basic building blocks for cloud IT. It typically provides access to networking features, computers (virtual or on dedicated hardware), and data storage space. IaaS gives you the highest level of flexibility and management control over your IT resources. It is most similar to the existing IT resources with which many IT departments and developers are familiar.
PaaS removes the need for you to manage underlying infrastructure (usually hardware and operating systems), and allows you to focus on the deployment and management of your applications. This helps you be more efficient as you don’t need to worry about resource procurement, capacity planning, software maintenance, patching, or any of the other undifferentiated heavy lifting involved in running your application.
SaaS provides you with a complete product that is run and managed by the service provider. In most cases, people referring to SaaS are referring to end-user applications (such as web-based email). With a SaaS offering, you don’t have to think about how the service is maintained or how the underlying infrastructure is managed. You only need to think about how you will use that particular software
Cloud Computing Market Trends
Cloud computing is the delivery of different services through the Internet. These resources include tools and applications like data storage, servers, databases, networking, and software. Rather than keeping files on a proprietary hard drive or local storage device, cloud-based storage makes it possible to save them to a remote database. As long as an electronic device has access to the web, it has access to the data and the software programs to run it.
The Cloud Computing industry concentration is unbalanced, and there are many small and new companies in this industry. Global giant manufactures are mainly distributed in U.S..
The manufacturers in the U.S. have a long history and unshakable status in this field. Manufacturers such as Amazon Web Services and Microsoft Azure have relatively higher levels of product’s quality. As for Europe, SAP has become a global leader. In Cina, Aliyun leads the technology development.The key consumption markets are located in developed countries.
North America takes the market share of 38 %, followed by Europe with 26%. China’s consumption market has a quicker growing speed of CAGR above 50%. We tend to believe this industry becomes more and more mature, and the consumption increasing rate will show a smooth curve.
Cloud Computing Market Covid - 19 Impacts
Since the COVID-19 virus outbreak in December 2019, the disease has spread to almost 100 countries around the globe with the World Health Organization declaring it a public health emergency. The global impacts of the coronavirus disease 2019 (COVID-19) are already starting to be felt and will significantly affect the Cloud Computing Service market in 2020.
COVID-19 can affect the global economy in three main ways: by directly affecting production and demand, by creating supply chain and market disruption, and by its financial impact on firms and financial markets.
The outbreak of COVID-19 has brought effects on many aspects, like flight cancellations; travel bans and quarantines; restaurants closed; all indoor events restricted; over forty countries state of emergency declared; massive slowing of the supply chain; stock market volatility; falling business confidence, growing panic among the population, and uncertainty about future.
Healthcare Cloud Computing
In recent years, especially in the field of healthcare, research cooperation has been increasing. Medical institutions and organizations participating in research projects need systems with high computing power. Deploying cloud computing in the healthcare ecosystem has many advantages, including cost savings, increased flexibility, and organizational system scalability. In addition, the use of cloud computing has also promoted better collaborative research between various medical researchers and other stakeholders. A cloud computing module designed specifically for the healthcare ecosystem can help healthcare professionals make accurate decisions while prescribing appropriate medicines to patients.
In particular, the global outbreak of coronavirus disease 2019 (COVID-19) in 2019-2020 will push cloud computing in the healthcare field to a climax. The future development trend of cloud computing in healthcare is very good.
Cloud Computing Market Share Analysis
Global Cloud Computing key players include Amazon Web Services, Microsoft Azure, IBM, Aliyun, Google Cloud Platform, etc. Global top five manufacturers hold a share over 50%.
North America is the largest market, with a share over 35%, followed by EU and Japan, both have a share over 35%.
In terms of product, Infrastructure as a Service (IaaS) is the largest segment, with a share over 50%. And in terms of application, the largest application is Large Enterprises, followed by Small and Medium Sized Enterprises, Government, etc.
Scope of Cloud Computing Market Report
| Report Metric |
Details |
| Report Name |
Cloud Computing Market |
| Accounted market size in 2030 |
US$ 804820 Million |
| Base Year |
2023 |
| Segment by Type |
- Infrastructure as a service (IaaS)
- Platform as a Service (PaaS)
- Software as a Service (SaaS)
|
| Segment by Application |
- Government
- Small and Medium sized enterprises
- Large enterprises
|
| By Region |
- North America (United States, Canada)
- Europe (Germany, France, UK, Italy, Russia) Rest of Europe
- Nordic Countries
- Asia-Pacific (China, Japan, South Korea)
- Southeast Asia (India, Australia)
- Rest of Asia
- Latin America (Mexico, Brazil)
- Rest of Latin America
- Middle East & Africa (Turkey, Saudi Arabia, UAE, Rest of MEA)
|
| By Company |
Amazon Web Services, Microsoft Azure, IBM, Aliyun, Google Cloud Platform, Salesforce, Rackspace, SAP, Oracle, Vmware, DELL, EMC |
| Forecast units |
USD million in value |
| Report coverage |
Revenue and volume forecast, company share, competitive landscape, growth factors and trends |
1 Study Coverage
1.1 Cloud Computing Product Introduction
1.2 Market by Type
1.2.1 Global Cloud Computing Market Size Growth Rate by Type (2019 VS 2023 VS 2030)
1.2.2 Infrastructure as a Service (IaaS)
1.2.3 Platform as a Service (PaaS)
1.2.4 Software as a Service (SaaS)
1.3 Market by Application
1.3.1 Global Cloud Computing Market Size Growth Rate by Application (2019 VS 2023 VS 2030)
1.3.2 Government
1.3.3 Small and Medium Sized Enterprises
1.3.4 Large Enterprises
1.4 Assumptions and Limitations
1.5 Study Objectives
1.6 Years Considered
2 Executive Summary
2.1 Global Cloud Computing Market Size Estimates and Forecasts
2.2 Cloud Computing Market Size by Region: 2023 Versus 2030
2.2.1 Global Cloud Computing Revenue by Region: 2019-2024
2.2.2 Global Cloud Computing Revenue Forecast by Region (2025-2030)
2.2.3 Global Cloud Computing Revenue Market Share by Region (2019-2030)
3 Global Cloud Computing by Company
3.1 Global Cloud Computing Revenue by Company (2019-2024)
3.2 Global Cloud Computing Revenue Share by Company (2019-2024)
3.3 Competitive Landscape
3.3.1 Key Cloud Computing Companies around the World: Ranking by Revenue
3.3.2 Global Cloud Computing Market Concentration Ratio (CR5 and HHI) & (2019-2024)
3.3.3 Global Cloud Computing Market Share by Company Type (Tier 1, Tier 2 and Tier 3)
3.4 Global Cloud Computing Companies Headquarters & Product Type
3.4.1 Cloud Computing Companies Headquarters
3.4.2 Global Cloud Computing Companies Product & Service
3.4.3 Date of International Companies Enter into Cloud Computing Market
3.5 Global Cloud Computing Mergers & Acquisitions, Expansion Plans
4 Company Profiles
4.1 Amazon Web Services
4.1.1 Amazon Web Services Company Information
4.1.2 Amazon Web Services Description, Business Overview
4.1.3 Amazon Web Services Cloud Computing Products Offered
4.1.4 Amazon Web Services Cloud Computing Revenue and Gross Margin (2019-2024)
4.1.5 Amazon Web Services Cloud Computing Revenue by Product in 2023
4.1.6 Amazon Web Services Cloud Computing Revenue by Application in 2023
4.1.7 Amazon Web Services Cloud Computing Revenue by Geographic Area in 2023
4.1.8 Amazon Web Services Recent Developments
4.2 Microsoft Azure
4.2.1 Microsoft Azure Company Information
4.2.2 Microsoft Azure Description, Business Overview
4.2.3 Microsoft Azure Cloud Computing Products Offered
4.2.4 Microsoft Azure Cloud Computing Revenue and Gross Margin (2019-2024)
4.2.5 Microsoft Azure Cloud Computing Revenue by Product in 2023
4.2.6 Microsoft Azure Cloud Computing Revenue by Application in 2023
4.2.7 Microsoft Azure Cloud Computing Revenue by Geographic Area in 2023
4.2.8 Microsoft Azure Recent Developments
4.3 IBM
4.3.1 IBM Company Information
4.3.2 IBM Description, Business Overview
4.3.3 IBM Cloud Computing Products Offered
4.3.4 IBM Cloud Computing Revenue and Gross Margin (2019-2024)
4.3.5 IBM Cloud Computing Revenue by Product in 2023
4.3.6 IBM Cloud Computing Revenue by Application in 2023
4.3.7 IBM Cloud Computing Revenue by Geographic Area in 2023
4.3.8 IBM Recent Developments
4.4 Aliyun
4.4.1 Aliyun Company Information
4.4.2 Aliyun Description, Business Overview
4.4.3 Aliyun Cloud Computing Products Offered
4.4.4 Aliyun Cloud Computing Revenue and Gross Margin (2019-2024)
4.4.5 Aliyun Cloud Computing Revenue by Product in 2023
4.4.6 Aliyun Cloud Computing Revenue by Application in 2023
4.4.7 Aliyun Cloud Computing Revenue by Geographic Area in 2023
4.4.8 Aliyun Recent Developments
4.5 Google Cloud Platform
4.5.1 Google Cloud Platform Company Information
4.5.2 Google Cloud Platform Description, Business Overview
4.5.3 Google Cloud Platform Cloud Computing Products Offered
4.5.4 Google Cloud Platform Cloud Computing Revenue and Gross Margin (2019-2024)
4.5.5 Google Cloud Platform Cloud Computing Revenue by Product in 2023
4.5.6 Google Cloud Platform Cloud Computing Revenue by Application in 2023
4.5.7 Google Cloud Platform Cloud Computing Revenue by Geographic Area in 2023
4.5.8 Google Cloud Platform Recent Developments
4.6 Salesforce
4.6.1 Salesforce Company Information
4.6.2 Salesforce Description, Business Overview
4.6.3 Salesforce Cloud Computing Products Offered
4.6.4 Salesforce Cloud Computing Revenue and Gross Margin (2019-2024)
4.6.5 Salesforce Cloud Computing Revenue by Product in 2023
4.6.6 Salesforce Cloud Computing Revenue by Application in 2023
4.6.7 Salesforce Cloud Computing Revenue by Geographic Area in 2023
4.6.8 Salesforce Recent Development
4.7 Rackspace
4.7.1 Rackspace Company Information
4.7.2 Rackspace Description, Business Overview
4.7.3 Rackspace Cloud Computing Products Offered
4.7.4 Rackspace Cloud Computing Revenue and Gross Margin (2019-2024)
4.7.5 Rackspace Cloud Computing Revenue by Product in 2023
4.7.6 Rackspace Cloud Computing Revenue by Application in 2023
4.7.7 Rackspace Cloud Computing Revenue by Geographic Area in 2023
4.7.8 Rackspace Recent Development
4.8 SAP
4.8.1 SAP Company Information
4.8.2 SAP Description, Business Overview
4.8.3 SAP Cloud Computing Products Offered
4.8.4 SAP Cloud Computing Revenue and Gross Margin (2019-2024)
4.8.5 SAP Cloud Computing Revenue by Product in 2023
4.8.6 SAP Cloud Computing Revenue by Application in 2023
4.8.7 SAP Cloud Computing Revenue by Geographic Area in 2023
4.8.8 SAP Recent Development
4.9 Oracle
4.9.1 Oracle Company Information
4.9.2 Oracle Description, Business Overview
4.9.3 Oracle Cloud Computing Products Offered
4.9.4 Oracle Cloud Computing Revenue and Gross Margin (2019-2024)
4.9.5 Oracle Cloud Computing Revenue by Product in 2023
4.9.6 Oracle Cloud Computing Revenue by Application in 2023
4.9.7 Oracle Cloud Computing Revenue by Geographic Area in 2023
4.9.8 Oracle Recent Development
4.10 Vmware
4.10.1 Vmware Company Information
4.10.2 Vmware Description, Business Overview
4.10.3 Vmware Cloud Computing Products Offered
4.10.4 Vmware Cloud Computing Revenue and Gross Margin (2019-2024)
4.10.5 Vmware Cloud Computing Revenue by Product in 2023
4.10.6 Vmware Cloud Computing Revenue by Application in 2023
4.10.7 Vmware Cloud Computing Revenue by Geographic Area in 2023
4.10.8 Vmware Recent Development
4.11 DELL
4.11.1 DELL Company Information
4.11.2 DELL Description, Business Overview
4.11.3 DELL Cloud Computing Products Offered
4.11.4 DELL Cloud Computing Revenue and Gross Margin (2019-2024)
4.11.5 DELL Cloud Computing Revenue by Product in 2023
4.11.6 DELL Cloud Computing Revenue by Application in 2023
4.11.7 DELL Cloud Computing Revenue by Geographic Area in 2023
4.11.8 DELL Recent Development
4.12 EMC
4.12.1 EMC Company Information
4.12.2 EMC Description, Business Overview
4.12.3 EMC Cloud Computing Products Offered
4.12.4 EMC Cloud Computing Revenue and Gross Margin (2019-2024)
4.12.5 EMC Cloud Computing Revenue by Product in 2023
4.12.6 EMC Cloud Computing Revenue by Application in 2023
4.12.7 EMC Cloud Computing Revenue by Geographic Area in 2023
4.12.8 EMC Recent Development
5 Breakdown Data by Type
5.1 Global Cloud Computing Revenue by Type (2019-2024)
5.2 Global Cloud Computing Revenue Forecast by Type (2025-2030)
5.3 Cloud Computing Revenue Market Share by Type (2019-2030)
6 Breakdown Data by Application
6.1 Global Cloud Computing Revenue by Application (2019-2024)
6.2 Global Cloud Computing Revenue Forecast by Application (2025-2030)
6.3 Cloud Computing Revenue Market Share by Application (2019-2030)
7 North America
7.1 North America Cloud Computing Market Size YoY Growth 2019-2030
7.2 North America Cloud Computing Market Facts & Figures by Country (2019-2030)
7.3 North America Cloud Computing Revenue by Type (2019-2024)
7.4 North America Cloud Computing Revenue by Application (2019-2024)
8 Asia-Pacific
8.1 Asia-Pacific Cloud Computing Market Size YoY Growth 2019-2030
8.2 Asia-Pacific Cloud Computing Market Facts & Figures by Region (2019-2030)
8.3 Asia-Pacific Cloud Computing Revenue by Type (2019-2024)
8.4 Asia-Pacific Cloud Computing Revenue by Application (2019-2024)
9 Europe
9.1 Europe Cloud Computing Market Size YoY Growth 2019-2030
9.2 Europe Cloud Computing Market Facts & Figures by Country (2019-2030)
9.3 Europe Cloud Computing Revenue by Type (2019-2024)
9.4 Europe Cloud Computing Revenue by Application (2019-2024)
10 Latin America
10.1 Latin America Cloud Computing Market Size YoY Growth 2019-2030
10.2 Latin America Cloud Computing Market Facts & Figures by Country (2019-2030)
10.3 Latin America Cloud Computing Revenue by Type (2019-2024)
10.4 Latin America Cloud Computing Revenue by Application (2019-2024)
11 Middle East and Africa
11.1 Middle East and Africa Cloud Computing Market Size YoY Growth 2019-2030
11.2 Middle East and Africa Cloud Computing Market Facts & Figures by Country (2019-2030)
11.3 Middle East and Africa Cloud Computing Revenue by Type (2019-2024)
11.4 Middle East and Africa Cloud Computing Revenue by Application (2019-2024)
12 Supply Chain and Sales Channel Analysis
12.1 Cloud Computing Supply Chain Analysis
12.2 Cloud Computing Key Raw Materials and Upstream Suppliers
12.3 Cloud Computing Clients Analysis
12.4 Cloud Computing Sales Channel and Sales Model Analysis
12.4.1 Cloud Computing Distribution Channel Analysis: Indirect Sales VS Direct Sales
12.4.2 Cloud Computing Distribution Channel Analysis: Online Sales VS Offline Sales
12.4.3 Cloud Computing Distributors
13 Market Dynamics
13.1 Cloud Computing Industry Trends
13.2 Cloud Computing Market Drivers
13.3 Cloud Computing Market Challenges
13.4 Cloud Computing Market Restraints
14 Research Findings and Conclusion
15 Appendix
15.1 Research Methodology
15.1.1 Methodology/Research Approach
15.1.2 Data Source
15.2 Author Details
15.3 Disclaimer
FEATURED COMPANIES
Amazon Web Services
Microsoft Azure
IBM
Aliyun
Google Cloud Platform
Salesforce
Rackspace
SAP
Oracle
VMware Inc
Dell Inc
EMC
GIANT
Microsoft
List of Tables
Table 1. Global Simethicone Market Value by Type, (US$ Million) & (2023 VS 2030)
Table 2. Global Simethicone Market Value by Application, (US$ Million) & (2023 VS 2030)
Table 3. Global Simethicone Production Capacity (MT) by Manufacturers in 2023
Table 4. Global Simethicone Production by Manufacturers (2019-2024) & (MT)
Table 5. Global Simethicone Production Market Share by Manufacturers (2019-2024)
Table 6. Global Simethicone Production Value by Manufacturers (2019-2024) & (US$ Million)
Table 7. Global Simethicone Production Value Share by Manufacturers (2019-2024)
Table 8. Global Simethicone Industry Ranking 2022 VS 2023 VS 2024
Table 9. Company Type (Tier 1, Tier 2 and Tier 3) & (based on the Revenue in Simethicone as of 2023)
Table 10. Global Market Simethicone Average Price by Manufacturers (USD/Kg) & (2019-2024)
Table 11. Manufacturers Simethicone Production Sites and Area Served
Table 12. Manufacturers Simethicone Product Types
Table 13. Global Simethicone Manufacturers Market Concentration Ratio (CR5 and HHI)
Table 14. Mergers & Acquisitions, Expansion
Table 15. Global Simethicone Production Value by Region: 2019 VS 2023 VS 2030 (US$ Million)
Table 16. Global Simethicone Production Value (US$ Million) by Region (2019-2024)
Table 17. Global Simethicone Production Value Market Share by Region (2019-2024)
Table 18. Global Simethicone Production Value (US$ Million) Forecast by Region (2025-2030)
Table 19. Global Simethicone Production Value Market Share Forecast by Region (2025-2030)
Table 20. Global Simethicone Production Comparison by Region: 2019 VS 2023 VS 2030 (MT)
Table 21. Global Simethicone Production (MT) by Region (2019-2024)
Table 22. Global Simethicone Production Market Share by Region (2019-2024)
Table 23. Global Simethicone Production (MT) Forecast by Region (2025-2030)
Table 24. Global Simethicone Production Market Share Forecast by Region (2025-2030)
Table 25. Global Simethicone Market Average Price (USD/Kg) by Region (2019-2024)
Table 26. Global Simethicone Market Average Price (USD/Kg) by Region (2025-2030)
Table 27. Global Simethicone Consumption Growth Rate by Region: 2019 VS 2023 VS 2030 (MT)
Table 28. Global Simethicone Consumption by Region (2019-2024) & (MT)
Table 29. Global Simethicone Consumption Market Share by Region (2019-2024)
Table 30. Global Simethicone Forecasted Consumption by Region (2025-2030) & (MT)
Table 31. Global Simethicone Forecasted Consumption Market Share by Region (2019-2024)
Table 32. North America Simethicone Consumption Growth Rate by Country: 2019 VS 2023 VS 2030 (MT)
Table 33. North America Simethicone Consumption by Country (2019-2024) & (MT)
Table 34. North America Simethicone Consumption by Country (2025-2030) & (MT)
Table 35. Europe Simethicone Consumption Growth Rate by Country: 2019 VS 2023 VS 2030 (MT)
Table 36. Europe Simethicone Consumption by Country (2019-2024) & (MT)
Table 37. Europe Simethicone Consumption by Country (2025-2030) & (MT)
Table 38. Asia Pacific Simethicone Consumption Growth Rate by Region: 2019 VS 2023 VS 2030 (MT)
Table 39. Asia Pacific Simethicone Consumption by Region (2019-2024) & (MT)
Table 40. Asia Pacific Simethicone Consumption by Region (2025-2030) & (MT)
Table 41. Latin America, Middle East & Africa Simethicone Consumption Growth Rate by Country: 2019 VS 2023 VS 2030 (MT)
Table 42. Latin America, Middle East & Africa Simethicone Consumption by Country (2019-2024) & (MT)
Table 43. Latin America, Middle East & Africa Simethicone Consumption by Country (2025-2030) & (MT)
Table 44. Global Simethicone Production (MT) by Type (2019-2024)
Table 45. Global Simethicone Production (MT) by Type (2025-2030)
Table 46. Global Simethicone Production Market Share by Type (2019-2024)
Table 47. Global Simethicone Production Market Share by Type (2025-2030)
Table 48. Global Simethicone Production Value (US$ Million) by Type (2019-2024)
Table 49. Global Simethicone Production Value (US$ Million) by Type (2025-2030)
Table 50. Global Simethicone Production Value Share by Type (2019-2024)
Table 51. Global Simethicone Production Value Share by Type (2025-2030)
Table 52. Global Simethicone Price (USD/Kg) by Type (2019-2024)
Table 53. Global Simethicone Price (USD/Kg) by Type (2025-2030)
Table 54. Global Simethicone Production (MT) by Application (2019-2024)
Table 55. Global Simethicone Production (MT) by Application (2025-2030)
Table 56. Global Simethicone Production Market Share by Application (2019-2024)
Table 57. Global Simethicone Production Market Share by Application (2025-2030)
Table 58. Global Simethicone Production Value (US$ Million) by Application (2019-2024)
Table 59. Global Simethicone Production Value (US$ Million) by Application (2025-2030)
Table 60. Global Simethicone Production Value Share by Application (2019-2024)
Table 61. Global Simethicone Production Value Share by Application (2025-2030)
Table 62. Global Simethicone Price (USD/Kg) by Application (2019-2024)
Table 63. Global Simethicone Price (USD/Kg) by Application (2025-2030)
Table 64. Wacker Simethicone Corporation Information
Table 65. Wacker Specification and Application
Table 66. Wacker Simethicone Production (MT), Value (US$ Million), Price (USD/Kg) and Gross Margin (2019-2024)
Table 67. Wacker Main Business and Markets Served
Table 68. Wacker Recent Developments/Updates
Table 69. Dow Corning Simethicone Corporation Information
Table 70. Dow Corning Specification and Application
Table 71. Dow Corning Simethicone Production (MT), Value (US$ Million), Price (USD/Kg) and Gross Margin (2019-2024)
Table 72. Dow Corning Main Business and Markets Served
Table 73. Dow Corning Recent Developments/Updates
Table 74. KCC Basildon Simethicone Corporation Information
Table 75. KCC Basildon Specification and Application
Table 76. KCC Basildon Simethicone Production (MT), Value (US$ Million), Price (USD/Kg) and Gross Margin (2019-2024)
Table 77. KCC Basildon Main Business and Markets Served
Table 78. KCC Basildon Recent Developments/Updates
Table 79. NuSil Simethicone Corporation Information
Table 80. NuSil Specification and Application
Table 81. NuSil Simethicone Production (MT), Value (US$ Million), Price (USD/Kg) and Gross Margin (2019-2024)
Table 82. NuSil Main Business and Markets Served
Table 83. NuSil Recent Developments/Updates
Table 84. Shin-Etsu Simethicone Corporation Information
Table 85. Shin-Etsu Specification and Application
Table 86. Shin-Etsu Simethicone Production (MT), Value (US$ Million), Price (USD/Kg) and Gross Margin (2019-2024)
Table 87. Shin-Etsu Main Business and Markets Served
Table 88. Shin-Etsu Recent Developments/Updates
Table 89. RioCare India Simethicone Corporation Information
Table 90. RioCare India Specification and Application
Table 91. RioCare India Simethicone Production (MT), Value (US$ Million), Price (USD/Kg) and Gross Margin (2019-2024)
Table 92. RioCare India Main Business and Markets Served
Table 93. RioCare India Recent Developments/Updates
Table 94. Resil Simethicone Corporation Information
Table 95. Resil Specification and Application
Table 96. Resil Simethicone Production (MT), Value (US$ Million), Price (USD/Kg) and Gross Margin (2019-2024)
Table 97. Resil Main Business and Markets Served
Table 98. Resil Recent Developments/Updates
Table 99. Biomax Simethicone Corporation Information
Table 100. Biomax Specification and Application
Table 101. Biomax Simethicone Production (MT), Value (US$ Million), Price (USD/Kg) and Gross Margin (2019-2024)
Table 102. Biomax Main Business and Markets Served
Table 103. Biomax Recent Developments/Updates
Table 104. Key Raw Materials Lists
Table 105. Raw Materials Key Suppliers Lists
Table 106. Simethicone Distributors List
Table 107. Simethicone Customers List
Table 108. Simethicone Market Trends
Table 109. Simethicone Market Drivers
Table 110. Simethicone Market Challenges
Table 111. Simethicone Market Restraints
Table 112. Research Programs/Design for This Report
Table 113. Key Data Information from Secondary Sources
Table 114. Key Data Information from Primary Sources
List of Figures
Figure 1. Product Picture of Simethicone
Figure 2. Global Simethicone Market Value by Type, (US$ Million) & (2023 VS 2030)
Figure 3. Global Simethicone Market Share by Type: 2023 VS 2030
Figure 4. Simethicone (100%) Product Picture
Figure 5. Simethicone Emulsion (30%) Product Picture
Figure 6. Global Simethicone Market Value by Application, (US$ Million) & (2023 VS 2030)
Figure 7. Global Simethicone Market Share by Application: 2023 VS 2030
Figure 8. Pharmaceutically Active Ingredient
Figure 9. Pharmaceutical Excipient
Figure 10. Other
Figure 11. Global Simethicone Production Value (US$ Million), 2019 VS 2023 VS 2030
Figure 12. Global Simethicone Production Value (US$ Million) & (2019-2030)
Figure 13. Global Simethicone Production Capacity (MT) & (2019-2030)
Figure 14. Global Simethicone Production (MT) & (2019-2030)
Figure 15. Global Simethicone Average Price (USD/Kg) & (2019-2030)
Figure 16. Simethicone Report Years Considered
Figure 17. Simethicone Production Share by Manufacturers in 2023
Figure 18. Simethicone Market Share by Company Type (Tier 1, Tier 2, and Tier 3): 2019 VS 2023
Figure 19. The Global 5 and 10 Largest Players: Market Share by Simethicone Revenue in 2023
Figure 20. Global Simethicone Production Value by Region: 2019 VS 2023 VS 2030 (US$ Million)
Figure 21. Global Simethicone Production Value Market Share by Region: 2019 VS 2023 VS 2030
Figure 22. Global Simethicone Production Comparison by Region: 2019 VS 2023 VS 2030 (MT)
Figure 23. Global Simethicone Production Market Share by Region: 2019 VS 2023 VS 2030
Figure 24. North America Simethicone Production Value (US$ Million) Growth Rate (2019-2030)
Figure 25. Europe Simethicone Production Value (US$ Million) Growth Rate (2019-2030)
Figure 26. China Simethicone Production Value (US$ Million) Growth Rate (2019-2030)
Figure 27. Japan Simethicone Production Value (US$ Million) Growth Rate (2019-2030)
Figure 28. India Simethicone Production Value (US$ Million) Growth Rate (2019-2030)
Figure 29. Global Simethicone Consumption by Region: 2019 VS 2023 VS 2030 (MT)
Figure 30. Global Simethicone Consumption Market Share by Region: 2019 VS 2023 VS 2030
Figure 31. North America Simethicone Consumption and Growth Rate (2019-2024) & (MT)
Figure 32. North America Simethicone Consumption Market Share by Country (2019-2030)
Figure 33. Canada Simethicone Consumption and Growth Rate (2019-2024) & (MT)
Figure 34. U.S. Simethicone Consumption and Growth Rate (2019-2024) & (MT)
Figure 35. Europe Simethicone Consumption and Growth Rate (2019-2024) & (MT)
Figure 36. Europe Simethicone Consumption Market Share by Country (2019-2030)
Figure 37. Germany Simethicone Consumption and Growth Rate (2019-2024) & (MT)
Figure 38. France Simethicone Consumption and Growth Rate (2019-2024) & (MT)
Figure 39. U.K. Simethicone Consumption and Growth Rate (2019-2024) & (MT)
Figure 40. Italy Simethicone Consumption and Growth Rate (2019-2024) & (MT)
Figure 41. Russia Simethicone Consumption and Growth Rate (2019-2024) & (MT)
Figure 42. Asia Pacific Simethicone Consumption and Growth Rate (2019-2024) & (MT)
Figure 43. Asia Pacific Simethicone Consumption Market Share by Regions (2019-2030)
Figure 44. China Simethicone Consumption and Growth Rate (2019-2024) & (MT)
Figure 45. Japan Simethicone Consumption and Growth Rate (2019-2024) & (MT)
Figure 46. South Korea Simethicone Consumption and Growth Rate (2019-2024) & (MT)
Figure 47. China Taiwan Simethicone Consumption and Growth Rate (2019-2024) & (MT)
Figure 48. Southeast Asia Simethicone Consumption and Growth Rate (2019-2024) & (MT)
Figure 49. India Simethicone Consumption and Growth Rate (2019-2024) & (MT)
Figure 50. Latin America, Middle East & Africa Simethicone Consumption and Growth Rate (2019-2024) & (MT)
Figure 51. Latin America, Middle East & Africa Simethicone Consumption Market Share by Country (2019-2030)
Figure 52. Mexico Simethicone Consumption and Growth Rate (2019-2024) & (MT)
Figure 53. Brazil Simethicone Consumption and Growth Rate (2019-2024) & (MT)
Figure 54. Turkey Simethicone Consumption and Growth Rate (2019-2024) & (MT)
Figure 55. GCC Countries Simethicone Consumption and Growth Rate (2019-2024) & (MT)
Figure 56. Global Production Market Share of Simethicone by Type (2019-2030)
Figure 57. Global Production Value Market Share of Simethicone by Type (2019-2030)
Figure 58. Global Simethicone Price (USD/Kg) by Type (2019-2030)
Figure 59. Global Production Market Share of Simethicone by Application (2019-2030)
Figure 60. Global Production Value Market Share of Simethicone by Application (2019-2030)
Figure 61. Global Simethicone Price (USD/Kg) by Application (2019-2030)
Figure 62. Simethicone Value Chain
Figure 63. Simethicone Production Process
Figure 64. Channels of Distribution (Direct Vs Distribution)
Figure 65. Distributors Profiles
Figure 66. Bottom-up and Top-down Approaches for This Report
Figure 67. Data Triangulation

